Characterization of dust collected in EAST after 2019 campaign
2021-07-07KunZHANG章坤RuiDING丁锐JiaoPENG彭姣RongYAN鄢容JunlingCHEN陈俊凌DahuanZHU朱大焕ChangjunLI李长君andXiongyuanSI司雄元
Kun ZHANG(章坤),Rui DING(丁锐),Jiao PENG(彭姣),Rong YAN(鄢容),Junling CHEN(陈俊凌),Dahuan ZHU(朱大焕),Changjun LI(李长君) and Xiongyuan SI(司雄元)
1 Institute of Plasma Physics,Hefei Institutes of Physical Science,Chinese Academy of Sciences,Hefei 230031,People’s Republic of China
2 University of Science and Technology of China,Hefei 230026,People’s Republic of China
3 Biotechnology Center,Anhui Agricultural University,Hefei 230026,People’s Republic of China
Abstract Dust presented in experimental advanced superconducting tokamak(EAST)with mixed plasmafacing materials has been collected and characterized for the first time.Dust at different positions in the vessel was collected by vacuum cleaner after the first experimental campaign in 2019.The shape,composition,and size of dust particles have been analyzed using different methods.About 80% of the total number of dust particles have size between 20 and 80 μm,and most of dust particles are spherical,while schistose shape,columnar and irregular shape were also found.With the help of energy-dispersive x-ray spectroscopy different elements of dust have been identified,which is generally consistent with the different plasma-facing components in EAST.Both x-ray fluorescence and inductively coupled plasma emission spectrometer are complementary methods for measuring the dust composition quantitatively.It was found that the major components of dust were lithium dust in the form of lithium carbonate and lithium hydroxide,which is due to the routine lithium wall conditioning during EAST operation.
Keywords:tokamak,dust,morphology,composition analysis
1.Introduction
Dust originated during operation of magnetically fusion devices may ultimately affect its safety and operational performance.Chemical activity,tritium retention and radioactivity are the main safety concerns of fusion reactors about dust.Due to the weak adhesion of dust to material surface,dust particles may be sprayed into the plasma,leading to disruptive events[1,2].Dust can move and hit the first wall at very high speed,and thus cause damage to the wall materials.Furthermore,dust particles can cause interference and misjudgment for diagnostic devices.Over the last twenty years,dust issues have been intensively studied on various tokamaks,which advances significantly in understanding dust generation and transport.Dust collection and characterization were performed to study shape,size,and mass of dust in TEXTOR[3],MAST[4],FTU[5],ASDEX Upgrade[6],Tore Supra[7],DIII-D[8],Alcator C-Mod[9]and JET[10].Many mechanisms are responsible for the generation of dust in different machines,such as spalling of the redeposited layers,droplet ejection due to melting induced by enhanced heat loads onto the plasma facing materials(PFMs)during arcing or transient events.The devices with carbon-based PFMs normally produce more dust than all-metal materials.Carbon dust is relatively large and mainly in the form of flakes due to exfoliation of the co-deposition layer,while metal dust is generally in the form of droplets mainly due to metal surface melting caused by high heat loads,although metal deposition layers could be formed[11,12].PFMs in ITER will consist of both low-Zberyllium and high-Ztungsten.The composition of dust from mixed material environment needs to be studied.
The experimental advanced superconducting tokamak(EAST)is a fully superconducting tokamak with ITER-like divertor configuration and heating schemes.EAST aims to achieve long pulse and high-performance plasma,and provides operational experiences for the next step tokamaks.The PFMs in EAST include doped graphite tiles named GBST1308(1%B4C,2.5%Si,7.5%Ti)with ~100 μm thick SiC coating on the top surface at the lower divertor[13],molybdenum alloy(TZM)tiles and a small amount of doped graphite tiles at the first wall,tungsten at the upper divertor[14]and other materials like stainless steel,copper,aluminum etc from diagnostics and auxiliary heating system.Figure 1 shows the internal view of EAST vacuum vessel with different PFMs.In addition,lithium coating has been used for wall conditioning routinely during EAST operations to reduce neutral recycling and improve plasma performance[15,16].Therefore,dust composition may include various materials in EAST.Furthermore,severe damages to the ITER-like tungsten divertor were found and tungsten melting leads to ejection of tungsten droplets during plasma operation[17].It is also interesting to know if such damage can significantly increase the number of tungsten dust.Dust behavior has previously been monitoredin situby fast CCD cameras on EAST[18].In this work,post-mortem analysis has been performed to study morphologies,sizes and compositions of dust collected after the 2019 campaign.

Figure 1.Internal view of EAST vacuum vessel with different PFMs:upper tungsten divertor,lower carbon divertor and first wall molybdenum tiles.
2.Experimental procedure
In the first campaign in 2019,the number of effective shots was 3855 with a total plasma time of 30 472 s.The total injected energy was 70 422 MJ from auxiliary heating by radio-frequency(RF)heating and neutral beam injection.The typical plasma current was from 250 to 750 kA and electron density is(1.5–5.5)×1019m-3.After the campaign,dust was collected right after venting of the vacuum vessel to minimize pollution.Vacuum cleaner is the main tool for dust collection.The dustbin of the vacuum cleaner was removed and a clean cloth was used to cover the dustbin and collect dust.Then,dust was transferred from the cloth to sample bags for storage,which can be easily used for further analysis.In addition,carbon sticky pads were used to scrape away the dust that might stick to the chamber wall materials at different locations,and this method was firstly used in JET[11].The electronic analytical balance with a resolution of 0.005 mg was used to measure the weight of dust.The weight of the carbon sticky pads was measured before and after the dust collection to obtain the net weight of dust.The total weight of collected dust was 18 g.Only less than 1 g dust was collected by sticky carbon pads.Most of the dust was collected in the divertor region,and only a small amount was found on the first wall tiles or near the limiters.The dust particles were characterized in terms of their morphology,size,and composition,using various methods.Scanning electron microscopy(SEM)combined with Image-J software were used to identify morphologies and for size measurements.Energydispersive x-ray spectroscopy(EDX),x-ray fluorescence(XRF),x-ray diffraction(XRD)and inductively coupled plasma emission spectrometer(ICP)were used for dust composition measurements.
3.Results
3.1.Dust morphology
Dust in tokamak devices may have various morphologies,such as big debris,spherical granules,flakes,etc[3–11,5].SEM scanning has been performed to observe the morphologic distribution of dust particles from EAST,which is shown in figure 2.It can be seen that most of the particles are spherical with size of about 50–70 μm,which have larger size and rougher surface than the metal spheroids from ASDEX Upgrade[6].In addition to spherical particles,there are also other shapes of particles including cylindrical shape,schistose shape,and irregular shape,as shown in figure 3.
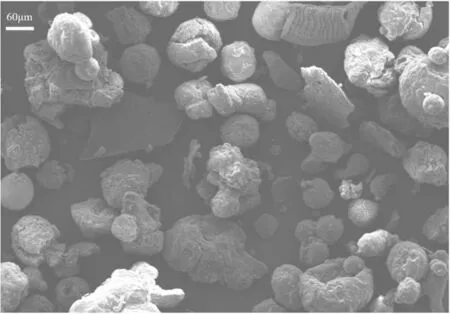
Figure 2.An example of SEM image on dust from EAST.
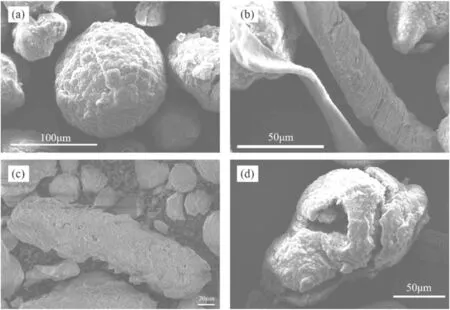
Figure 3.Different shapes of individual dust particles.(a)Spherical,(b)schistose shape,(c)cylindrical shape,(d)irregular shape.
The SEM measurements can identify dust size as small as 1 μm.Based on the SEM images,the size distribution of dust particles was analyzed,as shown in figure 4.It can be observed that about 80%of the total number of dust particles are in the range of 20–80 μm,which is similar to the size distribution of dust from Alcator C-Mod[9].About 8% of dust particles are smaller than 20 μm,and very few particles are larger than 200 μm with a lump form.
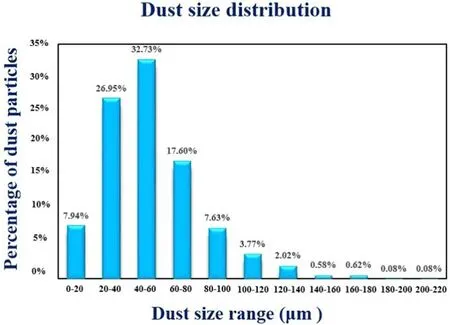
Figure 4.The size distribution of dust particles.
3.2.Dust composition
Analysis of the dust composition can help to identify the origination of dust.XRF measurements were used to get the overall elemental composition of all collected dust.The specific composition and content of different elements are listed in table 1.According to XRF measurements,C and O are the two major elements,with more than 30% each.C is mainly from the graphite tiles at the lower divertor and O may be due to the oxidation process after exposure to air;Fe,Cr,Ni,and Mn are the main components of stainless steels,which come from some diagnostics,shutters etc;W may be originated from the upper divertor or the guard limiter of the LHCD(lower hybrid current drive)antenna.Mo mainly comes from the molybdenum tile on the first wall;Cu and Almay be produced from plasma-facing diagnostic components and RF heating system.Si comes from the silicon carbide coating on the graphite tile;Zn may come from copper alloy components of the heating system,and S may come from outside of the device.Other elements such as Ca,K,Mg,are the main component of glass fiber,which may come from the insulating material used in some instruments in the device.

Table 1.XRF measurement results.
XRF can only give a semi-quantitative elemental composition of dust,but the light elements Li and B cannot be detected.In order to measure the missed elements,ICP was used to quantitatively measure the weight of different elements in the dust more precisely,especially for the metal materials.The ICP method requires to dissolve dust samples in hydrofluoric acid and aqua regia.Therefore,C,O,and H elements cannot be detected.Figure 5 shows the average number of different atoms for a 200 mg dust sample.

Figure 5.Element composition and content in 200 mg dust measured by ICP.
As can be seen from figure 5,B and Li are the dominant elements.Li was routinely used for wall conditioning during the operation,and thus became the main components of the dust particles.In the end of the campaign,B powder injection experiments for ELM suppression,which can result in large amount of residual B dust[19].During the SEM scanning,EDX mapping can also provide the element composition and distribution of specific dust particles.A large amount of pure B dust was also found with different shapes,as shown in figure 6.There are various shapes of B dust,which may be due to different formation mechanisms.The size of B powder is about 70 μm for B injection experiments.During the transport of B powder in plasma,the B powder can be accelerated while it is eroded and heated.When the surface temperature is above B melting point of 2076 °C,B powder can be melted,which may lead to different shapes of B dust.The dust grain with straight edges in figure 6(c)may be due to collisions of the high-speed B powder with the wall materials.For the composition of other elements,ICP measurements fairly agree with the XRF results.The number and proportion of Fe,Cr,Ni atoms show that considerable stainless steel dust exist,which are probably from the components of different diagnostic apparatus.Similar origination is for Al element.Cu can be either from heat sink materials or diagnostics.Pure Si dust was found by the EDX mapping,as shown in figure 7.They are mainly in lumpy form with about 30–80 μm in size.The Si dust may come from the silicon carbide coating on the graphite tiles in the lower divertor.Stainless steel metal dust particles with the main composition of Fe,Cr,Ni were also found,as shown in figure 8.It is around 100 μm and looks like a swarf.A similar structure was found previously in TEXTOR[3].
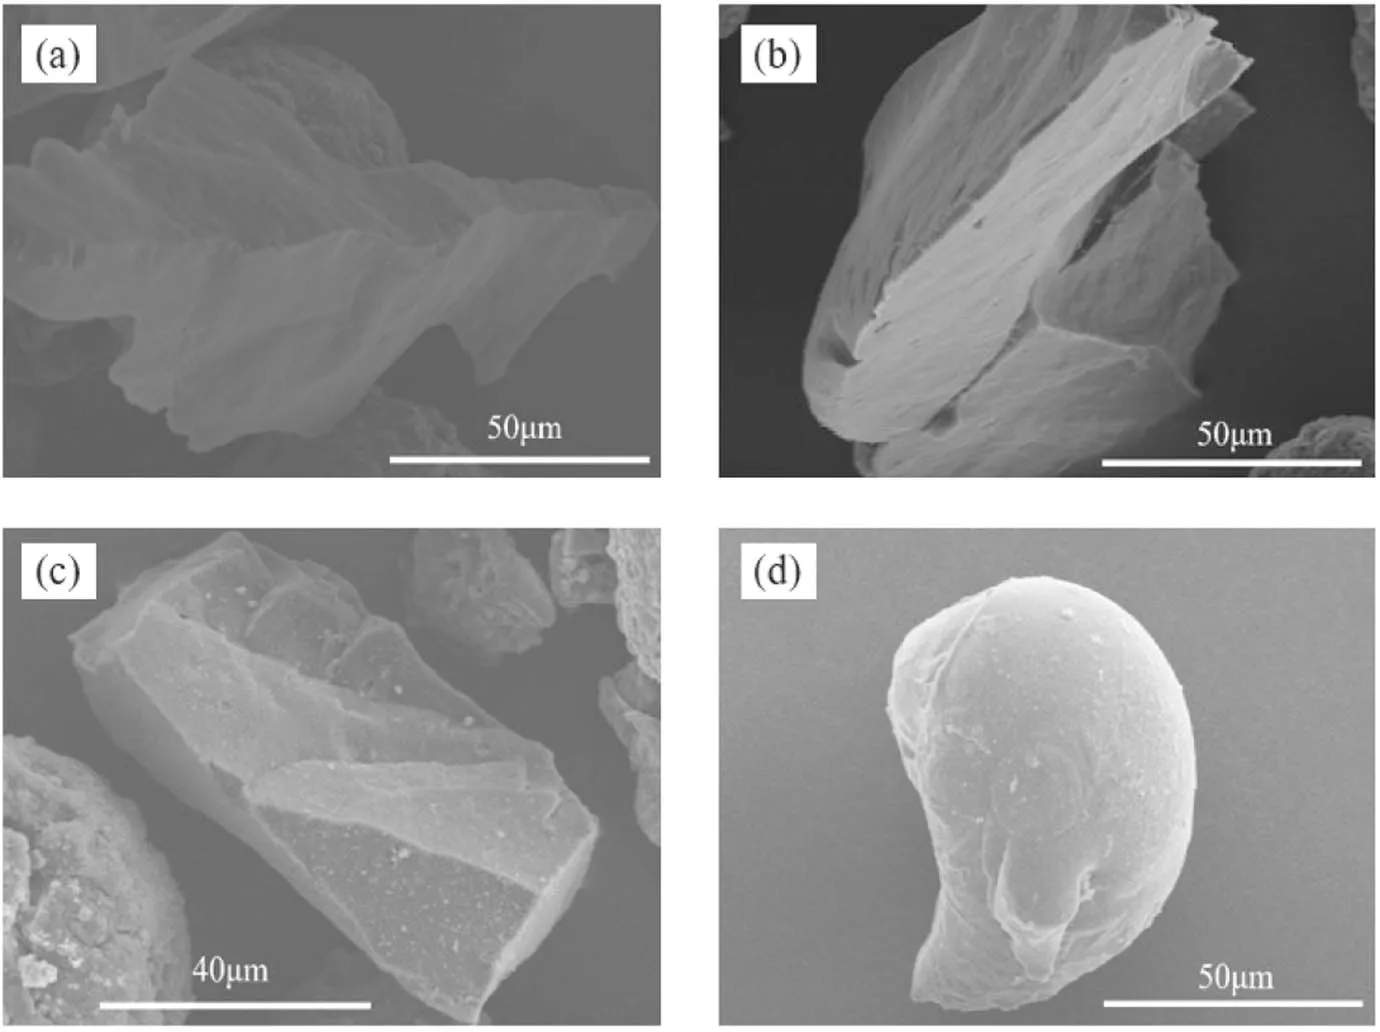
Figure 6.SEM images of different forms of B dust particles.
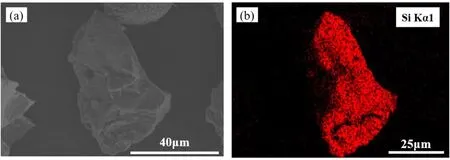
Figure 7.SEM image and EDX mapping of Si dust.(a)SEM image,(b)EDX mapping image.
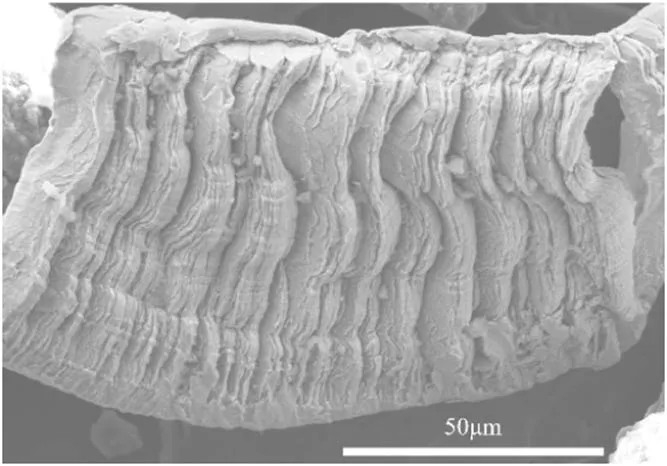
Figure 8.SEM image of stainless steel dust particle.
3.3.Li dust
According to SEM measurements,the surface of most spherical particles is relatively rough,as shown in figure 9.Some of them have cracks or pits on the surface.It can be observed that they were formed by the agglomeration of smaller particles.EDX mapping shows that only C and O elements were detected in this dust.EDX cannot detect Li and elements with atomic number lower than Li.C and O cannot form a solid substance under normal conditions.Therefore,the dust may contain elements that cannot be detected by EDX,such as Li and H.XRD measurements confirmed the presence of lithium in the dust in the form of lithium carbonate and lithium hydroxide,as shown in figure 10.Lithium dust was also found in the FTU device[5,20],and the existence form is the same as that on EAST,both in the form of lithium carbonate and lithium hydroxide.Although the Li sources in FTU is from the liquid lithium limiter,which is different from the use of Li for wall conditioning in EAST,the processes of converting pure lithium to lithium compound dust are similar in the two devices.
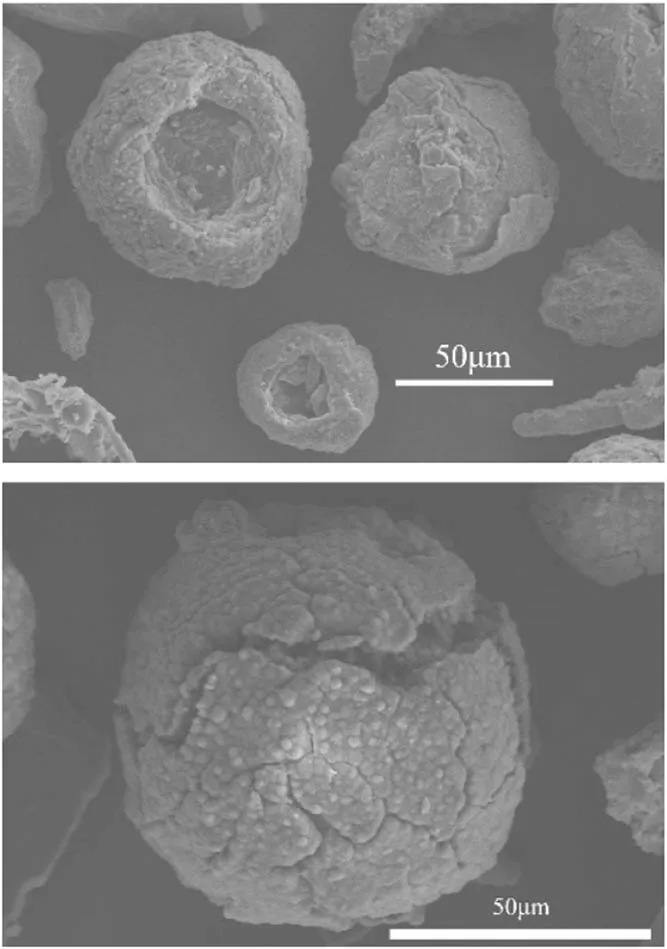
Figure 9.SEM images of dust particles with C and O elements.
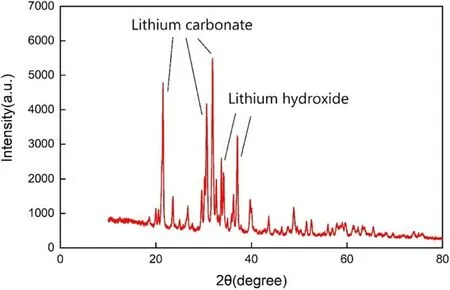
Figure 10.X-ray diffraction results from dust sample indicating lithium carbonate and lithium hydroxide.
4.Summary
Dust collection and characterization were firstly carried out after 2019 EAST experimental campaign.The morphology,size,and composition of dust particles have been analyzed.Only 18 g dust was collected and most of dust have a size in the range of 20–80 μm.Li and B are two main compositions of the dust found in EAST.The massive use of Li for wall conditioning is the main contribution to Li dust,while the B dust is from the B powder injection experiments in the end of the campaign.Various other metal elements in dust are either from the plasma-facing components or diagnostics.Most of the dust particles are in spherical shape.According to the analysis results of EDX and XRD,it can be inferred that the components of such spherical particles are lithium carbonate and lithium hydroxide.The composition of dust particles was measured by both XRF and ICP.Although both methods cannot detect some elements,they are complementary with each other.ICP measurements confirm the main contribution of Li and B.Stainless steel dust was detected not in the form of splashing droplets,but in clumps.Although severe damages to W divertor were observed,few W was found in dust.
Acknowledgments
This work was supported by National Natural Science Foundation of China(Nos.12022511,11861131010 and 12075279),the National Key Research and Development Program of China(Nos.2017YFE0301300 and 2017YFA0402500),the CASHIPS Director’s Fund(No.BJPY2019B01)and the Key Research Program of Frontier Sciences of CAS(No.ZDBS-LY-SLH010).
杂志排行
Plasma Science and Technology的其它文章
- Rice plant growth and yield:foliar application of plasma activated water
- Three-dimensional non-equilibrium modeling of a DC multi-cathode arc plasma torch
- Magnetic field induction and magnetic force distribution profiles in plasma focus discharge device
- Comparison of sample temperature effect on femtosecond and nanosecond laser-induced breakdown spectroscopy
- An active tunable Fano switch in a plasmafilled superlattice array
- Enhanced removal of ultrafine particles from kerosene combustion using a dielectric barrier discharge reactor packed with porous alumina balls
