High-pressure elastic anisotropy and superconductivity of hafnium:A first-principles calculation*
2021-05-24ChengBinZhang张成斌WeiDongLi李卫东PingZhang张平andBaoTianWang王保田
Cheng-Bin Zhang(张成斌), Wei-Dong Li(李卫东), Ping Zhang(张平), and Bao-Tian Wang(王保田)2,3,,†
1Institute of Theoretical Physics and Department of Physics,and Collaborative Innovation Center of Extreme Optics,Shanxi University,Taiyuan 030006,China
2Institute of High Energy Physics,Chinese Academy of Sciences,Beijing 100049,China
3Spallation Neutron Source Science Center,Dongguan 523803,China
4LCP,Institute of Applied Physics and Computational Mathematics,Beijing 100088,China
Keywords: first-principles,elastic anisotropy,superconductivity,hafnium
1. Introduction
Hafnium and its alloys have a narrow d-band. For these d-band materials, the d-electron orbital occupation and pressure-induced s–d electron transfer are crucial for the structural stability,electronic transitions,and superconducting properties.[1–6]Till now,phase transformation and mechanical properties of Hf have been reported in experiments[7–11]and calculations[2–4,11–15]widely. Also, the experimental results of superconducting transition temperature(Tc)upon crystallographic phases under pressure for Hf have been reported by Brshkin et al.[16]However,the theoretical investigations of its superconductivity are not sufficient.
Under ambient conditions, Hf metal crystallizes in a hexagonal close packed (hcp) structure (α phase).[9,17,18]Upon compressing,the α phase transforms into a so-called ω phase (hexagonal, space group P6/mmm).[9,11,18]Under further compression,the ω phase transforms into a body centered cubic (bcc) phase (β phase).[9,10]In previous theoretical and experimental reports,the transition pressures of α →ω (ω →β) are in range of 13.9–50 (30.7–73.1) GPa.[3,9–11,14,15,18]Structure changes will inevitably lead to performance changes.For example,the experimental results have confirmed that Hf metal exhibits the superconducting properties,[7,16,19–21]and the values of Tcare directly associated with their pressureinduced phase transitions. Under normal conditions, for α phase, the value of Tcis 0.128 K.[7,19,20]The effects of pressure on Tcare positive for α and ω phases,which results in an increase of Tcunder compression.[16,21–23]The values of Tcare increasing until the ω phase transforms to the β phase.[16]This high-pressure superconductivity behavior has not been theoretically studied in literature.
In our previous studies, the pressure-dependent behaviors, such as phase transition, elastic constants, elastic moduli,phonon spectra,and thermodynamic properties,have been systematically investigated for Hf.[3]In the present work, we would like to extend our study to investigate these behaviors of elastic anisotropy and superconductivity under pressure.
2. Computational methods
2.1. Computational details
The pseudopotential plane-wave method[24]is used to calculate the electronic properties, lattice dynamics, and electron–phonon coupling (EPC) within the Perdew–Burke–Ernzerhof(PBE)generalized gradient approximation(GGA)[25]through the QUANTUM-ESPRESSO(QE)package.[26]The 5s25p65d26s2electrons are treated as valence electrons. A kinetic energy cutoff of 100 Ry is used for all three phases, as well as Gaussians width of 0.02 Ry. The kpoint meshes of 24×24×16, 16×16×24, and 32×32×32 are employed for α, ω, and β phases, respectively. The phonon spectra and phonon density of states (PhDOS) are computed using the density-functional perturbation theory (DFPT)[27]with 6×6×4, 4×4×6, and 8×8×8 q-point meshes for α, ω,and β phases,respectively.
2.2. Superconductivity
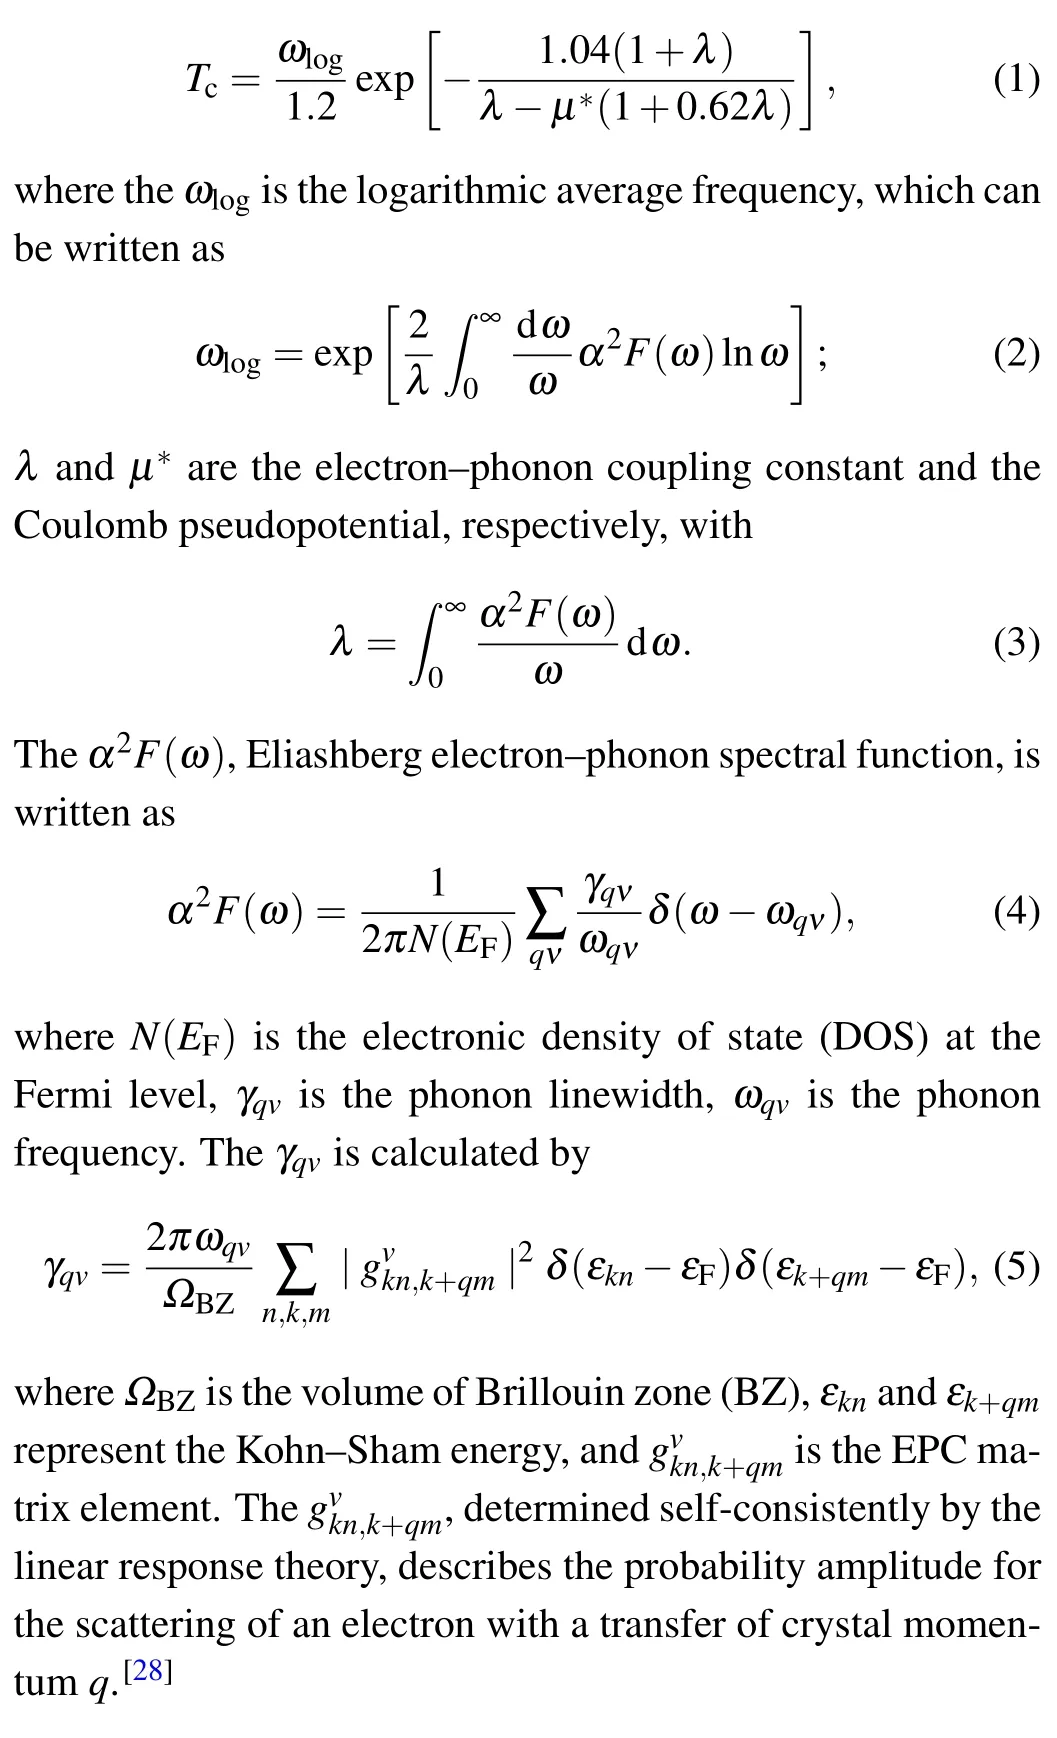
The superconducting transition temperature Tccan be obtained from the Allen–Dynes modified McMillan equation[28,29]
3. Results and discussion
3.1. Anisotropy of elastic moduli
In our previous investigation,[3]Hf metal crystallizes in α phase under ambient conditions. The transition pressure of α →ω (ω →β)is 44.8(73.1)GPa, which is in good agreement with the experimental result of 38±8 (72±1) GPa reported by Xia et al.[9]The crystal structures for α, ω, and β phases are shown in Figs.1(a)–1(c), as well as the indices of crystal direction and plane for hexagonal and cubic structures in Figs. 1(d) and 1(e). The pressure-dependent behaviors of the elastic constants and elastic moduli for Hf element have been systematically reported, as well as the detailed data of elastic constants, which can be found in Ref. [3]. Based on the calculated elastic constants,we extend our study to investigate the behavior of elastic anisotropy. Many low symmetry crystals exhibit a high degree of elastic anisotropy, which is closely related to the possibility of inducing micro-cracks in materials. The elastic anisotropy can be described by the universal anisotropic index AU[30]and the percent anisotropy in compression and shear(Acompand Ashear).[31,32]AU,Acomp,and Ashearfor a crystal are given as follows:
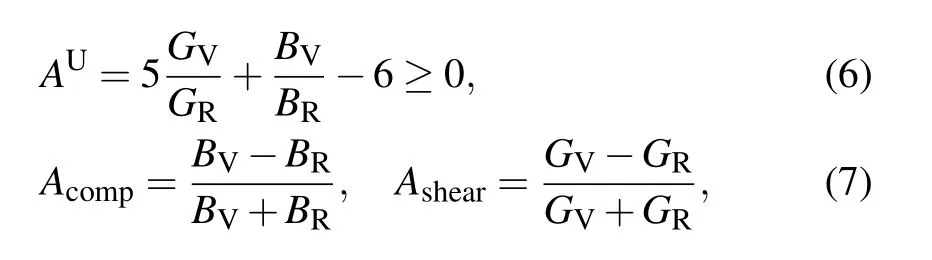
where BV(GV)and BR(GR)are the bulk modulus(shear modulus) in the Voigt–Reuss–Hill (VRH) approximations,[33–35]respectively. Please see the detailed computation scheme of the BV, BR, GV, and GRin Ref. [6]for the hexagonal crystal and in Ref.[37]for cubic structure. When a solid is isotropic,AU=0. The large deviation of AUfrom 0 indicates the large extent of single crystal anisotropy. Thus,AUrepresents a universal measure to quantify the elastic anisotropy.[30]The values of Acompand Ashearcan range from 0 to 1, where 0 (1)represents the isotropic(the maximum elastic anisotropy).[38]Additionally, the shear anisotropic factors A1, A2, and A3are also considered to describe the elastic anisotropy due to our investigated crystal systems including hexagonal and cubic crystal structures. A1,A2,and A3are defined as[32]

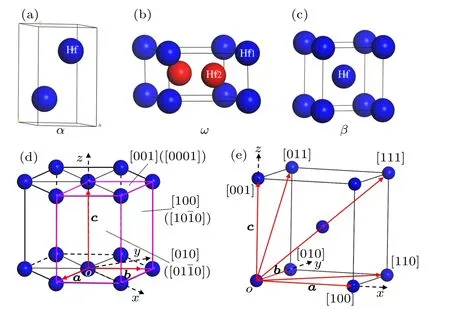
Fig.1. Crystal structures of(a)α-Hf, (b)ω-Hf, and(c)β-Hf, as well as the indices of crystal direction and plane for (d) hexagonal and (e)cubic structures.
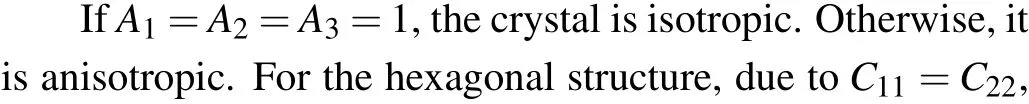

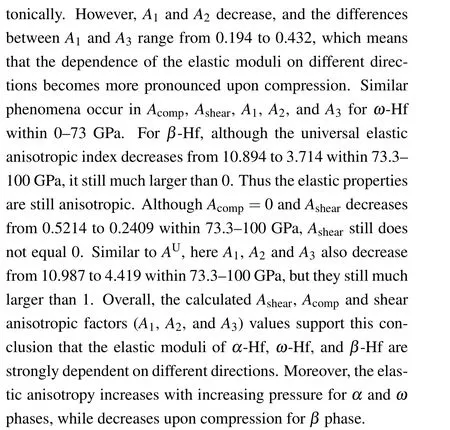
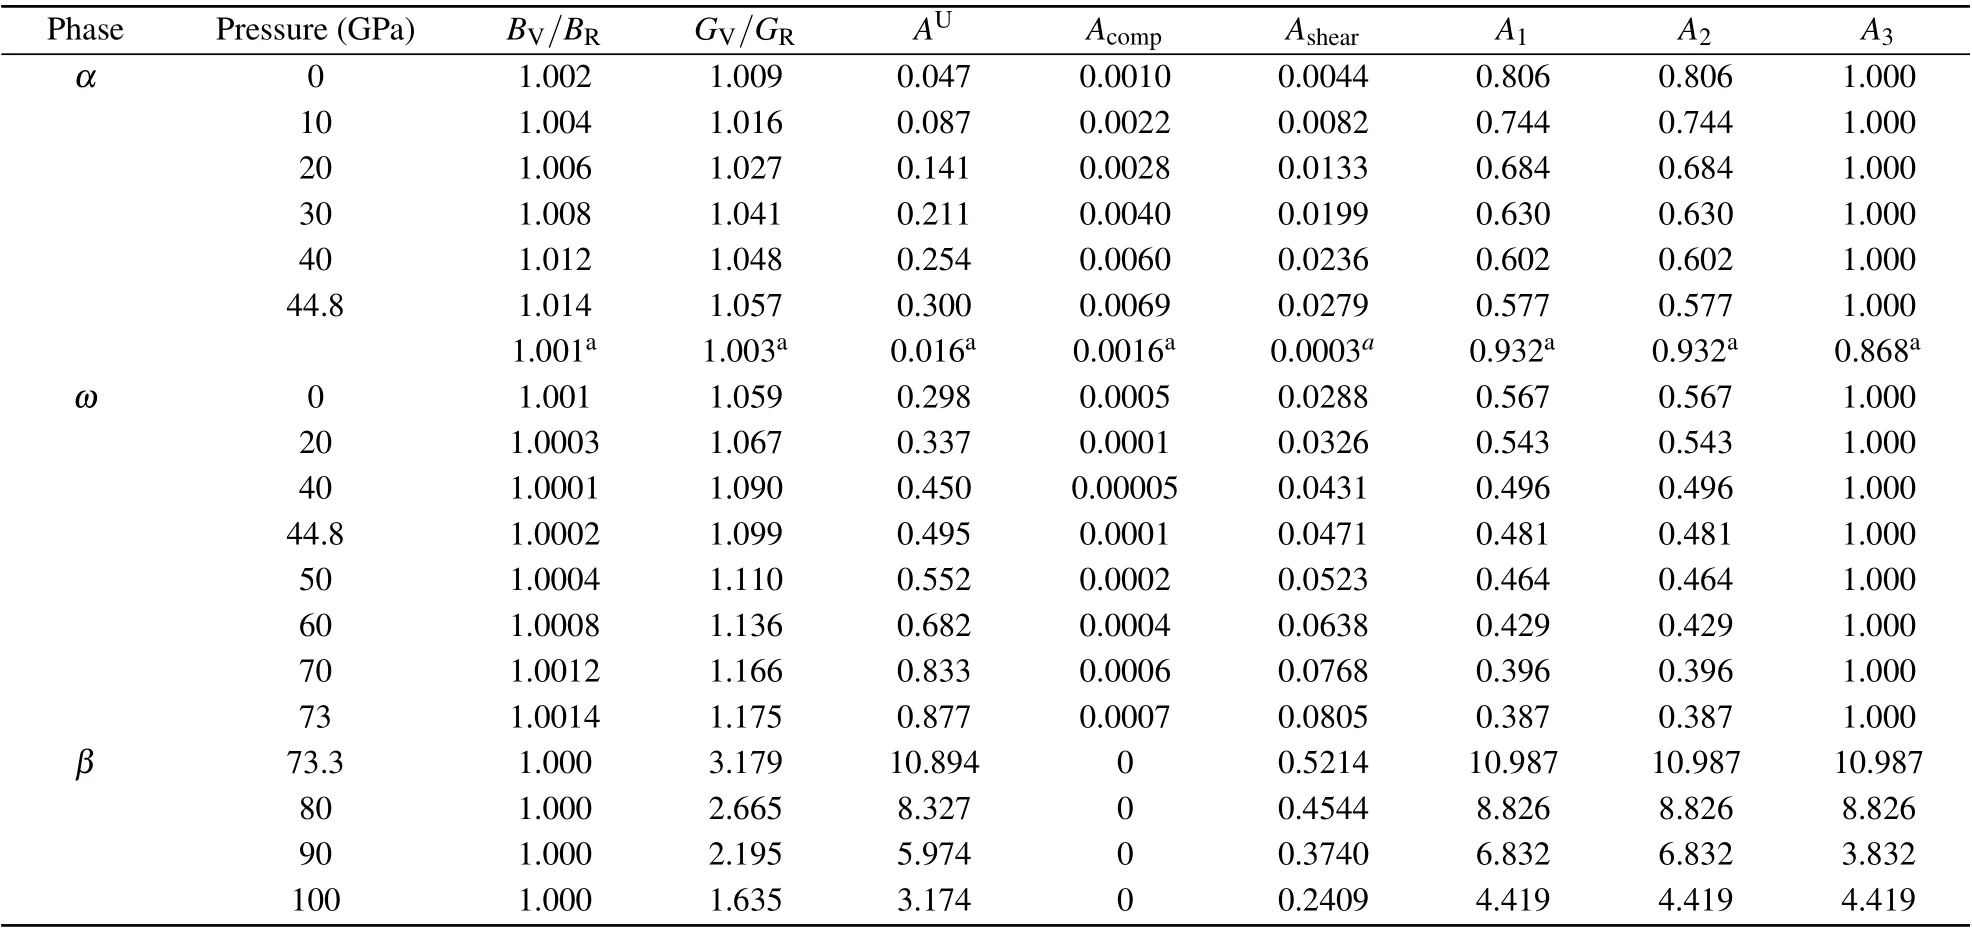
Table 1. The calculated ratio of bulk modulus (BV/BR) and shear modulus (GV/GR), universal anisotropic index (AU), percent anisotropy(Acomp and Ashear),and shear anisotropic factors(A1,A2,and A2)of Hf.
As a valid method to describe the elastic anisotropic behavior of a solid completely, the three-dimensional (3D) surface constructions of the directional dependence of reciprocal of Young’s modulus are also investigated by the following expressions:[40]
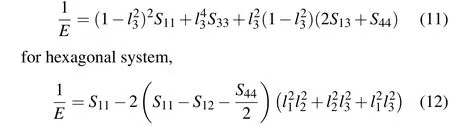
for cubic system,where Sijis the usual elastic compliance constant,which is obtained from the inverse of the matrix of elastic constants;l1,l2,and l3are the direction cosines.The results of Young’s modulus for α,ω,and β phases are shown in panels(a)and(c)of Figs.2–4,as well as the corresponding shear modulus in panels(b)and(d)of Figs.2–4.The surface in each of graphs means the magnitude of E and G in different directions. For an isotropic system, the 3D surface construction is a spherical shape. The values of anisotropy coefficient are reflected by the deviation degree from the spherical shape.In addition,we calculate Young’s modulus in the three principal directions by E[100]=1/S11,E[010]=1/S22,and E[001]=1/S33.
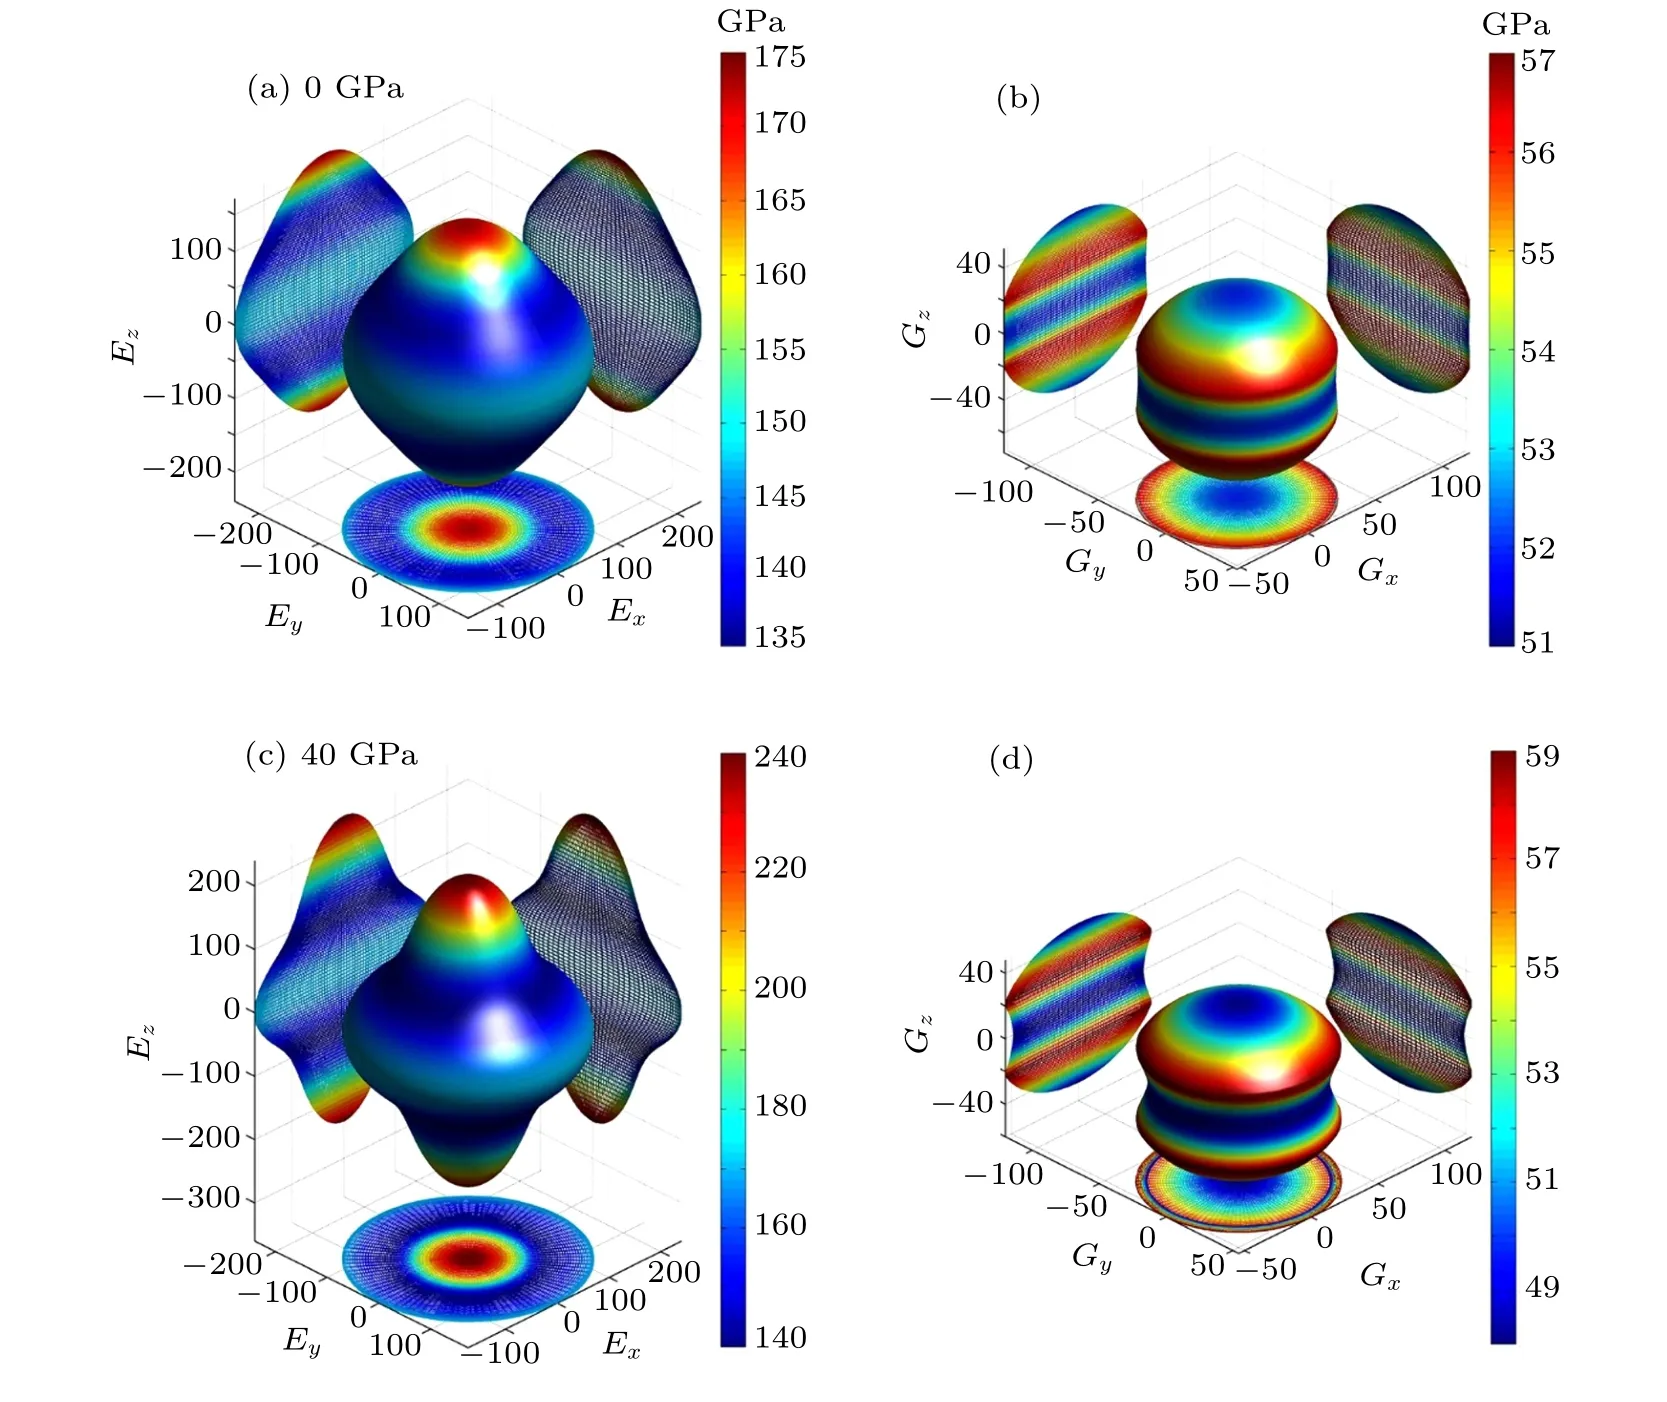
Fig.2. Directional dependences of Young’s modulus for α-Hf under(a)0 GPa and(c)40 GPa with the corresponding shear modulus in(b)and(d).

Fig.3. Directional dependences of Young’s modulus for ω-Hf under(a)0 GPa and(c)60 GPa with the corresponding shear modulus in(b)and(d).

Fig.4. Directional dependences of Young’s modulus for β-Hf under(a)73 GPa and(c)100 GPa with the corresponding shear modulus in(b)and(d).
For the hexagonal α and ω phases,a large deviation in 3D surface constructions from the sphere indicates that Young’s modulus E and shear modulus G show a strong anisotropy(see Figs.2 and 3). Under compression,Young’s modulus and shear modulus have the increasing deviation in shape from the sphere. It is suggested that Young’s modulus and shear modulus show a increasing elastic anisotropy. For α phase,E[100]is equal to E[010]=185.18 GPa <E[001]=208.33 GPa at 0 GPa.E[100]is equal to E[010]=263.16 GPa <E[001]=333.33 GPa at 40 GPa. These indicate that Young’s modulus along [100]or[010]direction are more compressible than along[001]direction for α-Hf. Similarly, for ω phase, E[100]is equal to E[010]=163.93 GPa <E[001]=212.77 GPa(E[100]is equal to E[010]=294.12 GPa <E[001]=333.33 GPa) at 0 (60) GPa.For β phase,Young’s modulus in three principal-axial(E[100],E[010], and E[001]) directions are 263.16 (333.33) GPa at 73(100) GPa. Meanwhile, Young’s modulus in [110] and [111]directions by using the expressions introduced in the recent report[41]are 300.75(370.37)GPa and 500(555.56)GPa at 73(100)GPa.Therefore,one can conclude that Young’s modulus has a strong directional dependence. The difference values in the directional Young’s modulus between[111]and the principal axes direction are 199.25 GPa and 185.19 GPa for 73 GPa and 100 GPa,respectively,which indicates that Young’s modulus shows an anisotropic property and the anisotropy decreases upon compression. Although the difference values are on the decrease along with the pressure increasing from 73 to 100 GPa,Young’s modulus still shows a strong anisotropic property[see Figs.4(a)and 4(c)]. As shown in Figs.4(b)and 4(d),the largest value locates on the[100]direction while the smallest value exists on the[110]direction for shear modulus.According to these results, one can conclude that the β-Hf is much easier to stretch along the [100] direction than other directions and also easy to shear along the [110] direction.The results of 3D surface constructions also show that elastic anisotropies increase with increasing pressure for α and ω phases, while decrease upon compression for β phase. This result also supports our conclusion from the analysis of the universal elastic anisotropy indexes.
3.2. Superconductive properties
Hafnium has excellent performance for high-temperature superconductivity, especially the high-pressure β phase.[16]Now, we focus our attention on structures of the electronic,vibration modes,and the EPC in pressure range of 0–100 GPa to analyze the effect of pressure on superconductivity. The orbital-resolved band structures and the electronic DOS curves of α,ω,and β phases are plotted in Figs.5–7.
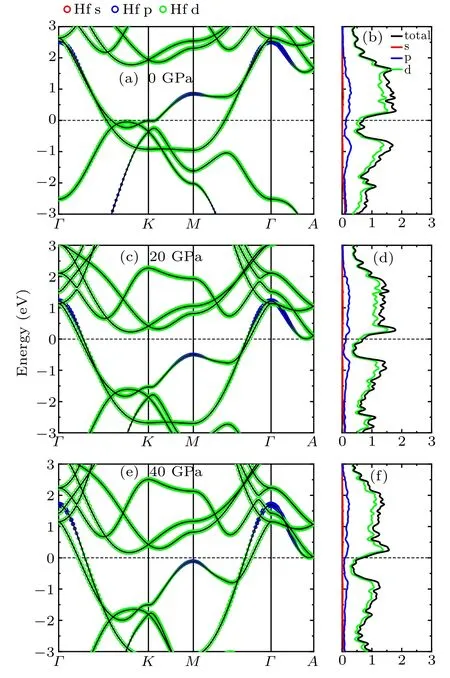
Fig. 5. Orbital-resolved band structures for α-Hf under (a) 0, (c) 20,and (e) 40 GPa, respectively, with the total and orbital-resolved local electron DOS in(b),(d),and(f).
Comparing the results at different pressures,one can see that the contribution of the bands around the Fermi energy level mainly comes from the Hf-d orbital, while the contribution from the p orbital is limited and from the s orbital is hardly seen. As the DOS curves shown in Fig. 5, for α phase, the values of total N(EF) are 0.715 states/(eV atom),0.701 states/(eV atom), and 0.688 states/(eV atom) at 0 GPa,20 GPa, and 40 GPa, respectively. The values of total N(EF)are decreasing with increasing pressure from 0 to 40 GPa.In addition, at 0 GPa, there is a peak (near 0.31 eV) and a valley (near −0.10 eV) lying in two sides of the Fermi energy level, respectively. Upon compressing, both of them are shifted downwards in energy level. For ω phase(see Fig.6),there exist two different kinds of atoms: Hf1 in 1a and Hf2 in 2d sites. The N(EF) values of Hf1-d (Hf2-d) electrons are 0.500 (0.626) states/(eV atom), 0.544 (0.611) states/(eV atom),and 0.547(0.570)states/(eV atom)at 45 GPa,60 GPa,and 70 GPa,respectively. Along with increasing the pressure from 45 to 70 GPa, the occupied of Hf1-d electron will approach to Hf2-d electron occupation at the Fermi level. Although the d-electron occupation of Hf1 and Hf2 has an opposite evolution upon compressing around the Fermi level,the total N(EF)still increases within 45–70 GPa.

Fig. 6. Orbital-resolved band structures for ω-Hf under (a) 0, (c) 40,and (e) 60 GPa, respectively, with the total and orbital-resolved local electron DOS in(b),(d),and(f).

Fig. 7. Orbital-resolved band structures for β-Hf under (a) 70, (c) 80,and(e)100 GPa, respectively, with the total and orbital-resolved local electron DOS in(b),(d),and(f).
Moreover, there also have a peak (near 0.21 eV) and a valley (near −0.07 eV) at the conduction band and valence band, respectively, and both of them are shifted downwards in energy level upon compression. For β phase (see Fig. 7),different from the α and ω phases,although the peak and the valley also lie at nearly 0.24 eV and −0.18 eV, respectively,both of them are shifted upwards in energy level with pressure increasing. From 75 GPa to 100 GPa,the total N(EF)presents a trend of decrease from 1.436 to 1.097 states/(eV atom).
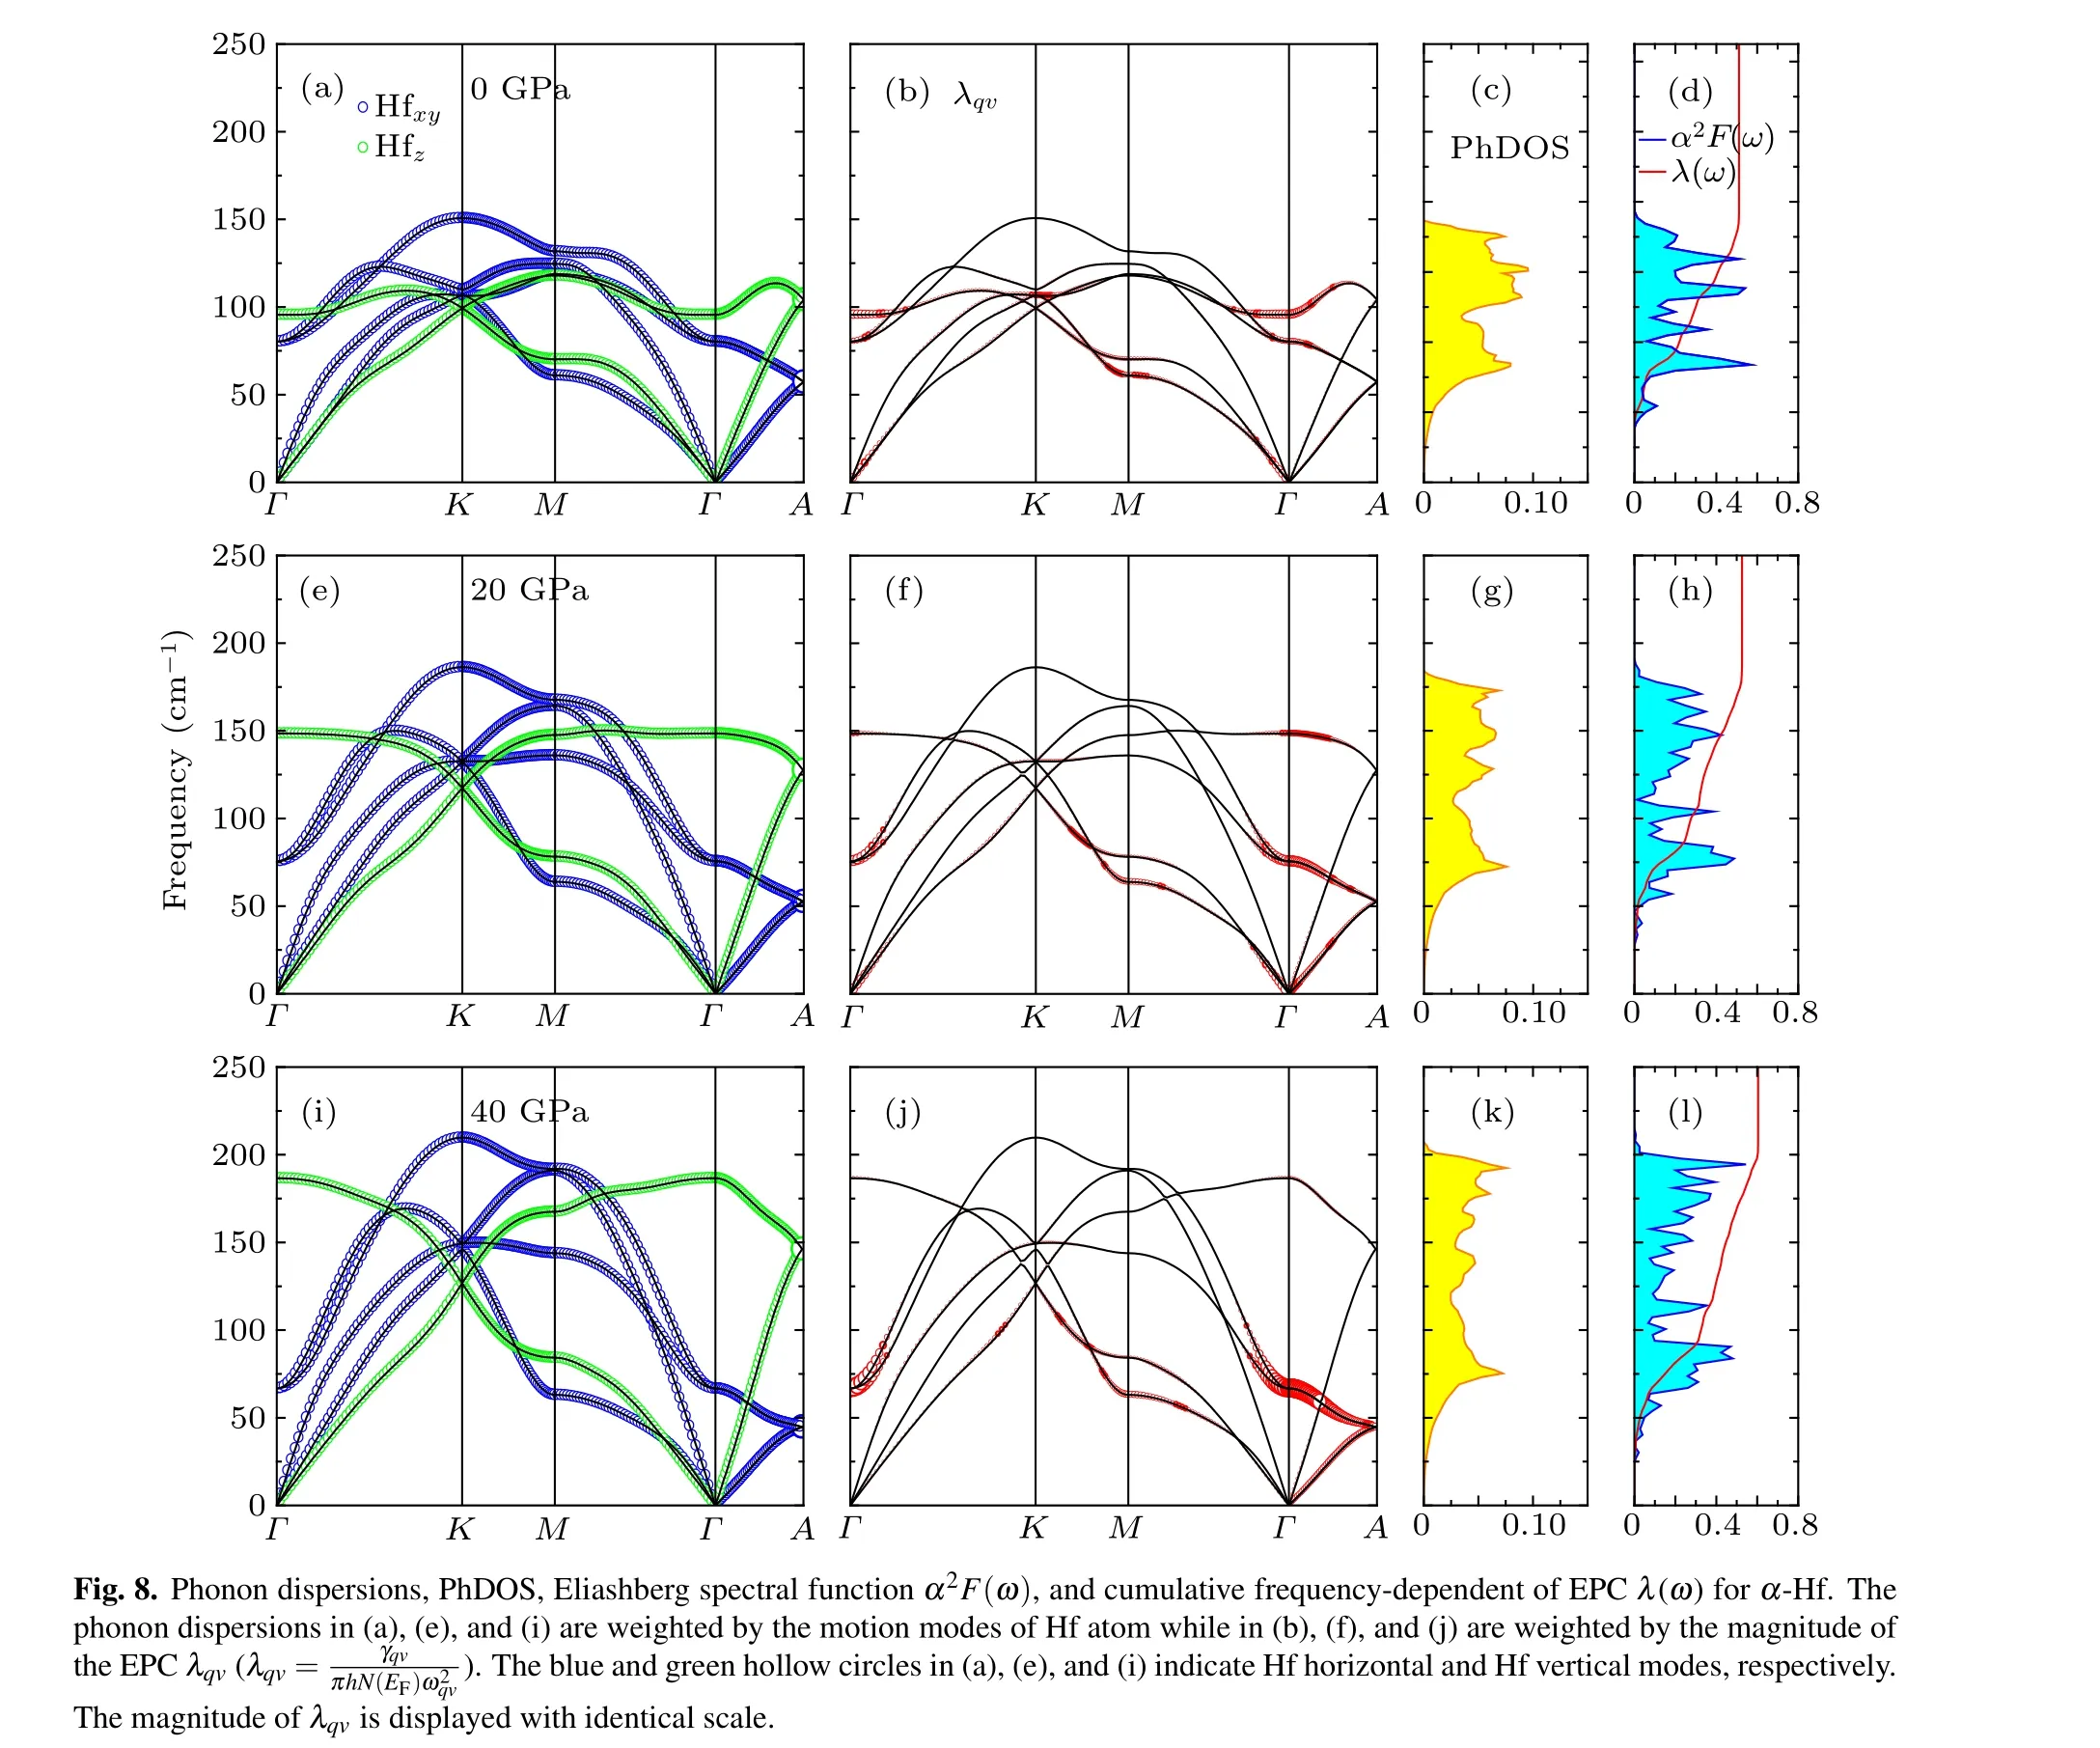
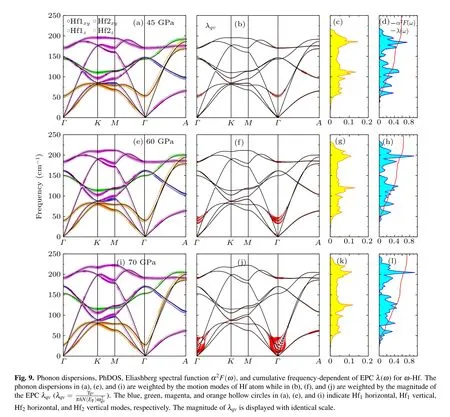
Next, we want to discuss the vibrational properties, the EPC, and the PhDOS of Hf metal, as well as the Eliashberg spectral function α2F(ω). The results are plotted in Fig.8 for α phase at 0 GPa, 20 GPa, and 40 GPa, Fig. 9 for ω phase at 45 GPa, 60 GPa, and 70 GPa, and Fig. 10 for β phase at 75 GPa,80 GPa,and 100 GPa,respectively. In fact,no imaginary modes are observed, which clearly indicates that α, ω and β phases are dynamically stable at given pressure domain.In addition,one can see that pressure will enhance the phonon energies. These results turn out to be the same as our recent result.[3]The phonon vibrations can be divided into two forms:in-plane vibrations Hfxyand out-of-plane vibrations Hfz. For α and β phases, the Hfxyand Hfzphonon vibrations are visible in the full BZ.Different from the α and β phases, for ω phase,the in-plane vibrations(Hf1xyand Hf2xy)are visible in the full BZ while the out-of-plane vibrations of the Hf1z(Hf2z)occupy the frequencies region above(below)100 cm−1.
We also calculate the phonon dispersions weighted by the magnitude of the EPC λqv, the PhDOS, the Eliashberg electron-phonon spectral function α2F(ω), and the cumulative frequency-dependent of EPC λ(ω) and plot them in Figs.8–10 for α,ω,and β phases,respectively. The λqv,here,according to the Migdal–Eliashberg theroy,[42]can be written as

The cumulative frequency dependence of EPC λ(ω) and the α2F(ω) can be obtained from Eqs. (3) and (4), respectively.For α-Hf (see Fig. 8), at 0 GPa, according to our calculated λ(ω),one can see that the total EPC λ is equal to 0.511,and the vibrations, in the frequency below ~76 cm−1, contribute 0.205 (40.1%). The phonons, in the frequency region of 76–112 cm−1,contribute 0.170(33.3%)of the total EPC,and the remaining 0.136 (26.6%) contribution comes from phonons in frequencies above 112 cm−1. Increasing the pressure to 40 GPa, the total EPC λ increases to 0.605, and almost half the λ comes from the contribution of phonons in frequencies below ~93 cm−1. In the frequency region 0–93 cm−1, the large values of the λqvhere lead to the large EPC strength,which has resulted in a peak of the PhDOS and the α2F(ω).As shown in Fig. 9, for ω phase, at 45 GPa, the total EPC λ =0.582. In frequencies below ~65 cm−1, the λ accounts for 15.3%(0.089)of the total EPC,and the large values of the EPC strength λqvhere result in a peak on the α2F(ω). Most of the total λ, about 75.0%, come from the contribution of phonons in frequency region of 65–187 cm−1. At 70 GPa,the total EPC λ increases to 0.727,and the phonons’contribution in frequencies below ~65 cm−1increases to 21.2%(0.154)of the total EPC. However, the contribution of phonons, in the frequency region of 65–187 cm−1, decreases to 59.9%. For β phase (see Fig. 10), at 75 GPa, the total EPC λ =1.624.The phonons,in frequency region of 0–45(45–70)cm−1,contribute 30.0% (15.0%) of the total λ. Obviously, the large values of λqvalong the Γ–A direction in the frequency range 0–50 cm−1are mainly due to the lowest transverse-acoustics(TA1)soft mode,which results in a peak on the α2F(ω). Increasing the pressure to 100 GPa, the total EPC λ decreases to 0.941. In addition, the soft mode of the TA1 branch will gradually fade away by increasing pressure, which results in the decrease of λ. Similar results can be found in our previous work of β Zr.[43]

The superconducting transition temperatures Tchave been calculated from Eq.(1)with a typical value µ*=0.1 is used,and plotted in Fig.11 for these there phases. Clearly,the different phenomena are observed in the pressure dependence.The pressure coefficient of the Tcin the α and ω phases is a positive value,while the β-Hf shows a negative pressure coefficient. In addition, although our predicted values of Tcare larger than the experimental values, the pressure-dependent behaviors accord well with the experimental results.[16]According to the McMilan equation [Eq. (1)], one can see that the Tcis determined by ωlog, λ, and N(EF). Thus, we have calculated the ωlogand the λ in the pressure range 0–100 GPa and plotted them in Fig. 12. The results show that the values of the λ for α and ω phases increase with the increasing pressure, as well as the values of the ωlogfor α phase.However, the ωlogchange is not evident under compression for ω phase. In our previous discussion, the total N(EF) of α phase decreases with pressure. These results support this conclusion that the increase of Tcfor α phase under pressure mainly originates from the increase of λ and ωlog, as well as the decrease of N(EF) by increasing pressure. For ω phase,although the total N(EF) of α phase increases with pressure,the N(EF) of Hf2 decreases with pressure. Moreover, Fig. 9 shows that the Hf2 phonons’vibrations contribute most of the total λ. Therefore,one can conclude that the increase of Tcfor ω phase mainly originates from the increase of λ. However,for β phase,almost opposite evolutions appear on ωlogand λ curves in the pressure range 75–100 GPa. The increasing rate of ωlogis smaller than the decreasing rate of λ. Thus the decrease of Tcfor β phase mainly originates from the decrease of λ in 75–100 GPa pressure domain. In addition,the lowest TA1 soft mode for β phase can lead a significant electronphonon contribution, which has been discussed in the above paragraph.With the increasing pressure,soft vibrational mode gradually fades away. Thus,the decrease of Tcunder pressure mainly originates from the fading of soft vibrational modes induced by increasing pressure. Actually, for Zr metal, similar pressure-dependent behaviors are also observed in Tc, which has been reported in experiments by Akahama et al.[44]and calculations by Wang et al.[43]Akahama et al. believe that the effect of pressure on the Tchas relation with the s–d electronic transformation. For transition metals, the dTc/dP is governed by the shape of the d-band, expressed by the quantity dN(EF)/dZd.[45]Zdis valence electron numbers. Compression affects the Tcin the same way as filling the d-band by adding atoms of higher valency.[44]As a same group element,the s–d transition is also a feature of Hf under pressure.Therefore,we surmise that the effect of pressure on the Tcalso has relation with the s–d electronic transformation for Hf metal.Future investigations are needed to verify our speculation.
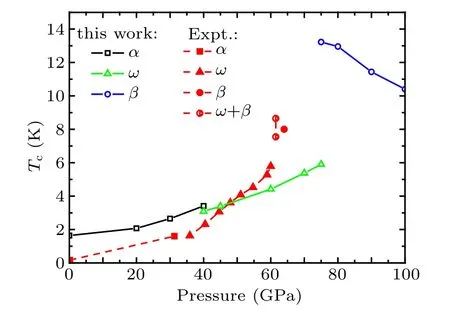
Fig.11. Calculated superconducting transition temperature Tc versus pressure for α,ω,and β phases. The experimental values of Tc from Ref.[16]are also presented.The half right circle is an indication of a two-phase ω+β state of the sample under these conditions.[16]
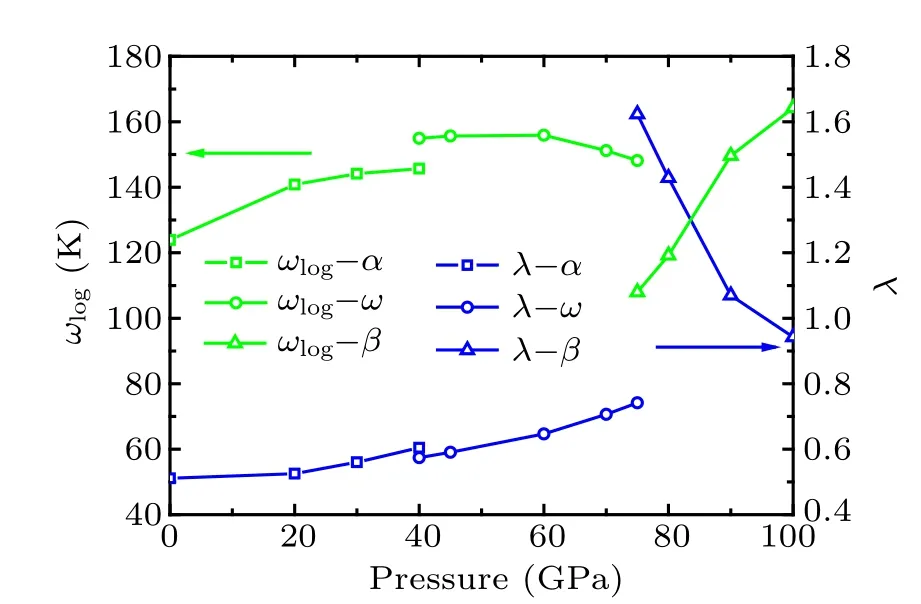
Fig.12. Pressure dependences of logarithmic average of the vibrational frequencies ωlog and EPC constants λ.
4. Conclusion
In summary, the first-principles calculations are employed to investigate the elastic anisotropy and superconductive properties of hafnium metal. Hafnium is an elastic anisotropic crystal. Its elastic moduli are strongly dependent on different directions. From the anisotropic parameters and the 3D surface constructions of the E and G,one can conclude that the elastic anisotropy increases with increasing pressure for α and ω phases, while decreases under compression for β phase. In addition, our calculated Tcagrees well with experiments. Upon compression, the increase (decrease) of Tcmainly originates from the corresponding increase(decrease)behavior of the EPC constant λ.
Acknowledgment
The calculations were performed at Supercomputer Center in China Spallation Neutron Source.
Appendix A: Convergence test of electron–phonon coupling constant
It is difficult to obtain convergent λ, directly. In practical EPC matrix element calculation, the δ function can be replaced by the smearing function with a broadening width σ.[46]We are interested in the limit that σ →0 and the number of k points →∞. In order to obtain convergent EPC constant λ,we have extensively tested the number of k and q points for α-Hf at 0 GPa. These results are shown in Fig.A1. As shown in Fig.A1,for α-Hf at 0 GPa,with increasing the number of k or q points, the values of λ decrease. When the k and q points increase to a certain extent,the differences of λ values are small,meanwhile there is an emergence of a small separation near σ =0.02 eV in the overlapping results. According to the results,we can say that the calculated EPC constant λ is convergent for a k-point,e.g.,24×24×16,and a q-point,e.g.,6×6×4. In addition,the corresponding σ is 0.02 eV.

Fig.A1. Convergence test of EPC constant versus smearing parameter σ in α-Hf at 0 GPa with different k and q points.
猜你喜欢
杂志排行

Chinese Physics B的其它文章
- Corrosion behavior of high-level waste container materials Ti and Ti–Pd alloy under long-term gamma irradiation in Beishan groundwater*
- Degradation of β-Ga2O3 Schottky barrier diode under swift heavy ion irradiation*
- Influence of temperature and alloying elements on the threshold displacement energies in concentrated Ni–Fe–Cr alloys*
- Cathodic shift of onset potential on TiO2 nanorod arrays with significantly enhanced visible light photoactivity via nitrogen/cobalt co-implantation*
- Review on ionization and quenching mechanisms of Trichel pulse*
- Thermally induced band hybridization in bilayer-bilayer MoS2/WS2 heterostructure∗