Determining nitrogen status and quantifying nitrogen fertilizer requirement using a critical nitrogen dilution curve for hybrid indica rice under mechanical pot-seedling transplanting pattern
2021-05-23YAOBoHEHaibingXUHaocongZHUTiezhongLIUTaoKEJianYOUCuicuiZHUDequanWULiquan
YAO Bo,HE Hai-bing,XU Hao-cong,ZHU Tie-zhong,LIU Tao,KE Jian,YOU Cui-cui,ZHU Dequan,WU Li-quan,
1 College of Agronomy,Anhui Agricultural University,Hefei 230000,P.R.China
2 Jiangsu Collaborative Innovation Center for Modern Crop Production,Nanjing 210095,P.R.China
Abstract Field experiments of nitrogen (N) treatment at five different application rates (0,75,150,225,and 300 kg ha-1) were conducted under pot-seedling mechanical transplanting (PMT) in 2018 and 2019. Two high-quality and high-yielding hybrids of indica rice,Huiliangyou 898 and Y Liangyou 900,were used in this study. The N nutrition index (NNI) and accumulated N deficit (Nand ),used to assess the N nutrition status in real-time,were calculated for the indica cultivars under PMT with a critical nitrogen concentration (Nc ) dilution model based on shoot dry matter (DM) during the whole rice growth stage. The relationships between NNI and Nand with relative yield (RY) were determined,and accurate N application schemes were developed for hybrids indica rice under PMT. The results indicated that high application rate of N-fertilizer significantly increased the concentrations of shoot DM and N in aboveground organs during the observed stages in the two cultivars for two years (P<0.05). The Nc dilution model of hybrid indica cultivars was Nc =4.02DM-0.42 (R2=0.97) combining the two cultivars under PMT. Root-mean-square error and normalized root-mean-square error of the curve verification were 0.23 and 10.61%,respectively. The NNI and Nand ranged from 0.58 to 1.31 and 109 to–55 kg ha-1,respectively,in the two cultivars for all N treatments. NNI showed a linear relationship with Nand during the entire growth stage (0.53<R2<0.99,P<0.01). In addition,NNI showed a linear-plateau relationship with RY (0.73<R2<0.92,P<0.01) throughout the observed stages. These results suggest that the models can accurately diagnose the N-nutrition status and support effective N-fertilizer management in real-time for hybrid indica rice under PMT.
Keywords:rice,yield,critical nitrogen concentration,nitrogen nutrient index
1.Introduction
Rice (Oryza sativaL.) is the most important staple food in China. The high grain yield of rice plants is still considered as one of the major targets to feed the growing population in China (Van Nguyen and Ferrero 2006). Hybridindicarice is widely cultivated in the middle and lower reaches of the Yangtze River,China. Continuous urbanization has markedly decreased the labor force in agricultural areas in China;this threatens rice production and food security (Shaviv and Mikkelsen 1993). There are large areas of abandoned farmlands,and agricultural production and planting systems are undergoing great challenges. Therefore,farmers are increasingly adopting large-scale mechanized cultivation because it enables the production of high grain yield with low labor inputs. Pot-seedling mechanical transplanting (PMT)is considered as a new mechanical planting method for rice plants (Zhanget al.2013). It has better productivity and greater economic benefits compared with traditional blanket machine transplanting (TMT). It is hoped that PMT can be a more effective cultivation practice for rice production in the future (Huet al.2014;Heet al.2018).
Nitrogen (N) is one of the most important factors affecting rice yield. Nitrogen is over-applied to the paddy fields in some of the main rice production regions in China,including theindicarice-growing area in the middle and lower reaches of the Yangtze River. The nationwide average N-surplus in paddy soils has reached 82 kg ha-1(Chenet al.2014). Excessive N application markedly decreases N use efficiency (Nyiranezaet al.2009),seriously pollutes farmland,and is not sustainable. However,decreasing N input rates too much,particularly in large-scale mechanized rice cultivation,would preclude high yields and risk food shortages (Zhuet al.2016). Therefore,the development of precision N management strategies can improve rice yield and N use efficiency (Miaoet al.2008),especially in PMT. However,little is known about accurate N-fertilizer management regimes for hybridindicarice under PMT.
Studies based on large numbers of field experiments demonstrate that the critical N concentration decreases with increasing crop shoot dry matter (DM) in an allometric function (this function curve was called the critical N dilution curve) (Greenwoodet al.1990;Justeset al.1994). The critical N concentration (Nc) is defined as the minimum N concentration at which the maximum shoot dry matter (DM)is attained (Ulrich 1952). TheNcdilution curve (Nc=aDM-b)can be used to describe the response of the N concentration to changes in the shoot DM (t ha-1). The N nutrition index(NNI) and accumulated N deficit (Nand),which assess N abundance and N deficiency in a crop,can be calculated using theNcdilution curve for crops (Ata-Ul-Karimet al.2013),and can then be used for determining N nutrition status of the plant. This concept has been successfully used for in-season estimation of N requirement,grain yield and setting yield targets according to different N application rates in rice ecotypes (Ata-Ul-Karimet al.2016). Therefore,accurate N-fertilizer management regimes using theNccurve could be a critical technology for high yield and high N use efficiency in crops.
A universal curve for C3and C4crops has been constructed using data from many experiments. The curve was corrected and improved through field trials (Lemaireet al.1990). However,the general curve had some clear shortcomings,including having been developed using test sites insufficiently representative of various situations and using limited test species;so the general curve could not be applied to all crops under different ecological and cultivation conditions. Therefore,theNcdilution curve equations were developed for wheat (Justeset al.1994),rape (Colnenneet al.1998),potato (Giletto and Echeverría 2012),cotton(Xueet al.2006),and maize (Plénet and Lemaire 1999). For rice plants,Nccurves have been developed using theindicarice varieties in tropical regions (Sheehyet al.1998) and in southern double-season rice regions of Jiangxi Province,China (Heet al.2017). Meanwhile,Nccurves forjaponicarice have been built near the Yangtze River (Ata-Ul-Karimet al.2013) and in the Northeast China Plain (Huanget al.2018). These curves can be used to accurately diagnose the N nutrition status and determine an optimal N-fertilizer management scheme for the special regions. However,there are large differences among these curves built for different regions,rice subspecies,or even for the sameindicasubspecies. For instance,the published curve parameters ‘a’and ‘b’ for rice crops have been found to range from 2.77 to 5.18 and from 0.25 to 0.52. These large ranges indicate that theNccurve could be significantly affected by specific plant genotypes and local climates (Ata-Ul-Karimet al.2013). For modern high-yield rice varieties,the response to and demand for N nutrition may change markedly because of continual changes in the source and sink capacities when compared with older varieties (Wuet al.2007). Moreover,the nitrogen content,uptake capacity and apparent translocation rate were higher under PMT than under TMT (Huet al.2018a).Cultivation practices may also affect the curve parameters(Heet al.2018). Therefore,it is necessary to establish a newNccurve for hybridindicarice cultivated under PMT.
In this study,field experiments with N-treatments were performed in 2018 and 2019. The aims of the study were:(1) to establish aNccurve for modern high-yield hybridindicarice cultivated under PMT;and (2) to quantify the N nutrition status of hybridindicarice based on the NNI andNand. This study would provide some theoretical and technical support for rapid and accurate N-nutrition status evaluation to obtain high yield and high N-use efficiency for hybridindicarice under PMT.
2.Materials and methods
2.1.Experimental site and materials
The field experiments were conducted in two consecutive rice-growing seasons (2018 and 2019) at the Guohe Experimental Station (31°28´N,117°13´E) in Anhui Province,China. The station is in a subtropical monsoon climate zone.The soil is sandy loam. The weather conditions are shown in Fig.1. The physical and chemical properties of the topsoil(0–20 cm deep) are shown in Table 1.
Two high-quality and high-yield hybridindicarice cultivars,Huiliangyou 898 (HLY-898) and Y Liangyou 900 (YLY-900),were used in the experiment. Rice seeds were sown mechanically using an LSP-40AM system(Yameike,Beijing,China) into special plastic nursery trays for seedlings,then transplanted using an RXA-60T rice transplanter (Yameike,Beijing,China). Three seedlings were planted in each hill in each year of the experiment.The spacing between rows was 33.0 cm and the spacing between plants in a row was 15.7 cm.
2.2.Experimental design and management
Five N-fertilization rates (0–300 kg ha-1) were used in the field experiment for both cultivars and both years. A randomized block design was adopted with three replicates in 2018 and four replicates in 2019 (Table 1).The plots used measured at 40 m2(4 m×10 m) in 2018 and 36 m2(4 m×9 m) in 2019. For each treatment,the N fertilizer was split into three applications,with 40% used as the basal fertilizer,30% provided at tillering and 30% provided at panicle initiation. Phosphorus and potassium fertilizers(P2O5105 kg ha-1and K2O 225 kg ha-1) were also applied as basal fertilizers. The basal fertilizers were applied to the soil the day before transplanting. Ridges covered with plastic film were constructed around each plot to prevent the channeling of water and the fertilizer. Irrigation was sufficient to maintain shallow water in each plot during the tillering stage. Drainage was started and the plants were exposed to the sun when the number of stems and tillers reached 80% of the expected number of panicles. Dry and wet alternate irrigation was performed from the jointing to the maturity stages,until one week before harvest. The methods used to prevent and control diseases,insect pests and weeds were consistent with the methods used in local high-yield fields.
2.3.Sampling and measurement
Three representative hills in each plot were collected during the observed periods according to the average number of tillers in each plot. The sampling dates are presented in Table 1. The fresh plants were separated into stems,leaves and panicles. Each sample was oven-dried for 30 min at 105°C to quickly stop metabolic activity and then at 80°C to constant weight to determine the DM contents of different organs (t ha-1). Each sample was then ground and passed through a 100-mesh sieve before chemical analysis was performed. The N concentration (%) in a sample was determined using the Kjeldahl method. The effective panicle number in each plot was determined from 50 hills. Six hills were selected based on the mean effective panicle number for the field,and the yield components (number of grains per panicle,filling-grain rate and 1 000-grain weight) were determined. The actual yield for the rest of the hills in each plot was calculated. Grain yield was expressed at 14%moisture content.
2.4.Data analysis
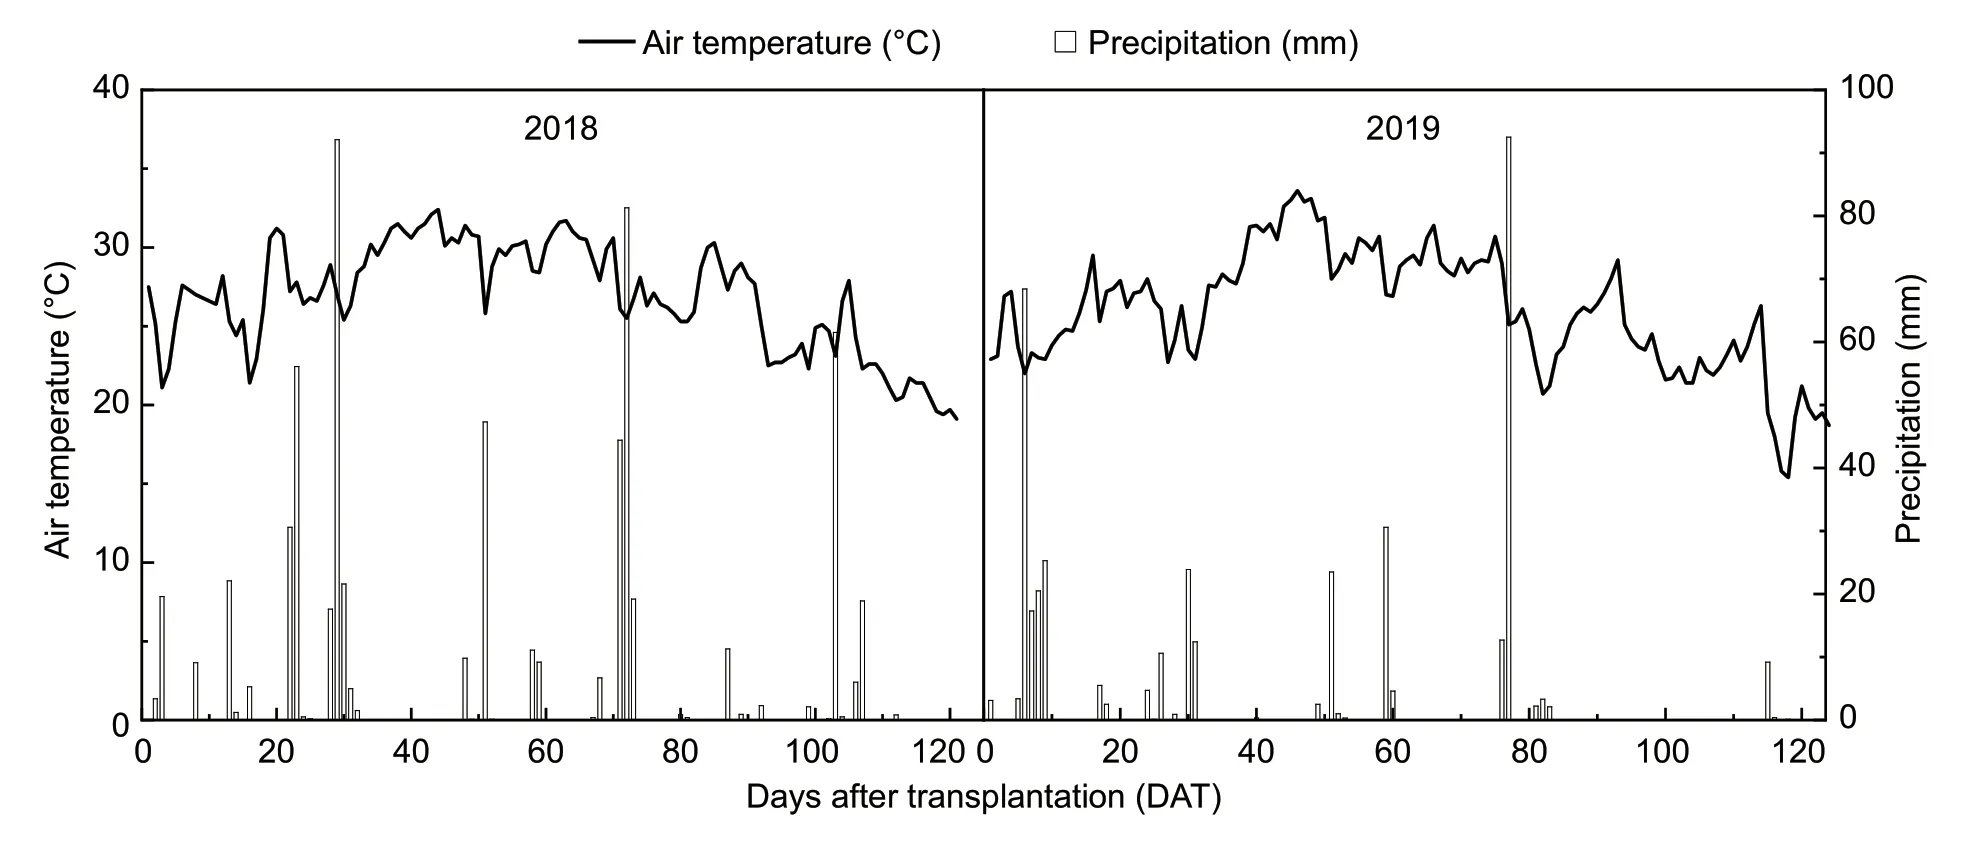
Fig.1 Air temperature and precipitation in the rice growth seasons of 2018 and 2019.

Table 1 Basic information on the field experiments
Nc dilution curve for hybrid indica rice cultivated under PMTGenerating anNccurve needs the identification of critical data points at which N neither limits nor enhances plant growth. TheNcvalues were determined using a method developed by Justeset al.(1994) and Ata-Ul-Karimet al.(2013). For a particular sampling date,a critical point was defined using four processes:(I) the shoot DM and N concentration data for the different N treatments were compared by performing an analysis of variance (using SPSS Software;IBM,Armonk,NY,USA) using the 5%probability level. These data points were used either to construct or validate theNcdilution curve. (II) Data for each sampling date were divided into two groups;(i) a N-limited group in which increasing the N supply caused a significant change in the shoot DM and N concentration and (ii) a non-N-limited group in which increasing the N supply did not increase the shoot DM but did increase the N concentration.(III) The data for the N-limited group were fitted using a simple linear regression (an oblique line),whereas the data for the non-N-limited group was used to calculate the maximum shoot DM from the mean of the observed data(a vertical line). (IV) The theoreticalNcpoint was defined as the ordinate value of the intersection point of the oblique and vertical lines. The allometric equation for the line fitted to the critical points using a previously published description of theNcconcept (Greenwoodet al.1990). The equation is:

whereNcis the critical N concentration (%) corresponding to the rice shoot DM,DM is the maximum shoot DM (t ha-1),ais the N concentration when the shoot DM is equal to 1 t ha-1,andbis a statistical parameter controlling the slope of the curve. TheNccurve was established using the 2019 data points and then validated using the independent 2018 data points.
Also,the currently widely acceptedNcconcentration curves developed for rice plants by Sheehyet al.(1998)(Nc=5.18DM–0.52),Ata-UI-Karimet al.(2013) (Nc=3.53DM–0.28if the DM>1.55 t ha–1,andNc=3.05%DM if DM<1.55 t ha–1)and Lüet al.(2018) (Nc=3.36DM–0.31) were used to compare and assess the accuracy and applicability of each curve.
Verification of the Nc curveThe root-mean-square error(RMSE) and normalized root-mean-square error (n-RMSE)were used to validate the curve. The RMSE and n-RMSE were calculated using eqs.(2) and (3),respectively;in whichPiandOiare the measured and simulatedNcvalues,respectively,nis the sample size and S is the mean value for the data. The accuracy of the curve was verified using published standards (Jamiesonet al.1991). A small RMSE value (n-RMSE<10%) was taken to indicate that the curve’s performance was excellent,10%≤n-RMSE≤20% good performance,20%≤n-RMSE≤30% fair performance and n-RMSE≥30% poor performance.

NNI and NandThe NNI was defined as the ratio between the measured N concentration in rice shoots (Nt) and the critical N concentration (Nc) for the same shoot DM (Greenwoodet al.1990). NNI=1 was taken to indicate that the N nutrition of the rice plants had reached an appropriate state,NNI >1 to indicate that the rice plants absorbed too much N,and NNI<1 to indicate that the rice plants lacked N.

TheNcdilution curve was used to derive a critical N accumulation (Ncna) model and an accumulative N deficit(Nand) model (Xueet al.2006).Nand=0 was taken to indicate that N nutrition was optimal,Nand>0 to indicate N deficiency,andNand<0 to indicate that excess N was consumed.

In eqs.(5) and (6),Ncnais N accumulation (kg ha-1) at theNccondition of the plants andNnais the actual amount of N accumulated (kg ha-1) by the plants at the N-fertilizer treatment rate that was used.
The relative yield (RY) was defined as the ratio of the grain yield for a given N-fertilizer application rate to the highest grain yield for all of the N-fertilizer application rates(Ziadiet al.2008).
3.Results
3.1.Shoot DM,yield and N concentration
The N application rate strongly affected shoot DM throughout the growth period (Table 2). The shoot DM values were 0.23–19.96 t ha-1for HLY-898 and 0.31–19.74 t ha-1for YLY-900 in 2018 and 0.45–19.74 t ha-1for HLY-898 and 0.45–22.14 t ha-1for YLY-900 in 2019. The DM significantly increased with increasing N application rate from the N0 to N3 treatments,for both cultivars and in both years (P<0.05;Table 2). However,there were no significant differences found between the N3 and N4 for DM parameters across cultivars in both years (P>0.05;Table 2). Therefore,the N0,N1,N2,and N3 treatments were treated as N-limited groups,and the N3 and N4 treatments were defined as non-N-limited groups when theNccurve was constructed.
In general,the N concentrations in the plants were 0.89–4.22% for HLY-898 and 0.79–4.19% for YLY-900 in 2018,and 0.83–3.90% for HLY-898 and 0.80–3.99% for YLY-900 in 2019. Increasing the N application rate generally increased the N concentration in the plants,but the N concentration decreased as the shoot DM increased during the growth period (Fig.2).
3.2.Development of a Nc dilution curve for hybrid indica rice cultivated under PMT
TheNcpoint was determined by identifying the intercept between the vertical and oblique lines fitted through the data points for each sampling date,for HLY-898 and YLY-900,respectively. TheNcvalues for both cultivars decreased as the critical shoot biomass increased. The equations for theNcfor HLY-898 and YLY-900 wereNc=3.76DM-0.41andNc=4.33DM-0.44,respectively. The coefficients of determination were >0.99 for both cultivars. The fitted lines are shown in Fig.3-A.
Similar trends in theNcdilution curves were found for both cultivars. The HLY-898 and YLY-900 curves did not have significantly different parameters (P>0.05). The data for HLY-898 and YLY-900 were therefore pooled and the single dilution curve is shown in Fig.3-B. TheNcdilution curve cannot be applied to low shoot biomass due to a relatively smaller decline ofNcwith increasing shoot biomass at the early growth stage. For a shoot biomass (DM<1.20 t ha–1),theNcbest fitted with a constant value of 3.73% DM (Fig.3).
3.3.Verification of the Nc dilution curve
The predictedNcwas calculated and compared with the measuredNcdata for 2018 (Fig.4-A). The RMSE and n-RMSE of theNccurve were 0.23 and 10.61%,respectively.The lower values of RMSE and higher values ofR2showed very good stability between the observed and predictedNc.The rice data were divided into the non-N-limiting group and the N-limiting group to evaluate the existingNcdilution curves developed by Sheehyet al.(1998),Ata-Ul-Karimet al.(2013) and Lüet al.(2018). These data points were plotted together with the existingNcdilution curves for rice(Fig.4-B). TheNccurves of Ata-Ul-Karimet al.(2013) and Lüet al.(2018) were lower than that of Sheehyet al.(1998)when DM values were <5 and 7.5 t ha–1,respectively,but higher beyond those values (Fig.4-B). Almost all of the N-limiting data points were below these curves in our study.However,about 50% of the non-N-limiting data points were below the Ata-Ul-Karim curve and about 30% of the non-N-limiting data points were below the Sheehy curve and Lü curve,indicating that none of these three curves was suitable for hybridindicarice under PMT.
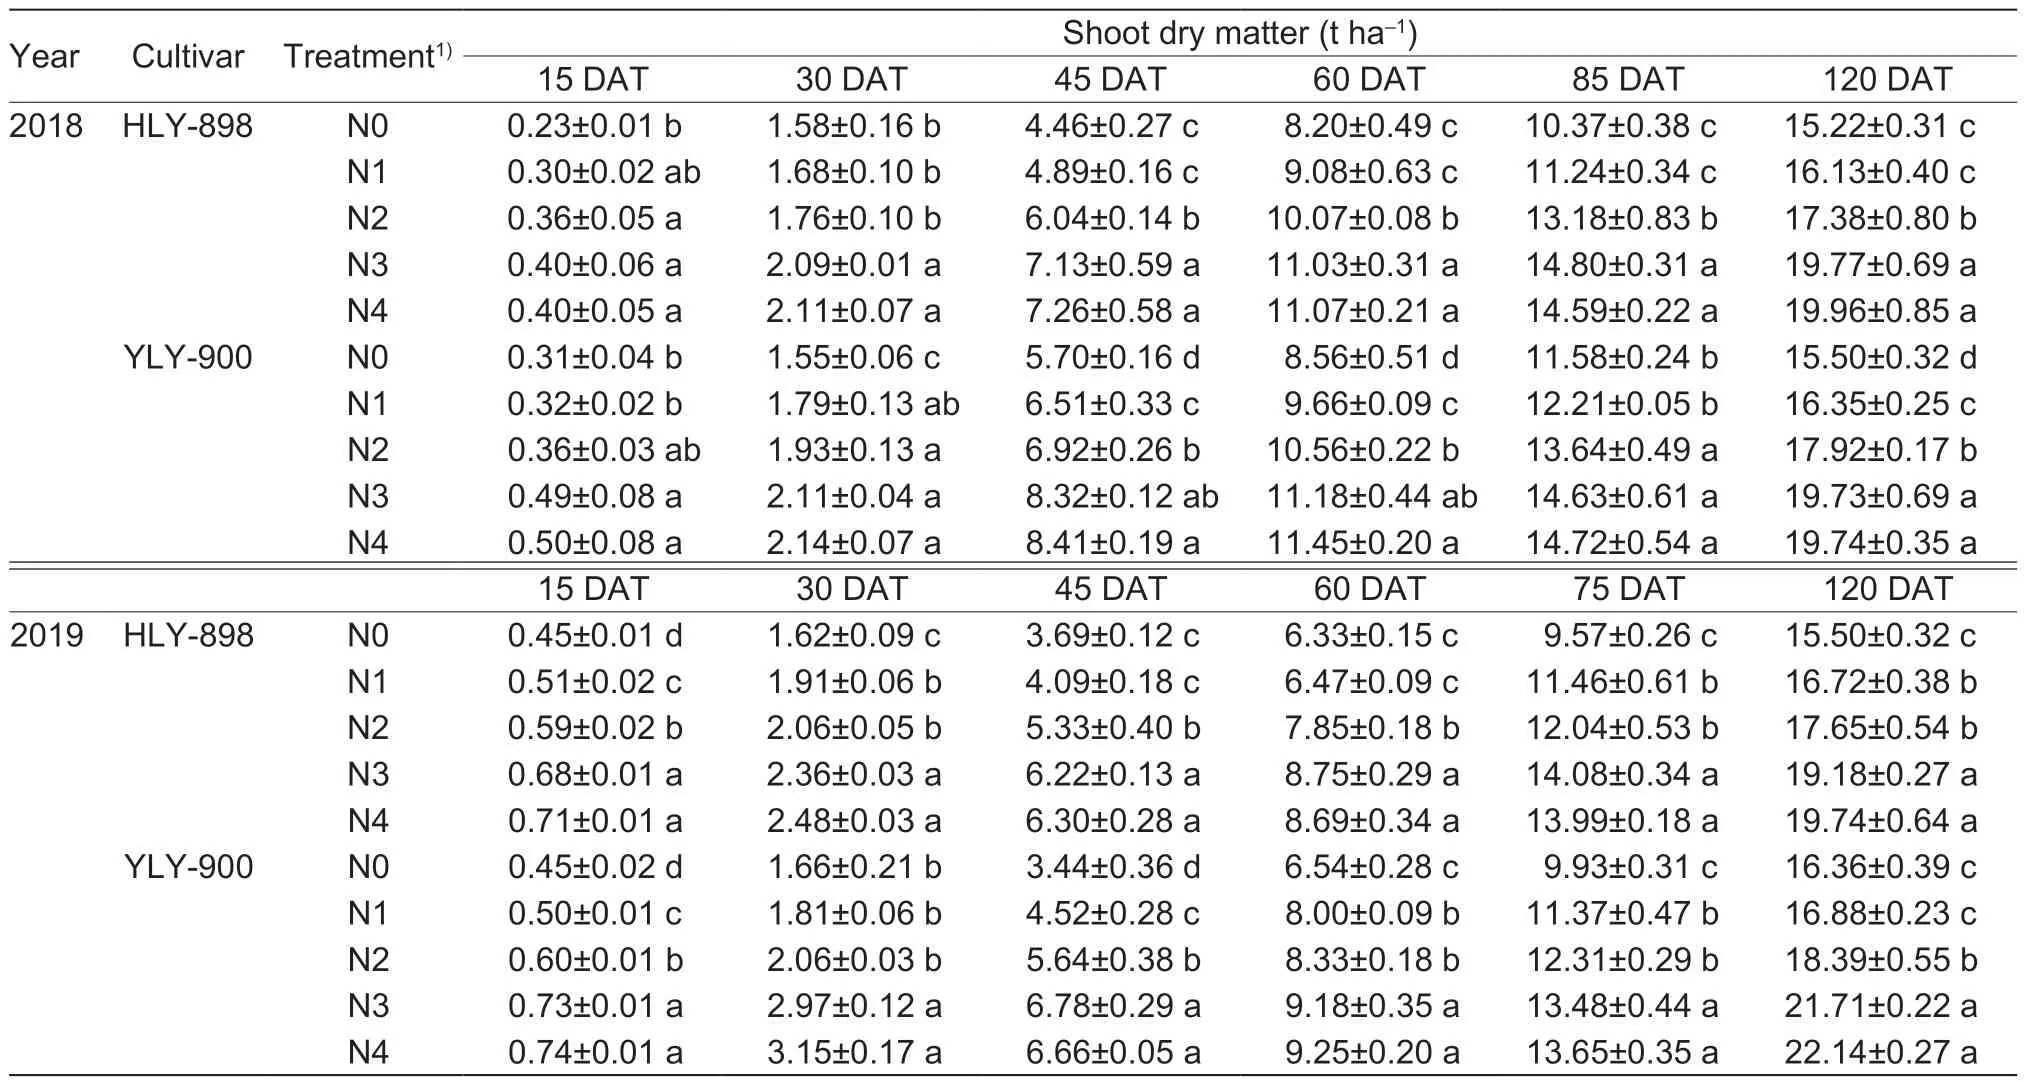
Table 2 Effects of the nitrogen application rates on dynamic accumulation of rice shoot dry matter in the days after transplantation(DAT)
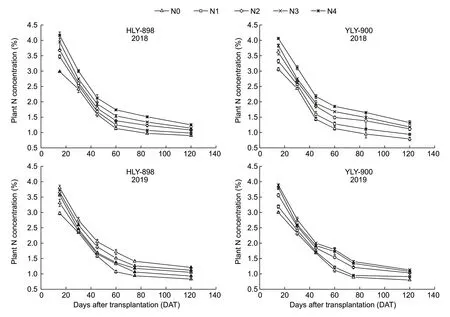
Fig.2 N concentrations (%) in rice plants after transplantation in experiments with different N application rates performed in 2018 and 2019. N0–N4,0,75,150,and 225 kg N ha–1,respectively. Bars mean SE (2018,n=3;2019,n=4).
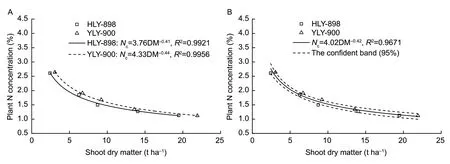
Fig.3 Critical nitrogen (Nc ) dilution curve for hybrid indica rice under pot-seedling mechanical transplanting (PMT). A,for Huiliangyou 898 (HLY-898) and Y Liangyou 900 (YLY-900). B,for hybrid indica rice. The solid lines are the Nc dilution curves describing the relationships between the Nc and shoot dry matter;the dotted lines indicate the 95% confidence band.
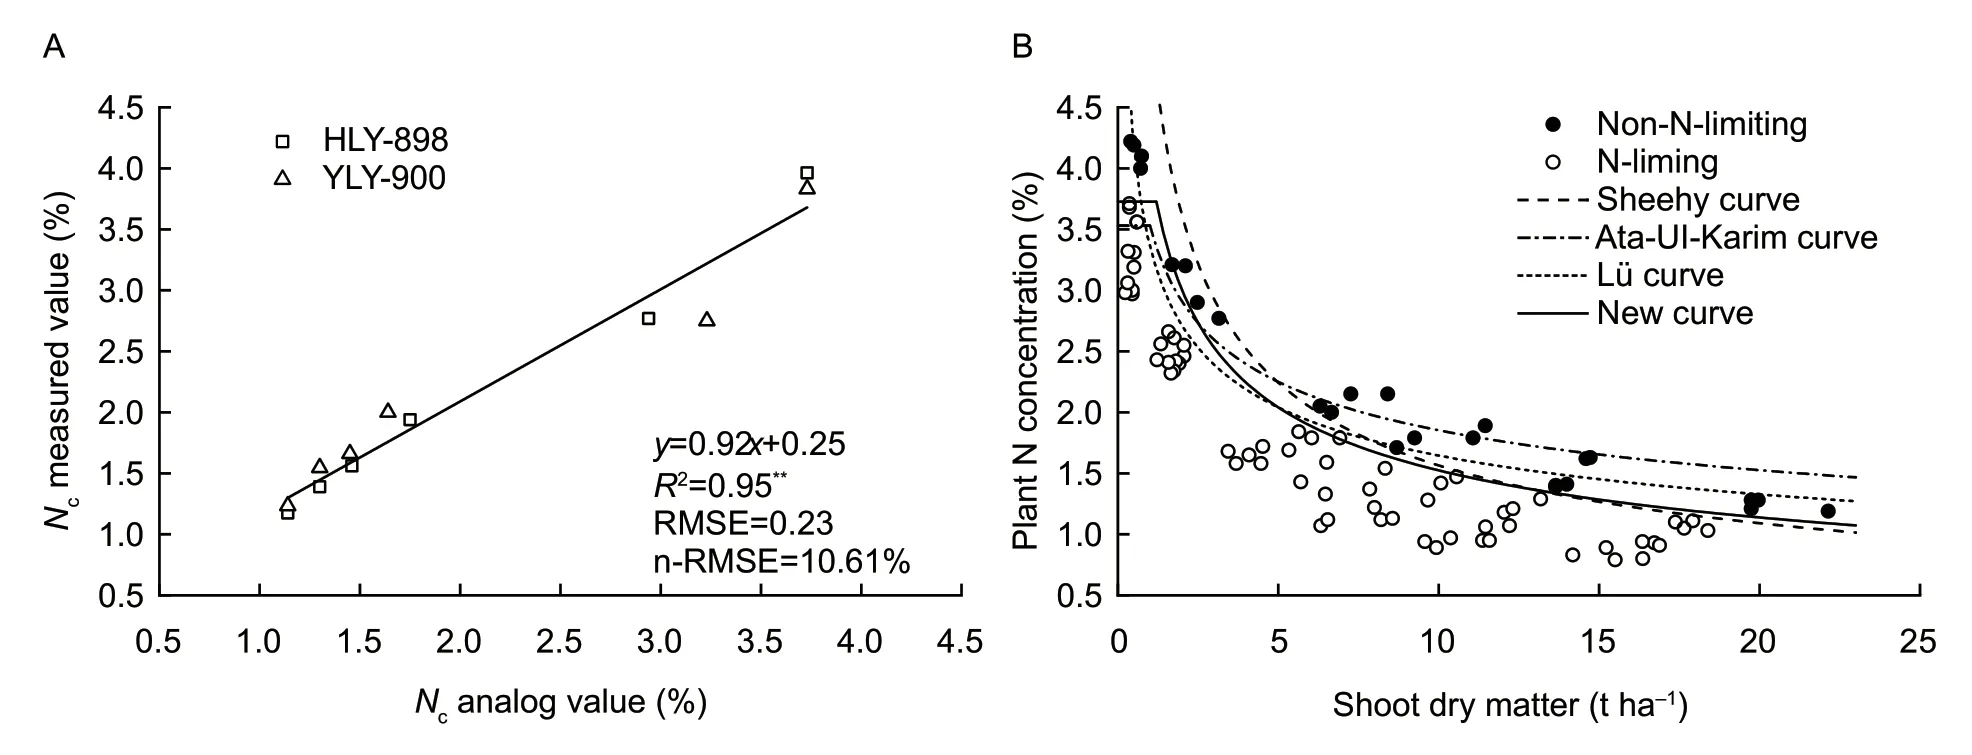
Fig.4 Validation of the critical N (Nc ) dilution curve (A) and evaluation of the previously established Nc dilution curves for rice N status diagnosis (B). The Nc dilution curve developed for indica rice by Sheehy et al.(1998) (Nc =5.18DM–0.52);the Nc dilution curve developed for japonica rice by Ata-UI-Karim et al.(2013) (Nc =3.53DM–0.28) in Yangtze River Reaches;the Nc dilution curve developed for hybrid indica rice by Lü et al.(2018) (Nc =3.36DM–0.31) in Yangtze River Reaches.
3.4.Variability of the NNI and Nand with the development stage for the different N application rates
The NNI can be used to quantify the intensity of N stress after the onset of N deficiency. The N application rate markedly affected the NNI throughout the growth period(Fig.5). The NNI for shoot DM increased with increasing N dose. The NNI was 0.65–1.23 for HLY-898 and 0.66–1.31 for YLY-900 in 2018. In 2019,the NNI was 0.58–1.11 for HLY-898 and 0.58–1.14 for YLY-900. The NNI was close to 1 for the N3 treatment in 2018 and 2019,indicating that the N dose was appropriate. Except for the N2 treatment of YLY-900 in 2018,the NNI across both cultivars and years was <1 for the N0,N1 and N2 treatments indicating that the N0,N1 and N2 treatments belonged to the N-limited group.The N4 treatment was in the non-N-limited group because its NNI was >1 (Fig.5). There was excess N in the non-Nlimited treatments. These results confirmed that NNI could be used to provide insights into N nutrition.
The N treatments had significant effects onNandfor both cultivars in the two study years (Fig.6;P<0.05). TheNandwas significantly decreased when the N-application rate was increased. The reduction forNandbecame gradually stronger among the N treatments during the growth and development of rice plants for both cultivars in 2018 and 2019. TheNandfor the N3 treatment was close to 0 for HLY-898 and YLY-900 cultivars in 2018 and 2019,indicating that the N dose was appropriate. TheNandvalues were >0 for the N0,N1 and N2 treatments of both cultivars in two years,indicating that there was N-limited rice growth. TheNandvalue was <0 for the N4 treatment,indicating that N did not limit growth. Excess N was found to be present in the non-N-limited treatments.
3.5.Relationships between NNI and Nand and the relative yield
A quantitative relationship between the NNI andNandwas established throughout the growth period (Fig.7). Significant correlations in both years showed that the NNI could be used to accurately calculate the accumulative N deficit of rice under N-limited and non-N-limited conditions. There were negative linear correlations found between the NNI andNandin the different growth stages,but the correlations became gradually weaker when rice plants were closer to maturity. Finally,NNI at the early-tillering,mid-tillering,stem elongation,panicle initiation,heading,and mature stages were calculated as 1.21,0.99,1.04,1.02,1.02,and 1.02,respectively,whereNand=0. These NNI could be used to recommend N-dressing corrections as a rice crop grows.
There existed a linear-plateau function relationship between N nutrition index (NNI) and RY (Fig.8;R2=0.73–0.92). The maximum RY could be obtained when NNI in the active tillering (AT),mid-tillering (MT),stem elongation(SE),panicle initiation (PI),heading (HD),and mature stages (MA) was 1.03,0.94,1.09,1.07,1.05,and 0.99,respectively (Fig.8).
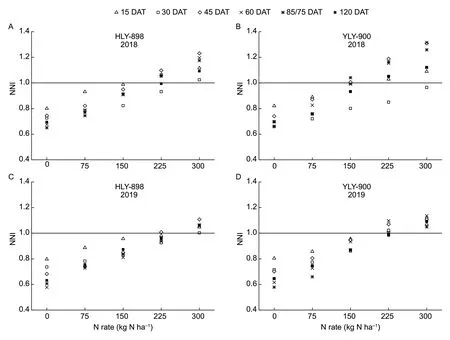
Fig.5 N nutrition index (NNI) after transplantation of rice under different N application rates in experiments performed in 2018 and 2019. DAT,days after transplantation.
4.Discussion
4.1.Nc dilution curve for hybrid indica rice cultivated under PMT
Studies based on large numbers of field experiments demonstrated that there was no difference in the variation of the critical N% among the same eco-types forjaponicarice,indicarice and winter wheat. Data for the different cultivars of the same subtype of rice were usually combined to improve the applicability of the curve (Ata-Ul-Karimet al.2013;Yaoet al.2014). Our results supported this conclusion,in which curve parameters showed no significant differences for the twoindicahybrid cultivars (P>0.05;Fig.3).
TheNccurve parameters ‘a’ and ‘b’ were 2.77 to 5.18 and 0.25 to 0.52,respectively,for rice,based on plant dry matter from previous studies. In this study,the values were 4.02 (parametera) and 0.42 (parameterb) merged for the two cultivars,and both ‘a’ and ‘b’ of our research were significantly lower than in theindicarice curve established by Sheehyet al.(1998) in tropical regions. Moreover,Huanget al.(2018) constructed the curve ofjaponicarice in the cold Northeast China Plain. The parameter ‘a’ was at 2.77 (Huanget al.2018). This difference may be related to different ecological conditions. The photoperiods in subtropical temperate regions and tropical regions were 13 and 11.5 h,respectively. Rice plants grown in subtropical temperate regions have longer growth periods and receive more solar radiation than those grown in tropical regions(Ata-Ul-Karimet al.2013). Low temperature decreases N absorption and N accumulation of rice plants,so parameter‘a’ would be reduced with decreasing temperature.
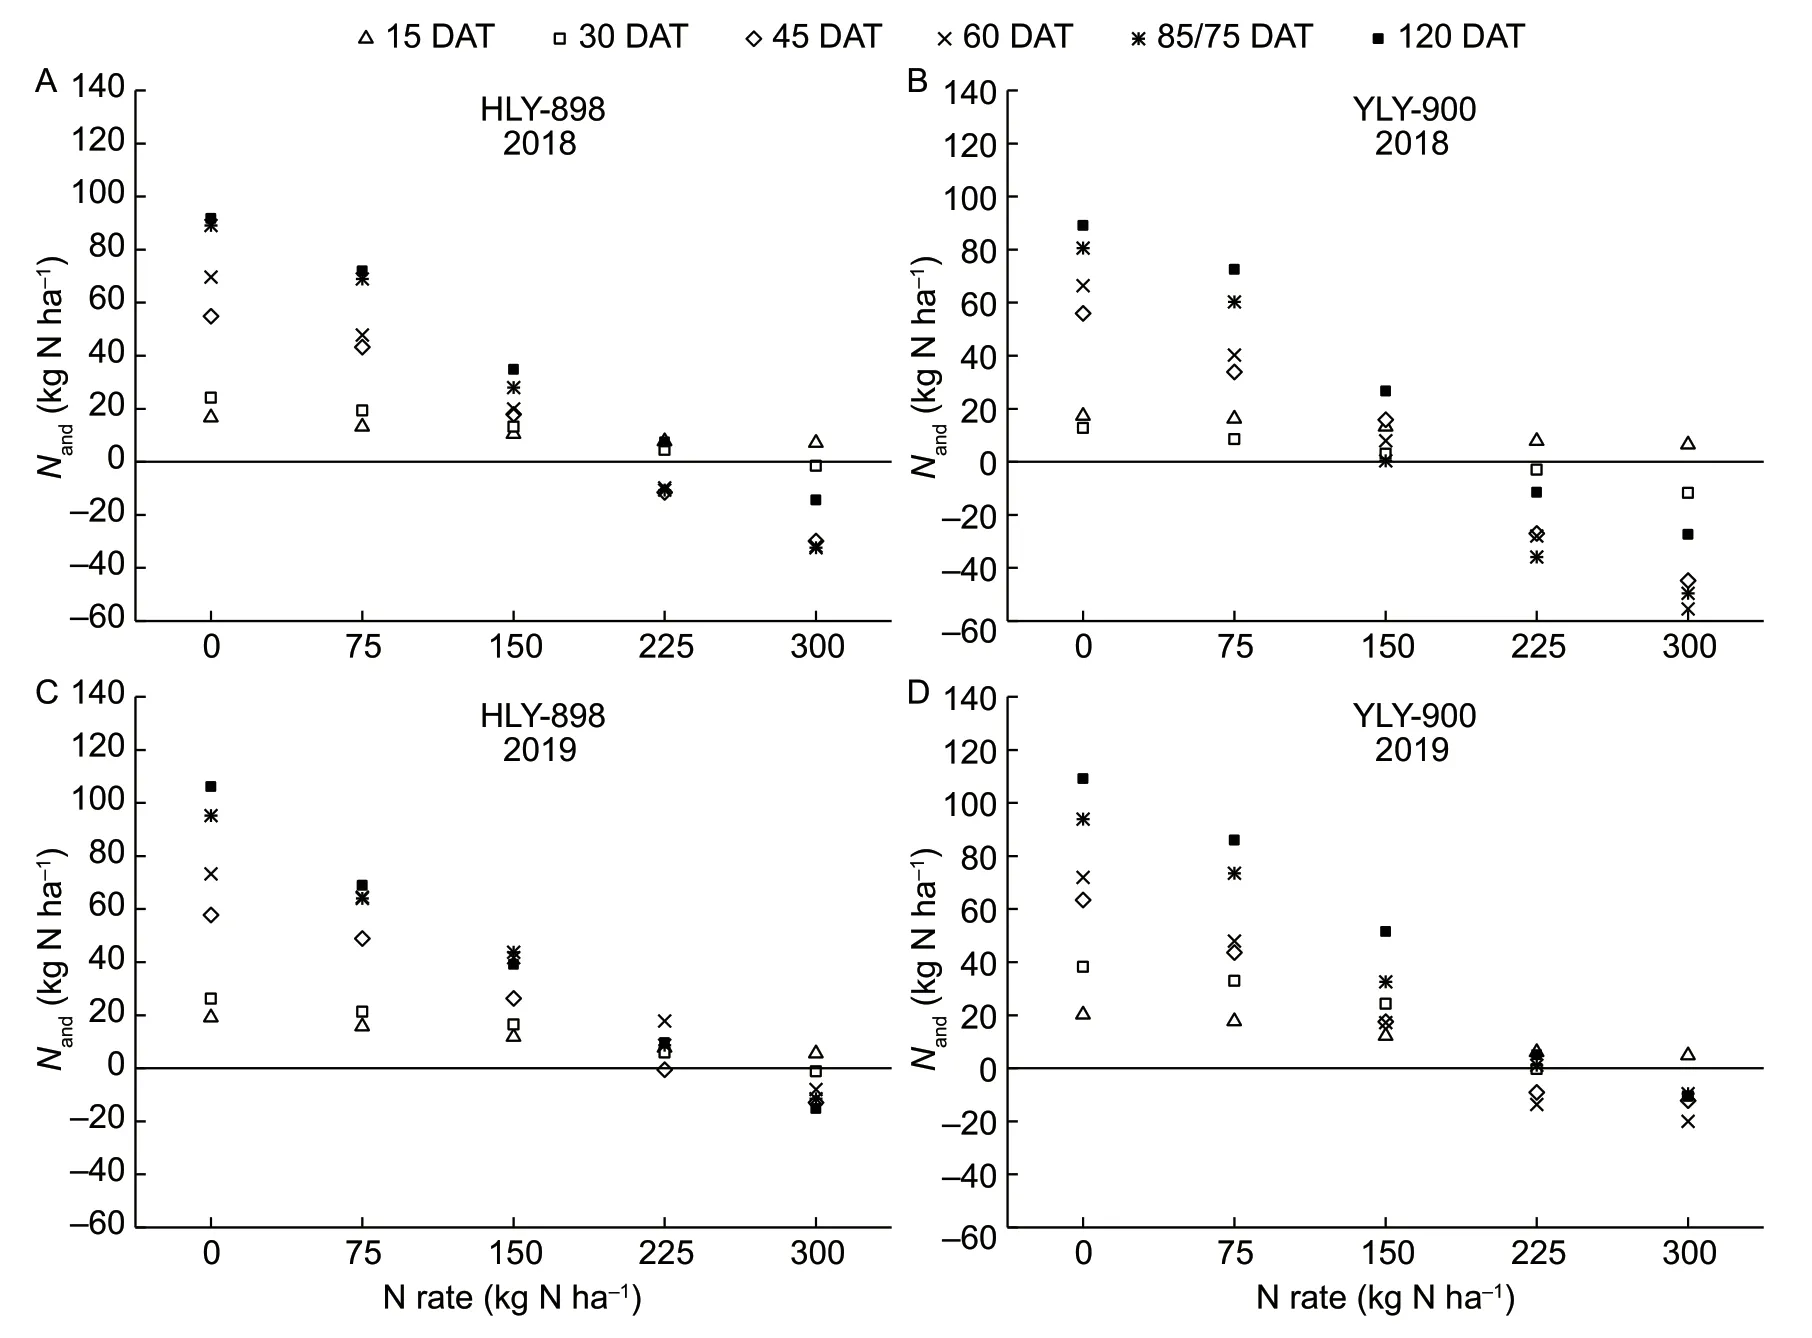
Fig.6 Changes in the accumulated nitrogen deficit (Nand ) after rice transplantation under different N application rates in experiments performed in 2018 and 2019. DAT,days after transplantation.
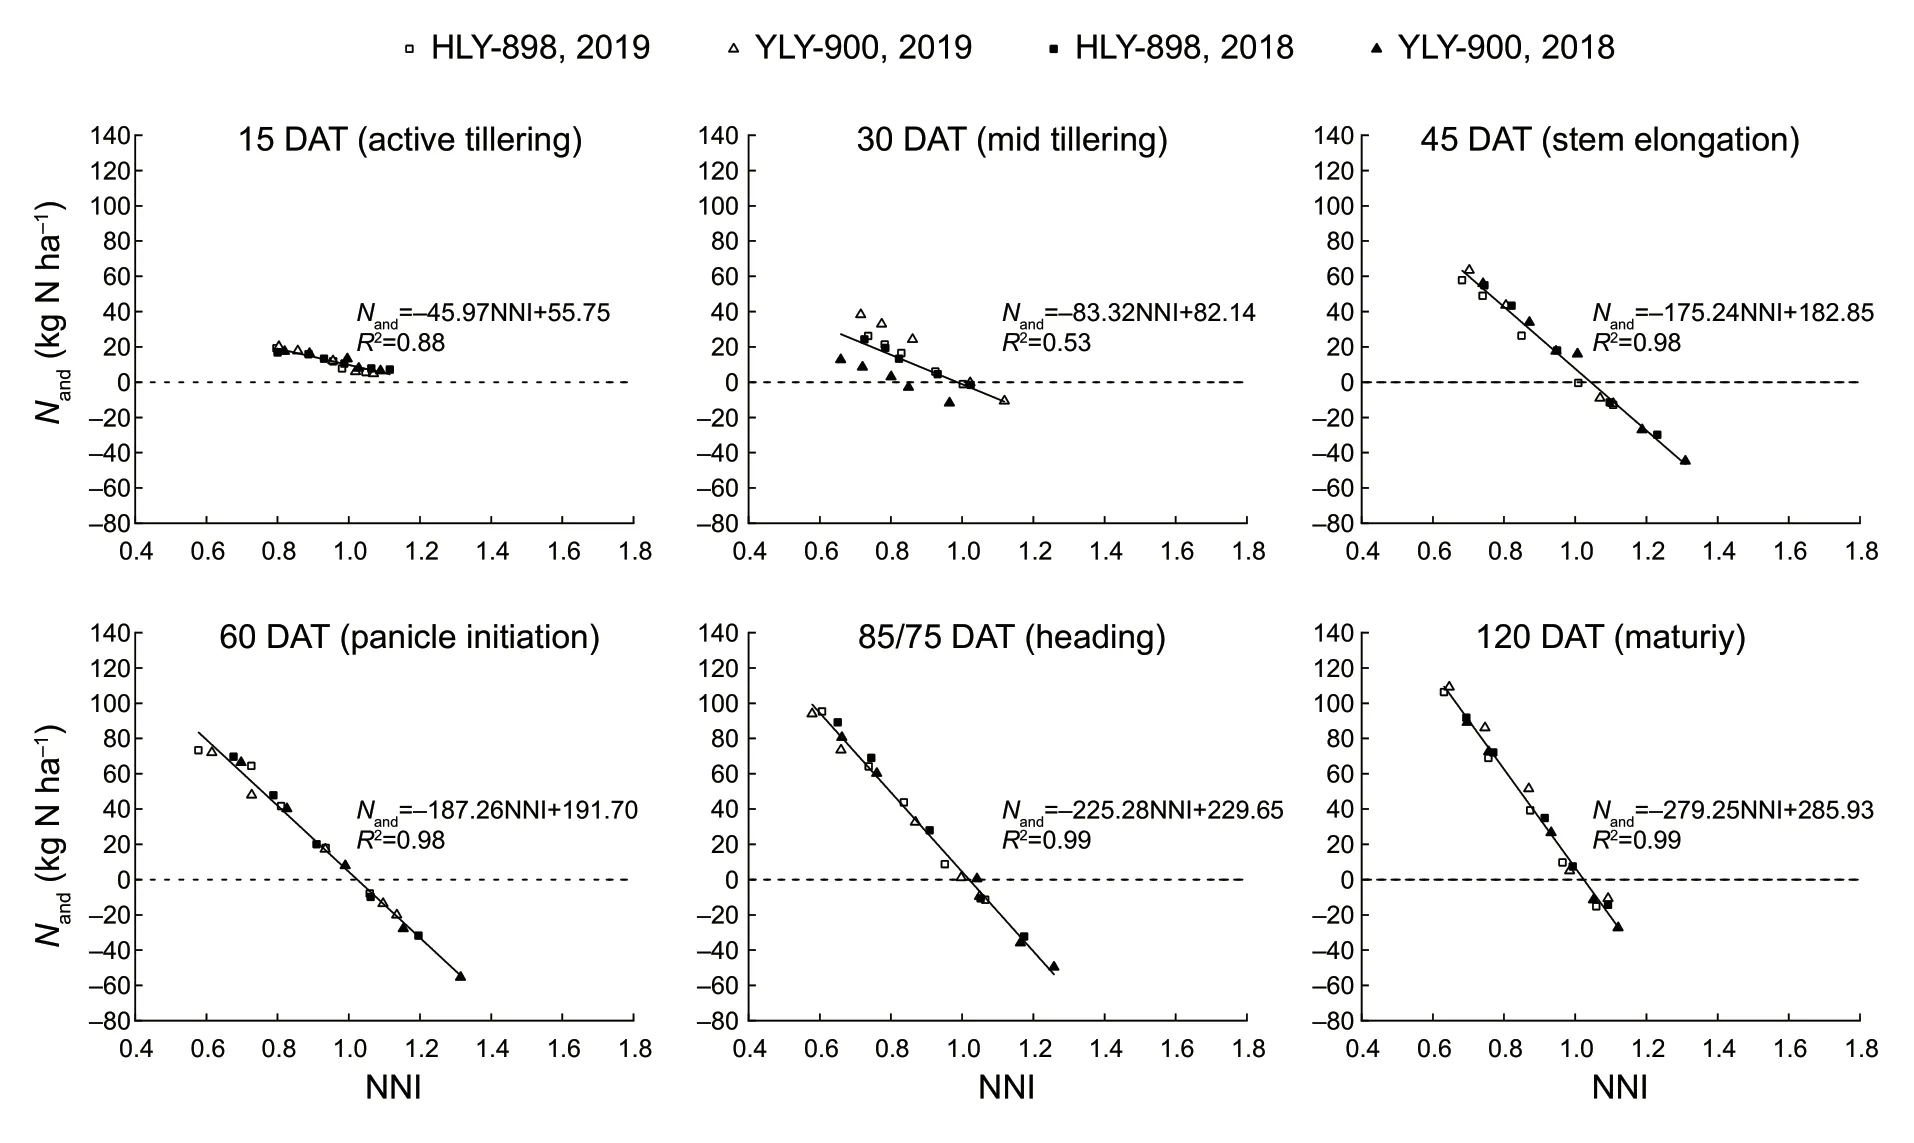
Fig.7 Relationships between the N nutrition index (NNI) and accumulated nitrogen deficit (Nand ). DAT,days after transplantation.
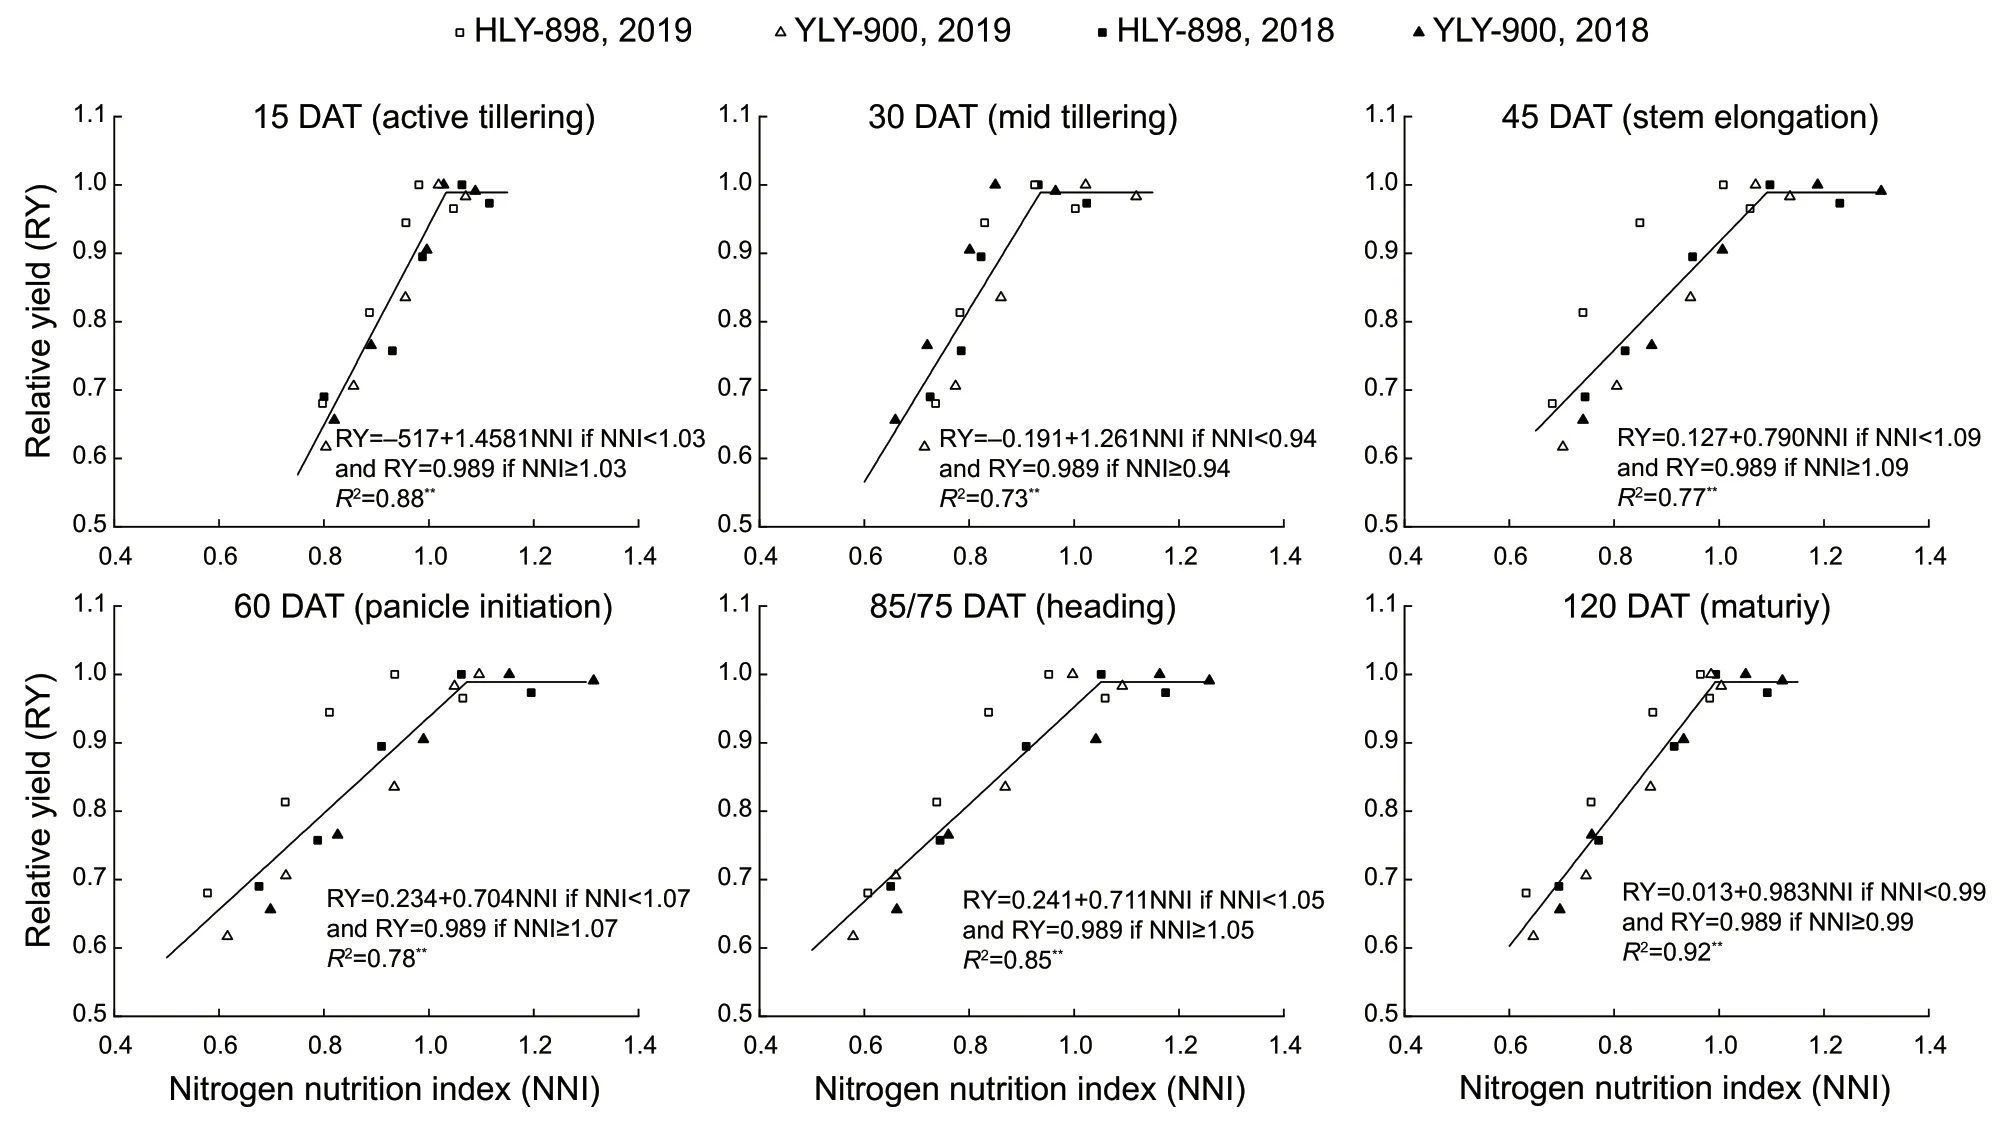
Fig.8 Relationships between the N nutrition index (NNI) and relative yield (RY) in the different growth stages. DAT,days after transplantation.
This study also obtained higher ‘a’ and ‘b’ values than previous research forindicarice cultivars in the adjacent study area in Jiangxi Province (Lüet al.2018). Genetic differences between cultivars and cultivation technologies also affect parameters ‘a’ and ‘b’. Hybridindicacultivars were chosen for this study. Hybridindicarice has higher yields,stronger growth potential and greater biomass than conventional rice (Huet al.2018a,b,c). Poor biomass productivity of conventional rice is associated with lower‘a’ and ‘b’ values and higher biomass of hybridindicarice.Also,this study was performed under PMT compared with the Lü’et al.(2018) (which used artificial transplanting).Rice plants have stronger root systems,tillering and higher N absorbing capacity under PMT than under traditional artificial transplanting or TMT (Heet al.2018). Also,PMT had higher ‘a’ and ‘b’ values compared with TMT. These results indicate that higher ‘a’ and ‘b’ values are associated with high-yield at harvest and high N-use efficiency. There was a slight difference for parameter ‘b’,when compared with previous studies. This meant that the ‘a’ value could be more strongly affected by ecological conditions,cultivars and technologies than the ‘b’ value. Zhao (2014) suggested that ‘b’ is a statistical parameter that controls the slope of the curve and is only minimally affected by environmental factors such as the climate,soil type and cultivar differences.Therefore,the parameters ‘a’ and ‘b’ need to be studied further.
TheNcdilution curve for hybridindicarice cultivated under PMT,constructed using the field experiment data for the two cultivars in two years,accurately described the relationship between the shoot DM and N concentration of the rice. However,the experiment was conducted in a single ecological area. The reliability of the curve needs to be tested using data from areas with different ecological states and from experiments using multiple species acquired over many years.
4.2.Diagnosis of the N nutrition status of rice using the Nc dilution curve
The NNI value calculated from the dilution curve is considered to be a good indicator of crop N nutrition. It not only intuitively reflects the N nutrition status of the crop,but also quantifies the N deficiency (Huanget al.2018). In this study,N nutrition diagnosis was performed for the hybridindicarice cultivated under PMT with different N application rates. These results indicate that the most appropriate N application rate for hybridindicarice is 225 kg ha-1under PMT,which is higher than the rate used for conventionalindicarice (160–200 kg ha-1) (Chen and Yang 2012). This indicates that more N fertilizer was required for the hybrid rice than for conventionalindicarice (Anet al.2019).TheNanddetermined from theNcdilution curve accurately indicates that N surplus and deficit at different growth stages can be used to determine when and how much supplemental N should be given to rice plants (Zhaoet al.2012). Under the conditions used in this study,theNandranged from 109 to–55 kg ha-1. Increasing the N application rate causedNandto continually decrease. TheNandwas close to 0 at the N application rate of 225 kg ha-1used in treatment N3,indicating that N nutrition was appropriate when the N application rate was 225 kg ha-1. This was consistent with the NNI recommendation for the optimum N application rate for hybridindicarice cultivated under PMT.
4.3.The recommended amount of N-fertilization determined using the NNI
The NNI determined by theNcdilution curve can be used to determine the required amount of fertilization. In general,the optimal N application rate is usually obtained when NNI is very near or equal to 1 (Zhaoet al.2012). TheNcdilution curves and NNI for crops have been used to determine the optimal N application rates for different test conditions (Xueet al.2006;Yaoet al.2014;Ata-Ul-Karimet al.2017). The optimal N application rates for a given crop were similar,indicating that the recommended N application rate can be reliably determined using theNcdilution curve. However,this method is affected by the N fertilizer gradient. Setting a high N fertilizer gradient in an experiment may produce high recommended application rates,which is not conducive to minimizing the cost of N fertilizer and protecting the environment. Also,the method would be inaccurate if the optimal N application amount is not within the appropriate N fertilizer gradient set in an experiment.Therefore,it is important to clarify the relationship between fertilizer requirement and NNI.
Zhaoet al.(2012) and Luet al.(2019) found good negative linear relationships between crop N deficiency(Nand) and NNI. These potential relationships could provide important references to quantify the N application rate and determine the optimum N fertilizer rate. The N deficit value calculated using theNcdilution curve can be used not only to quantitatively and intuitively diagnose the N nutrition status of a crop but also to quantify the accumulation and loss of N by a crop. The N fertilizer demand of rice throughout the growing period can be quantified by combining this with the N utilization efficiency of the crop under different conditions.
It should be noted that the linear relationship between the NNI andNandin the different growth stages had different responses to the applied amount of N-fertilizer and N-absorbing capacities. Therefore,quantitative relationships should be established for the different growth stages to improve the applicability and accuracy of the model and to allow the optimum amount of N fertilizer to be applied during the rice-growing period and particularly to correct N deficiency. However,there are other problematic issues in precisely calculating the N fertilization recommendation. It is difficult to correctly determine the target yield before the establishment of the cultivation plans because the actual yield is strongly affected by solar radiation and temperature;so N fertilization recommendation strategies would be inaccurate if actual yields are higher or lower than the target yield or yield potential (Yueet al.2012). Using the linearplateau function between NNI and RY would produce high yields from hybridindicarice cultivated under PMT,at the maximum RY the NNI for the different growth stages was around 1. The NNI values at panicle initiation and heading stages (1.07 and 1.05,respectively) indicate that increasing the N nutrition status of a plant will ensure the maximum growth and a high yield. Coordinating the NNI values for different growth periods can allow the production costs and environmental protection to be balanced. Using the NNI to determine the amount of N fertilizer to apply and to maintain an adequate N supply to the plants is critical for achieving high yields from rice plants cultivated under PMT.
The traditional method for calculating the NNI is timeconsuming and involves destructive sampling,which preclude widespread application. The development of remote sensing technologies has allowed correlations between vegetation indices and crop growth monitoring indices to be established. N concentrations in crops and shoot DM can be estimated directly or indirectly from such correlations (Mistele and Schmidhalter 2008). The NNI could be easier to assess,meaning N nutrition diagnoses can be determined easily. However,it remains to be determined whether the errors generated in each estimation step affect the final N regulation information. Therefore,the accuracy and efficiency of such diagnoses should be assessed when theNcdilution curve is used.
5.Conclusion
A new critical N dilution curve for hybridindicarice under a PMT pattern was developed (Nc=4.02DM-0.42). This curve can more accurately and reliably determine the nitrogen nutrition status of hybridindicarice in PMT than the existing curves.
NNI could be used to evaluate the N nutrition status of hybridindicarice under PMT at different growth stages. The most reasonable N application rate was recommended as 225 kg ha-1based on the NNI.
The quantitative relationship between the NNI andNandat different growth stages allowed theNandthroughout the growth process to be quantified. This will help to improve the management of rice fertilization at a real-time dynamic level.
Acknowledgements
This work was supported by the National Key R&D Program of China (2016YFD0300608,2016YFD0300505 and 2017YFD0301305) and the Key Research and Development Program of Anhui Province,China (1804h07020150).
Declaration of competing interest
The authors declare that they have no conflict of interest.
杂志排行
Journal of Integrative Agriculture的其它文章
- Low glycemic index:The next target for rice production in China?
- Effects of different types of slow-and controlled-release fertilizers on rice yield
- Advancements in plant regeneration and genetic transformation of grapevine (Vitis spp.)
- Indica rice restorer lines with large sink potential exhibit improved nutrient transportation to the panicle,which enhances both yield and nitrogen-use efficiency
- Effects of nitrogen management on the ratoon crop yield and head rice yield in South USA
- Response of grain-filling rate and grain quality of mid-season indica rice to nitrogen application
