Effects of different types of slow-and controlled-release fertilizers on rice yield
2021-05-23
Jiangsu Collaborative Innovation Center for Modern Crop Production/National Engineering and Technology Center for Information Agricultrue/Key Laboratory of Crop Physiology and Ecology in Southern China,Nanjing Agricultural University,Nanjing 210095,P.R.China
Abstract This experiment explored the effects of single application of seven types of slow-and controlled-release fertilizers on rice yield and various population characteristics. Based on a study of the nitrogen (N) release characteristics of these fertilizers,pot experiments were conducted in 2018 and 2019 with split fertilization (CK,urea applied split equally at basal and panicle initiation stages,respectively) as control,which assessed the effects on SPAD value,yield and yield components,dynamic changes of rice tillers and dry matter accumulation. The results showed that the N release characteristics of different types of slow-and controlled-release fertilizers were significantly different. Polymer-coated urea (PCU) showed a controlledrelease mode and provided sustained release throughout the whole growth stages. Sulfur-coated urea (SCU) exhibited a slow-release mode,providing insufficient release at the middle and late stages. Urease inhibitor urea (AHA) and ureaformaldehyde (UF) yielded a rapid-release mode,with an explosive N release at the early stage and no release at the middle and late stages. These results showed that PCU delayed the peak seedling stage. Compared with CK,dry matter accumulation and SPAD showed no significant differences,and due to the continuous release of N throughout the growth stages,rice yield,spikelets per panicle,seed setting rate,and 1 000-grain weight were all increased. Owing to the lack of N supply at the late stage and the low number of spikelets,SCU led to a reduction of rice yield,which is nevertheless not statistically significant. AHA and UF were susceptible to environmental factors and had varying effects on rice yield. The results of this experiment indicated that given a fixed amount of N applied in a pot,the stronger the N supply capacity and the longer the effective duration time of the fertilizer,the higher the dry matter accumulation at the late growth stage,and the higher the rice yield.
Keywords:slow-and controlled-release fertilizers,fertilizer types,rice yield,fertilizer release characteristics
1.Introduction
Agriculture is the foundation of national economy,and rice has always been dominant in the production and consumption of grains in China. By 2019,rice planting area accounted for 25.8% of the planting area of food crops in China (NBSC 2019).In developing countries,fertilizer plays an important role in increasing rice production as it is estimated that about 55% of the increase in food production comes from the effect of fertilizers (Horieet al.1999;Erismanet al.2008). Over the past several decades,conventional fertilizer application for rice,mostly divided into 3–4 applications and consisted of basal and top-dressing,is a high-demand,time-consuming and labor-intensive approach. This method might cause the loss of nutrients,which could lead to a series of environmental problems such as eutrophication and greenhouse effects (Shiet al.2012;Zhaoet al.2012;Hanet al.2014;Zhanget al.2015).
The emergence of slow-and controlled-release fertilizers(SCRF) provides a new option for more efficient fertilization of rice. Compared with urea,SCRF with regulated release of nutrients is considered an effective way to satisfy crops’nutrient demand during the whole growth stage with a single basal application (Stewartet al.2005;Chenet al.2008;Carsonet al.2014;Timilsenaet al.2015). According to production process,SCRF can be divided into three main types:coated fertilizers,stable fertilizers and chemicallysynthesized organic fertilizers (Azeemet al.2014;Timilsenaet al.2015). Coated fertilizers are formed by applying or wrapping a layer of inorganic or organic matter on the granule surface,such as sulfur-coated fertilizers (SCU) and polymer-coated fertilizers (PCU). Nutrients from SCU are released through the micropores on the coating material and the cracks that develop after the sulfur film is broken.However,the sulfur material itself is inelastic and fragile,which may cause incomplete coating or cracks. SCU are prone to“burst release”at a certain stage,with a release period of 30–90 days (Guet al.2011;Xuet al.2016). In contrast,PCU controls the release through the osmotic adjustment of semipermeable or impermeable membranes with micropores. As a result,the release will be more precise and can even be synchronized with rice absorption efficiently,if soil temperature and humidity conditions are suitable. Stable fertilizers are mainly produced by adding urease inhibitor,nitrification inhibitor or other materials that slow the release of fertilizers,such as urease inhibitor urea(AHA). Of these,urease inhibitor and nitrification inhibitor can delay fertilier release by competing with urea through a sulfhydryl reaction and inhibiting nitrification thanks to its toxicity to nitrifying bacteria,respecively (Xuet al.2001;Liet al.2009;Houet al.2014;Zhanget al.2019). The release period of stable fertilizers depends on soil conditions,and is usually short,resulting in unstable applications.The chemically-synthesized organic fertilizers mainly consist of urea-formaldehyde fertilizers produced by the polycondensation reaction of urea and formaldehyde,and act to enhance the soil microbial activity and root vitality. The most widely used urea-formaldehyde (UF) releases nutrients through microbial decomposition,affected by size,microbial activity,soil texture,and pH (Shaviv 2001).
There have been many studies on the effects of slowand controlled-release fertilizer application on rice yield (Liet al.2013;Penget al.2013;Yeet al.2013;Genget al.2015;Keet al.2018). Liet al.(2017) suggested that compared with the standard application of urea,the partial productivity under a single carbon-based slow-release urea treatment was significantly increased by 3.3–7.2%.Sunet al.(2019) showed that a single application of PCU that reduced the amount of fertilization could increase yield by 6.0–21.0% compared with the application of urea.Compared to conventional urea,increases of 8.6 and 1.2% were reported in rice yield by using PCU and SCU,respectively (Keet al.2017). Weiet al.(2018) reported that different slow-and controlled-release fertilizers showed the relative effectiveness of UF>PCU>SCU in terms of grain yield,of which the yield under UF treatment was 5.0–6.9%and 12.3–13.7% higher than that under PCU treatment and SCU treatment,respectively. The above results indicated that using slow-and controlled-release fertilizers not only reduced the total amount of fertilizer application,but also improved rice yield (Wanget al.2010,2014;Jinget al.2016).
Previous experiments have only focused on the practical application of various slow-and controlled-release fertilizers in terms of application rate,and the effects on rice yield and yield components. However,relatively few studies have compared the effects of different types of slow-and controlled-release fertilizers on rice yield,and there is a lack of research on the characteristics of fertilizer nutrient release and crop absorption and utilization. Therefore,a pot experiment was conducted to examine the N release characteristics of seven different slow-and controlledrelease fertilizers,and their impacts on rice grain yields and yield components,in order to provide a theoretical basis for their further use.
2.Materials and methods
2.1.Experimental site and fertilizers
The experiments were conducted in 2018 and 2019 in Danyang County,Jangsu Province,China (31°54´N,119°28´E). Seven different SCRF were selected for the experiment,including polymer-coated urea (PCU1,PCU2 and PCU3),sulfur-coated urea (SCU1 and SCU2),urease inhibitor urea (AHA),and urea-formaldehyde (UF). The names,sources,N contents,and characteristics of the fertilizers are shown in Table 1. Furthermore,PCU1,PCU2,PCU3,SCU1,and SCU2 were all wrapped in organic or inorganic material on their surfaces,with a difference in the thickness of coating material. The thicker the coating,the longer the release period. The release periods of PCU1,PCU2,PCU3,SCU1,and SCU2 are 60,90,120,60,and 90 days,respectively.
2.2.Experimental design
The experiment was conducted in pots with an inner diameter of 34 cm and a height of 35 cm. The pots were filled with soil up to 25 cm height and of 15 kg weight. Local paddy soil was used to fill the pots,which contained 1.12 g N kg–1,0.47 g P kg–1and 1.95 g K kg–1. Before transplanting,the pots were filled with water and the soil was mixed thoroughly to make it homogeneous. Seeds were sown on 18 May 2018 and 27 May 2019,and seedlings were transplanted on 6 June 2018 and 15 June 2019. Each pot contained three hills with three seedlings per hill. Slow-and controlledrelease fertilizer treatments were applied at a rate of 2.0 g N once,and P and K were applied as a basal application at rates of 1.0 g (P2O5) and 1.6 g (K2O) per pot,respectively.Urea as the control treatment (CK) was applied split equally at basal stage and panicle initiation stage,respectively.Crop management was consistent with local management practices for conventional and high-yield cultivation.
2.3.Sampling and analysis
N release characteristics of slow-and controlled-release fertilizersN release from slow-and controlled-release fertilizers was studied in field and laboratory.
(1) In field:A soil embedding method was used to investigate N release from the applied fertilizers. The fertilizer weighed (10±0.01) g was placed into a nylon mesh bag (12 cm×8 cm) with a hole diameter of 1.0 mm,strung onto a line and then buried in field. The bags were buried 5–8 cm below the soil surface. Three bags were sampled each time at 10,20,30,40,50 (panicle initiation stage),80 (heading stage),and 120 days (maturity stage) after incubation. Samples collected were washed with distilled water to remove impurities and were placed in an oven for drying at 30°C until constant weight.They were then weighed and the N loss was calculated.
(2) In laboratory:The hydrostatic dissolution rate method was adopted in a laboratory setting to study N release from the applied fertilizers. The fertilizer weighed (10±0.01) g was placed into a nylon mesh bag (12 cm×8 cm) with a hole diameter of 1.0 mm. The bags were placed in a 300-mL plastic bottle with a lid. The bottle was filled with 250 mL distilled water and maintained at a constant temperature of 25°C in an incubator. Three bottles of water samples were collected each time at 1,3,5,10,20,30,40,50 (panicle initiation stage),80 (heading stage),and 120 days (maturity stage) after incubation in water. These bags were washed several times with the same amount of distilled water,then also collected the water. The NO3--N and NH4+-N concentrations of the water samples were determined using a continuous flow analyzer (Model AA3,Bran-Luebbe,Hamburg,Germany).
Plant sampling and analysisDuring the growth period,five pots of rice with the same growth status were selected for each treatment to investigate the dynamic changes of tillers.The top 3rd leaf is typically considered as very sensitive to soil N supply,and its SPAD value is most relevant to N content in rice (Liet al.2005). Therefore,five pots with the same growth status were selected for each treatment,and the chlorophyll meter SPAD-502 (Minolta,Japan) was used to determine the relative chlorophyll content (SPAD) of the top 3rd leaf of the main stem. SPAD values were measured three times at the upper,middle and lower positions and the average value was calculated. Three pots with the same growth status were selected for each treatment at 10,20,30,40,55 (panicle initiation stage),80 (heading stage),and 120 days (maturity stage) after transplanting. Stems(culms+sheaths),leaves and panicles were separated and oven-dried at 105°C for 30 min,followed by drying at 80°C to a constant weight,and dry matter weight was then measured.
Three pots were selected by considering the average panicles at maturity stage to investigate yield and yield components,such as panicles,spikelets per panicle,seed setting rate,and 1 000-grain weight.
2.4.Statistical analysis
Microsoft Excel 2016 Software was used to organize the data. Origin 2018 was used to construct the graphs. Datawere analyzed statistically using SPSS 21.0 Software,and means of the treatments were compared by the least significant difference (LSD) test at the 0.05 probability level.

Table 1 Name and nitrogen content of slow-and controlled-release fertilizers
3.Results
3.1.Release characteristics
Significant differences were observed in the N release characteristics of different slow-and controlled-release fertilizers both in soil and water (Fig.1). By 20 days after incubation,the N release rates of PCU1,PCU2 and PCU3(Fig.1-A–C,E–G) were 30.3–59.6%,18.0–37.3% and 16.0–18.1%,respectively. PCU showed a trend of partial release at the early stage and sustained release at the later stage. Its peak of N release appeared at 20–80 days after incubation. The overall release characteristic of PCU presented a controlled-release mode. The N release rate of SCU (Fig.1-I and J) reached 60–70% by 40 days after incubation,showing that most of the release was at the early stage. An overall slow-release mode was observed. More than 85% of the N releases of AHA (Fig.1-D and H) and UF (Fig.1-K) were observed at the early stage,showing an explosive release at the early stage and no release at the late stage. This presented a rapid-release mode. The relative N release periods of the three controlled-release fertilizers were PCU1<PCU2<PCU3. The nutrient release rates of the slow-release fertilizers SCU1 and SCU2 by 120 days after incubation were 75.0–77.1% and 70.0–72.1%,respectively. The release period of SCU2 was longer than that of SCU1. There was no significant difference between two rapid-release fertilizers AHA and UF. The N release rate of fertilizer in soil conditions was faster than that in water conditions (25°C) for both years. No significant differences were seen in N release rates of the rapid-release fertilizers between the two different conditions,but the controlled-and slow-release fertilizers were greatly affected by environment. In 25°C water,the N release rate of PCU and SCU by day 80 reached 63.9–73.4% and 57.1–61.7%,and about 82.6 and 69.3% of which were observed in soil conditions,respectively.
3.2.SPAD value
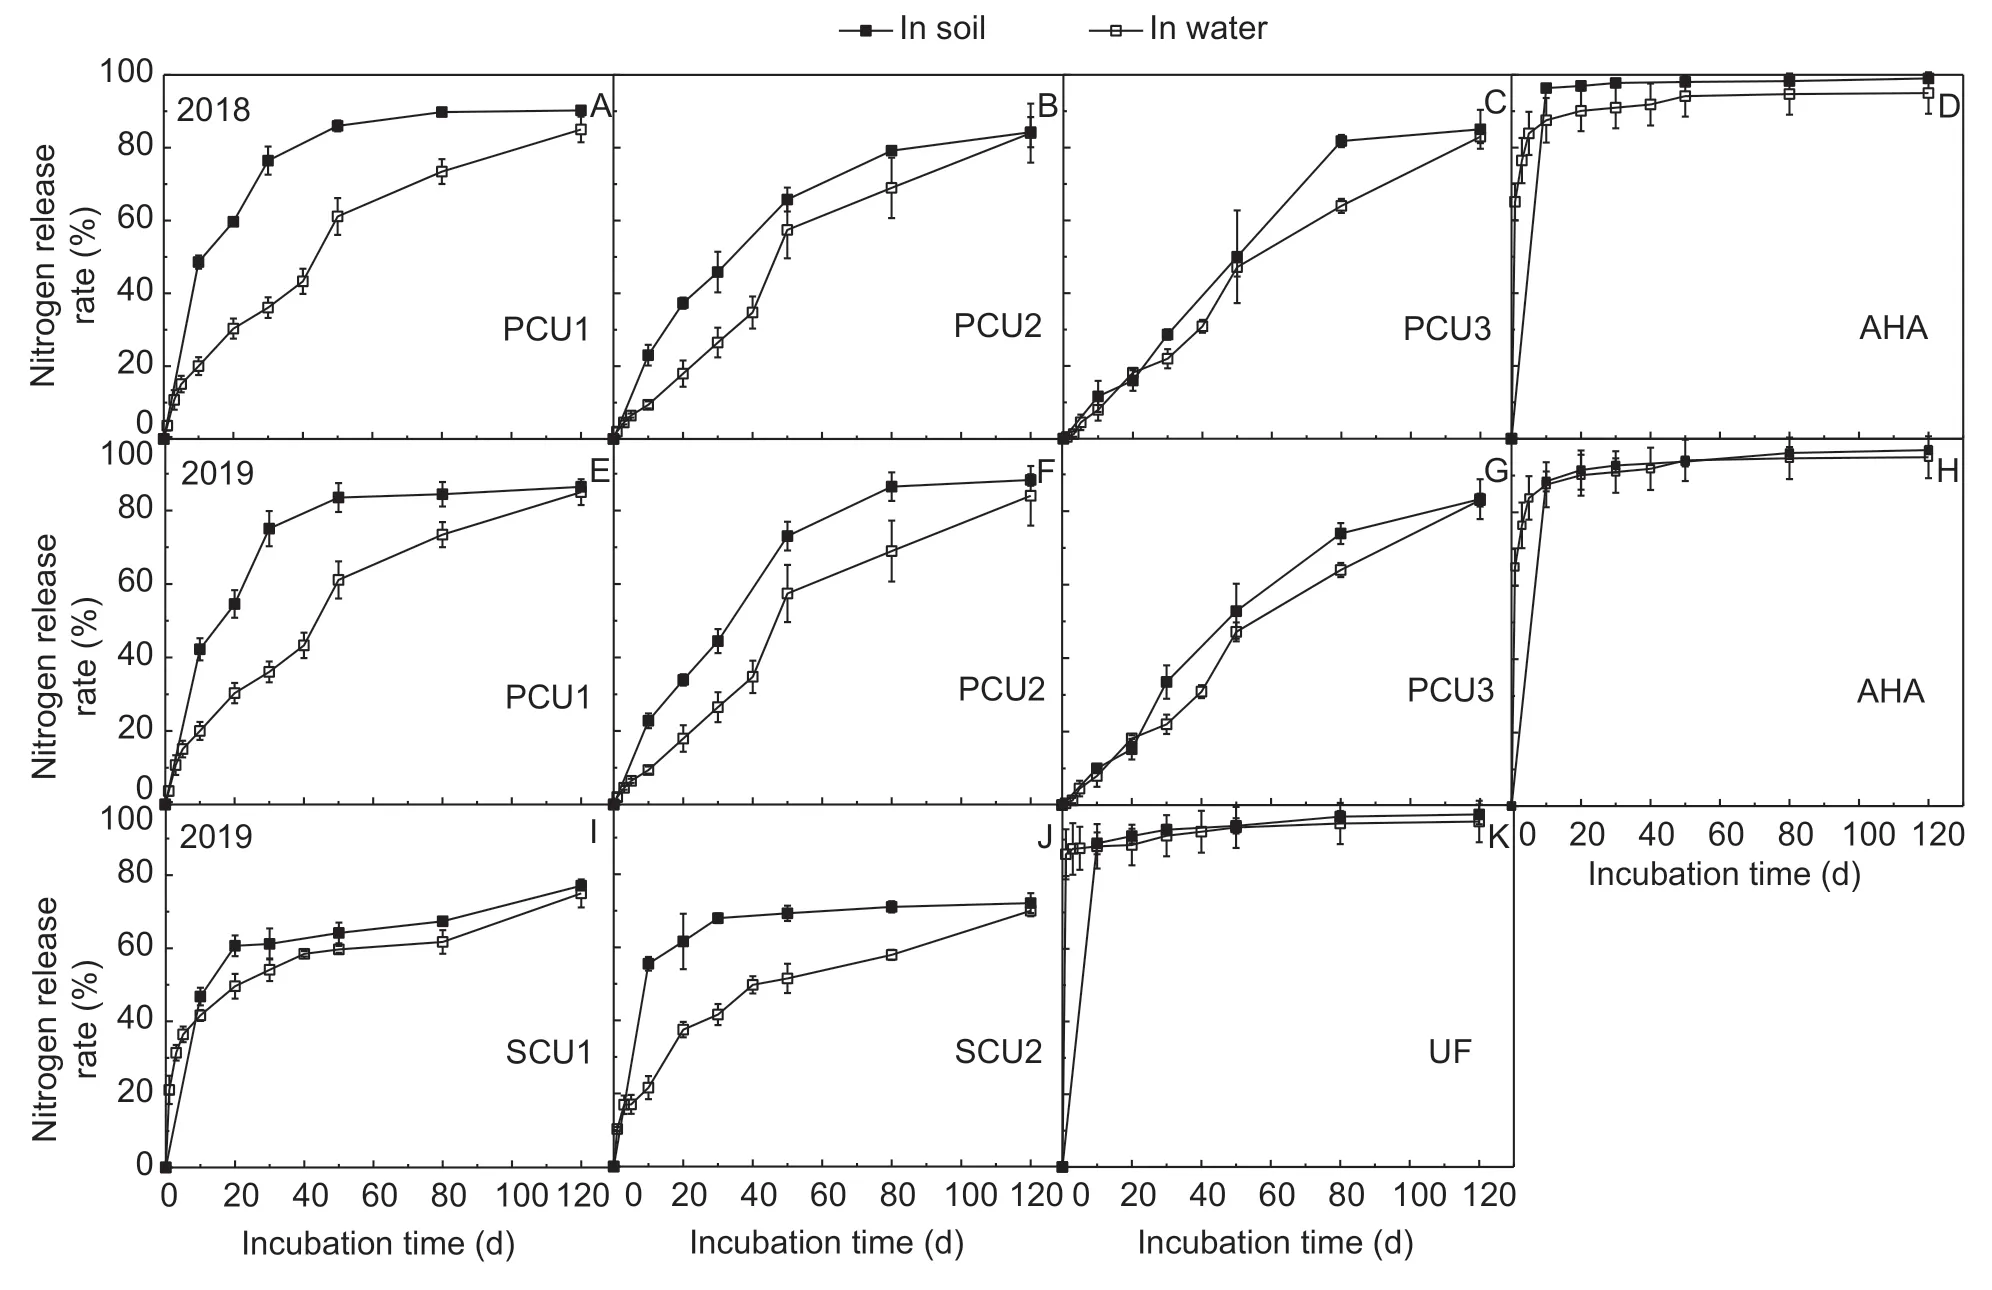
Fig.1 Nitrogen release rates of different slow-and controlled-release fertilizers in soil and water (%). PCU1,PCU2 and PCU3,polymer-coated urea with 60,90 and 120 days releasing periods,respectively;AHA,urease inhibitors urea;SCU1 and SCU2,sulfur-coated urea with 60 and 90 days releasing periods,respectively;UF,urea-formaldehyde. Vertical bars indicate mean standard errors of three replicates.
The SPAD values of rice with different types of slow-and controlled-release fertilizer treatments varied significantly across growth stages (Fig.2). Overall,the SPAD values of rice treated with rapid-release fertilizers (Fig.2-D,H and K) and slow-release fertilizers (Fig.2-I and J) generally decreased steadily during the growth stages,and those under controlled-release fertilizers (Fig.2-A–C,E–G) picked up slightly at the heading stage. Under the CK treatment,SPAD value fluctuated significantly,and there was an obvious increasing trend at the heading stage. The SPAD values of rice leaves under slow-and controlled-release fertilizer treatments were significantly higher than those under CK at the tillering stage,but lower than CK after panicle initiation stage,especially in 2018. Comparing the three types,at 30 days after transplanting,the SPAD values under AHA and UF treatments were significantly higher than those under SCU and PCU,shown as a relative sequence of AHA=UF>SCU>PCU. Then,until panicle initiation stage,the SPAD values decreased under the AHA and UF treatments,but increased under the PCU treatment.The relative SPAD values at the panicle initiation stage were as follows:AHA=UF>PCU>SCU. The SPAD values under the AHA and UF treatments continued to decrease until heading stage. Since PCU continued to release N whereas the releases from AHA,UF and SCU were insufficient at the late stage,the relative SPAD values were as follows:PCU>AHA=UF>SCU.
3.3.Rice yield and yield components
Different types of slow-and controlled-release fertilizers had a significant effect on rice yield (Tables 2 and 3). Compared with CK,controlled-release fertilizers could significantly increase rice yield,while slow-release fertilizers could slightly reduce the yield. The yields under PCU in 2018 and 2019 were 108.1 and 114.1 g/pot,respectively,which were higher than those under SCU,AHA and UF. The yield under PCU1 was lower than that under PCU2 and PCU3,due to lower spikelets per panicle. Analysis of yield components found that the number of pikelets per panicle under PCU was significantly higher than that under CK. Given that there was no significant difference in other components,the yield under PCU was significantly higher than that under CK. The yield under SCU was significantly lower than that under CK because the panicles and total spikelets under SCU were reduced depite there was no significant difference in spikelets per panicle and seed setting rate between SCU and CK. The panicles,total spikelets and 1 000-grain weight under UF were significantly higher than those under CK. Therefore,the rice yield under UF was still higher than that under CK,though UF showed a significantly lower seed setting rate than CK. The effects of AHA on rice yield were different between two years. The experiment in 2018 showed that AHA had a significantly lower number of total spikelets than CK,which led to a reduction in yield,despite that the 1 000-grain weight under AHA was higher than that under CK. The number of panicles under AHA in 2019 was significantly higher than that under CK. This increased the total spikelets to compensate for the adverse impact of lower seed setting rate,which ultimately increased rice yield.
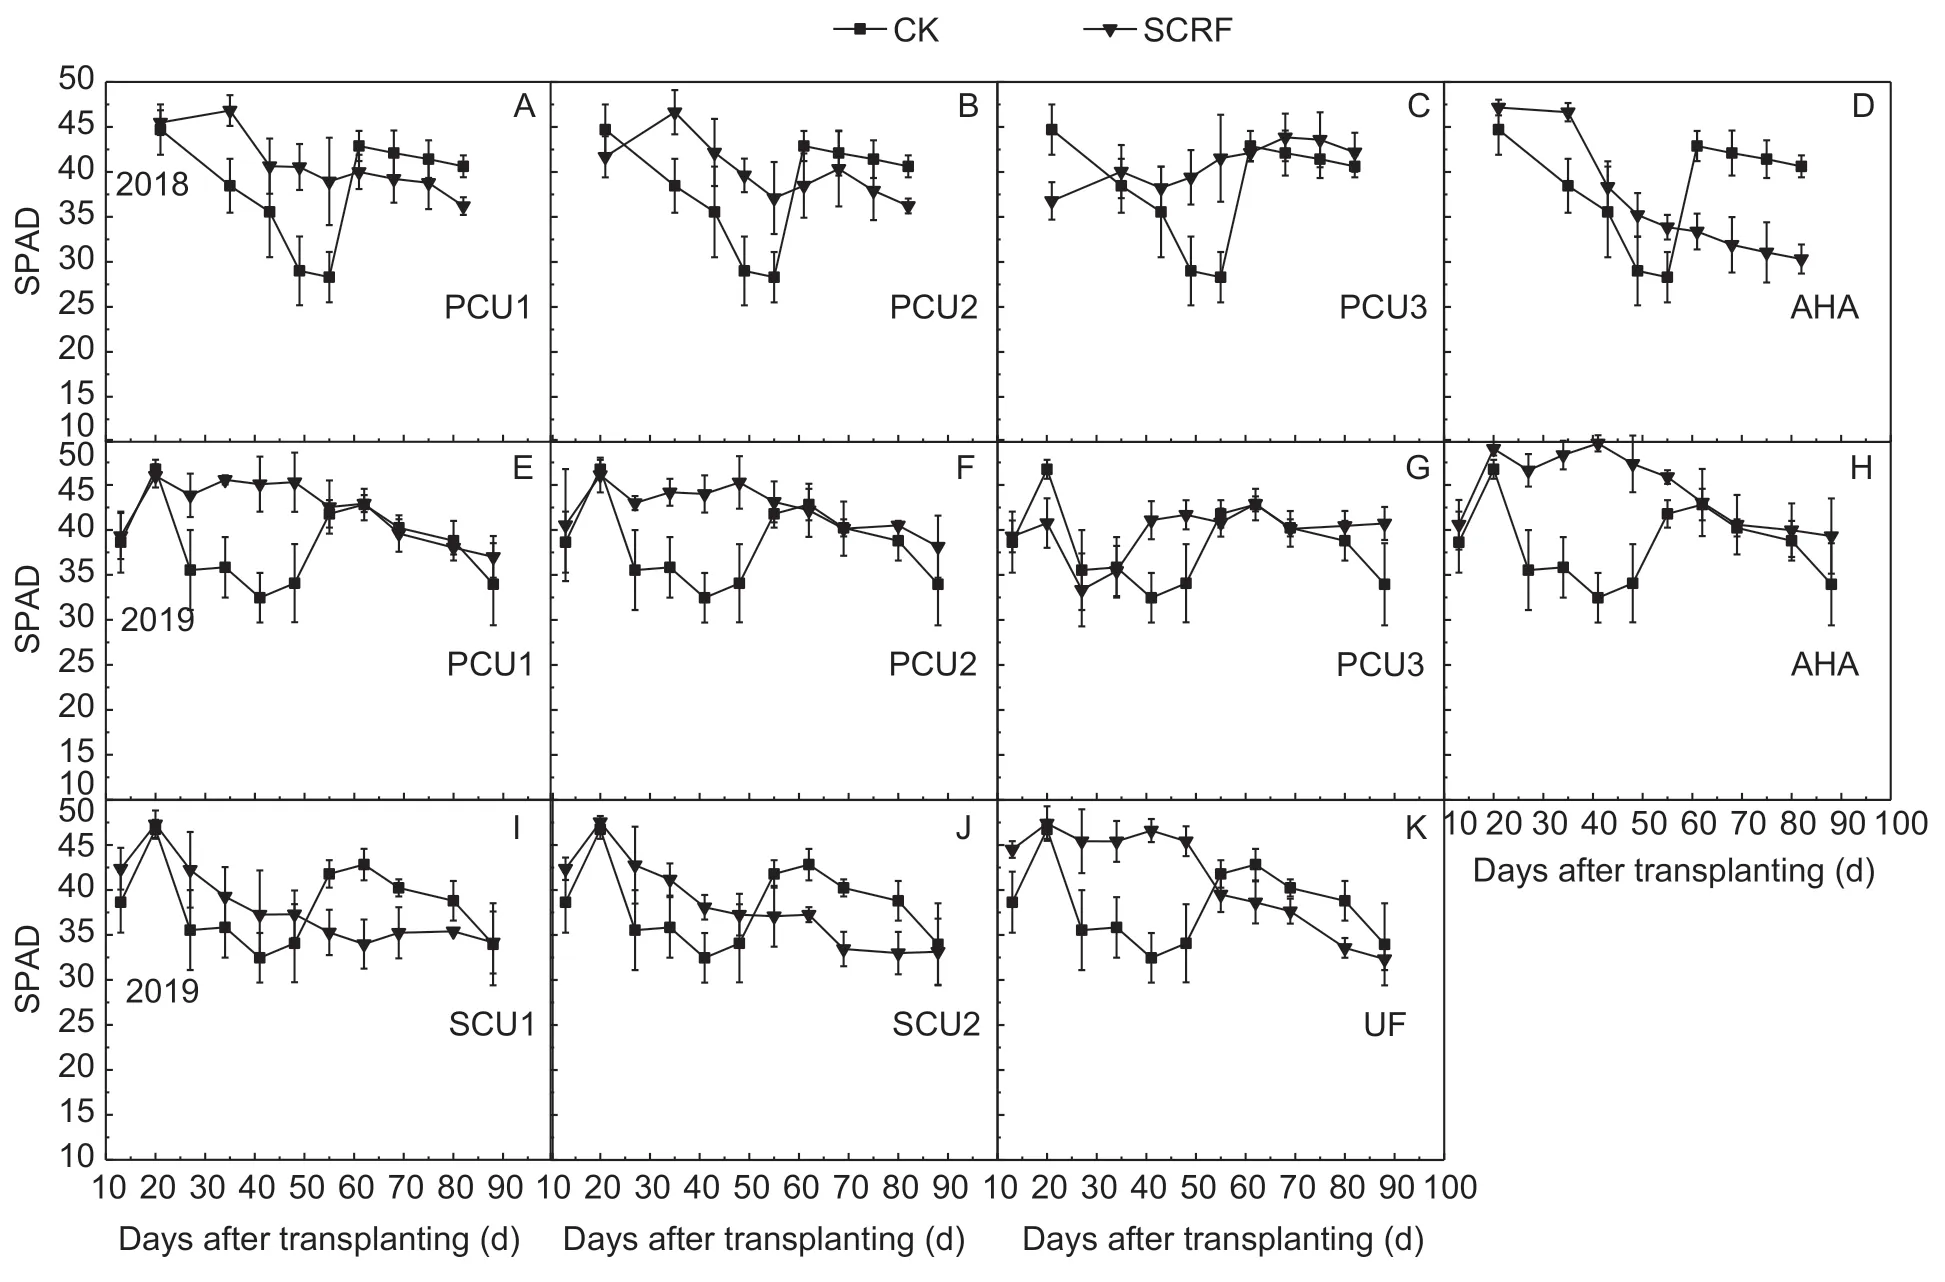
Fig.2 Dynamic changes of SPAD values of the top 3rd leaf of rice subjected to different slow-and controlled-release fertilizers.CK,urea as control;SCRF,slow-and controlled-release fertilizers. PCU1,PCU2 and PCU3,polymer-coated urea with 60,90 and 120 days releasing periods,respectively;AHA,urease inhibitors urea;SCU1 and SCU2,sulfur-coated urea with 60 and 90 days releasing periods,respectively;UF,urea-formaldehyde. Vertical bars indicate mean standard errors of three replicates.

Table 2 Effects of different fertilizer treatments on rice yield and yield components in 2018
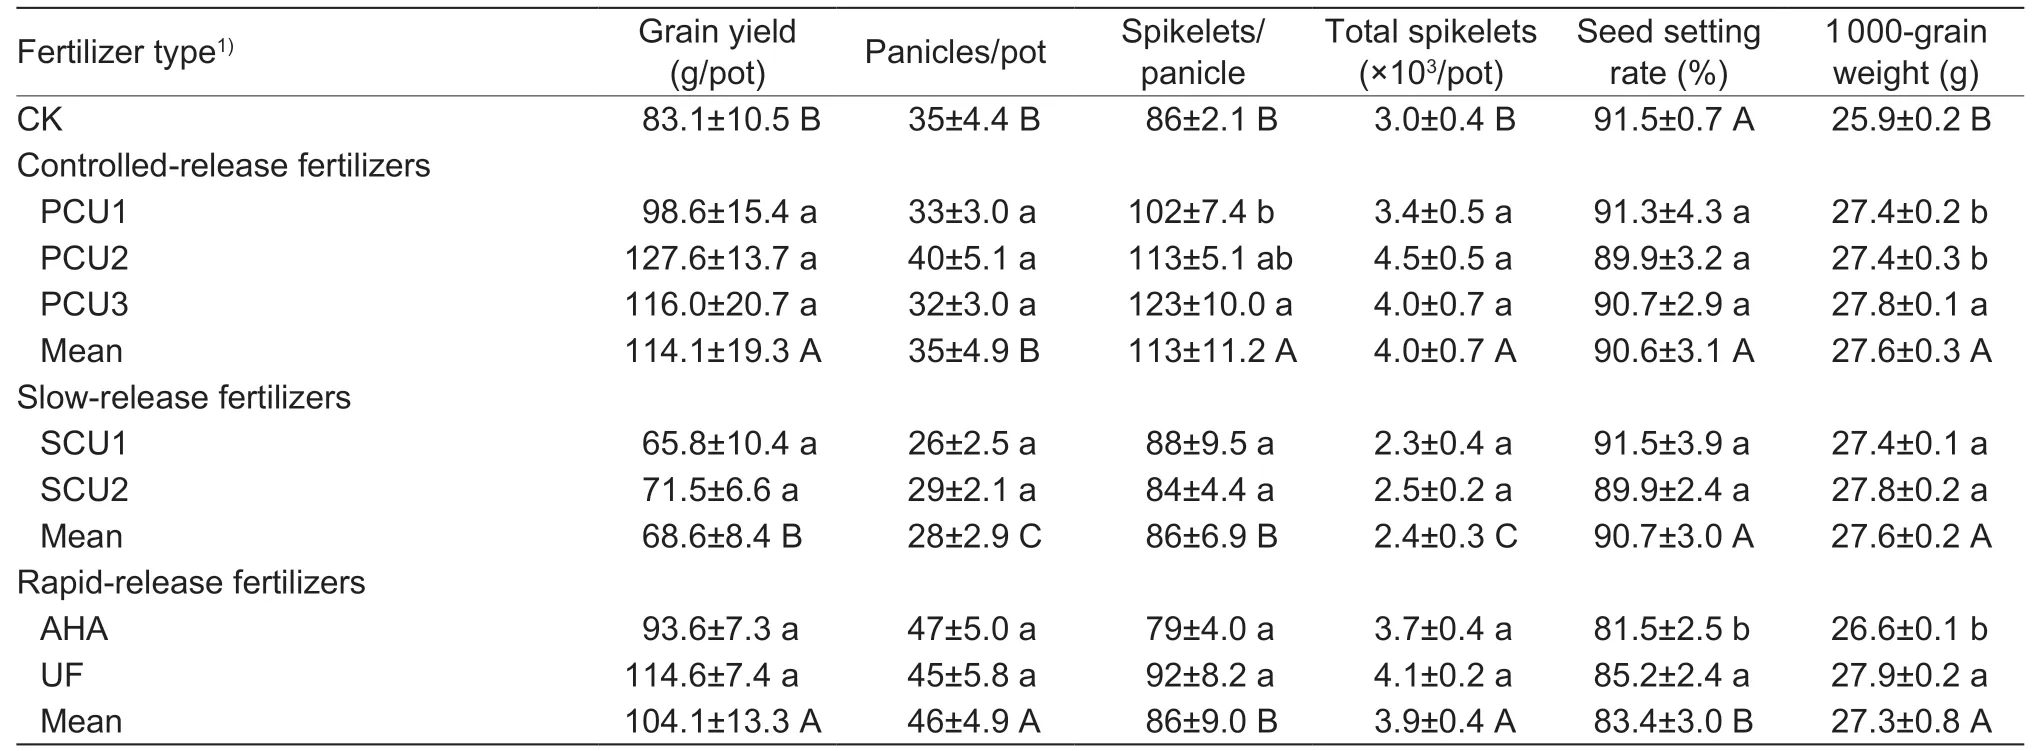
Table 3 Effects of different fertilizer treatments on rice yield and yield components in 2019
3.4.Dynamic changes of rice tillers
Different types of slow-and controlled-release fertilizers significantly affected rice tillers at different stages (Fig.3).Overall,dynamic changes of the tillers under SCU (Fig.3-I and J) were basically consistent with those under CK,while those under PCU (Fig.3-A–C,E–G),AHA (Fig.3-D and H) and UF (Fig.3-K) showed significant differences with those under CK.
Compared with CK,PCU increased slowly at 20 days after transplantation,especially PCU3 (Fig.3-C and G). This might be due to the slow release of N at the early stage from PCU,thus inhibiting the occurrence of tillering in rice. Then,the tillers of PCU1 and PCU2 increased rapidly at the middle stage,while the tillers of PCU3 still occurred slowly,which might be caused by the delayed release of N from PCU3 compared with PCU1 and PCU2. Compared with those under CK,the tillers under PCU1 and PCU2 were significantly higher,while those under PCU3 had no significant difference,after heading stage,especially in 2019. In addition,PCU significantly delayed peak seedling stage,which might be related to its high N release at this stage.
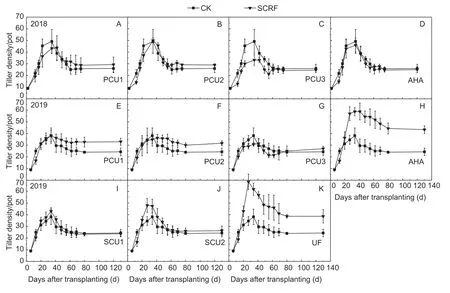
Fig.3 Dynamic changes of rice tillers in plants subjected to different slow-and controlled-release fertilizers. CK,urea as control;SCRF,slow-and controlled-release fertilizers. PCU1,PCU2 and PCU3,polymer-coated urea with 60,90 and 120 days releasing periods,respectively;AHA,urease inhibitors urea;SCU1 and SCU2,sulfur-coated urea with 60 and 90 days releasing periods,respectively;UF,urea-formaldehyde. Vertical bars indicate mean standard errors of three replicates.
In general,the dynamic changes of rice tillers under PCU included:slow occurrence of the tillers at the early and middle stages,significiant increase in the tillers at the later stage,and delayed peak seedling stage. Following the first 20 days after transplanting,the dynamic changes of rice tillers under AHA (Fig.3-D and H) and UF (Fig.3-K)were the same as those under CK. After that,tillers occurred rapidly under AHA and UF and were noticeably higher than those under CK at the panicle initiation stage.
3.5.Dry matter accumulation
Different types of slow-and controlled-release fertilizers affected dry matter accumulation remarkably at the main rice growth stages (Tables 4 and 5). Compared with CK,the application of slow-and controlled-release fertilizers significantly increased dry matter accumulation. Slowrelease fertilizers had the highest level of dry matter accumulation at the tillering stage,followed by rapidrelease fertilizers,while controlled-release fertilizers had the lowest level. However,the relative level of dry matter accumulation at the panicle initiation stage was rapidrelease fertilizers>slow-release fertilizers>controlled-release fertilizers. From panicle initiation to maturity stage,the dry matter accumulation under controlled-release fertilizers gradually increased,and even exceeded that under rapidrelease fertilizers for both years.
In 2018,from transplanting to panicle initiation stage,the dry matter accumulation under PCU3 in controlledrelease fertilizers was significantly lower than those under PCU1 and PCU2,with little difference at the later stage.In 2019,there were no significant differences in the dry matter accumulation under PCU1,PCU2 and PCU3 during the whole growth stage. The dry matter accumulation of slow-release and rapid-release fertilizers had no significant differences for both years.
4.Discussion
4.1.N release characteristics of slow-and controlledrelease fertilizers,and nitrogen uptake of rice
The N release characteristics of different types of slowand controlled-release fertilizers showed large differences(Fig.1). These differences were mainly related to the outer material of the fertilizer particles and the formulations of the fertilizers. At the same time,the N releasing ability of the fertilizers was susceptible to soil moisture,bulk density and microbial activity (Raban and Shaviv 1995;Xueet al.2013;Naz and Sulaiman 2016). Studies have shown that the release of N from UF depends on the decomposition by microorganisms. Urease inhibitor urea delayed the hydrolysis of urea to ammonium N by inhibiting the activity of urease,thereby slowing the release of N. However,the effect was unstable as it was susceptible to soil properties and external conditions (temperature,humidity,etc.)(Zhanget al.2019). SCU could not meet the N absorption requirement at the late stage of crop growth as its sulfur coating was easily broken. Quality of sulfur coating and outer sealing material would also affect the release period of SCU (Guet al.2011). At the same time,previous studies reported that PCU controlled the release process in membrane through the osmotic adjustment effect of polymer coating,where the release of N was controllable,and the duration was long (Azeemet al.2014;Xinget al.2015;Miaoet al.2016;Keet al.2017). Our experiment reached similar conclusions. The N release rates (Fig.1-D,H and K) of AHA and UF at the early stage after transplanting reached more than 80%,and no N release was observed thereafter,showing that the slow-release effect had not been achieved.But from tillering to heading stage,the rice tillers (Fig.3-H and K) and dry matter accumulation (Table 5) under AHA and UF were significantly higher than those under CK,thus showing that the effective N supply under AHA and UF stillexisted at the middle and late stages. The N release rate(Fig.1-I and J) of SCU at the early stage after transplanting was about 40%,while reached to about 60% by 50 days after incubation. The tillers (Fig.3-I and J) under SCU were not significantly different from those under CK,which satisfied the N requirement before panicle initiation stage.However,SCU demonstrated an insufficient ability to supply N from panicle initiation to maturity stage,which affected the reproductive growth of rice. The initial N release of PCU was slower than that of SCU. The N release rates of PCU1,PCU2 and PCU3 (Fig.1-A and E,B and F,C and G) reached up to 40% at 10,20 and 50 days,respectively.PCU exhibited different rates of N release across the growth stages of rice. The effective duration time of the three PCUs showed a sequence of:PCU1<PCU2<PCU3. From this point of view,in the pot experiment,the N release periods of AHA and UF were different from thier effective duration times,with the former being shorter than the latter. The N release periods of SCU and PCU were synchronized with their effective duration times. This might be because the N released by either AHA or UF at the early stage was not absorbed and utilized by rice,so most of it was fixed in soil by microorganisms. When the soil N supply was inadequate at the middle and late stages,NH4+and NO3–stored in soil were released again,which prolonged the effective duration times(Qiuet al.2007;Niet al.2014). On the other hand,SCU and PCU are coated fertilizers. Nutrients concentrate in the core of these fertilizers and exchange between the inside and outside through the coating material. In this regard,there is no process for storing N in soil before releasing it.

Table 4 Effects of different fertilizer treatments on dry matter accumulation of rice in 2018
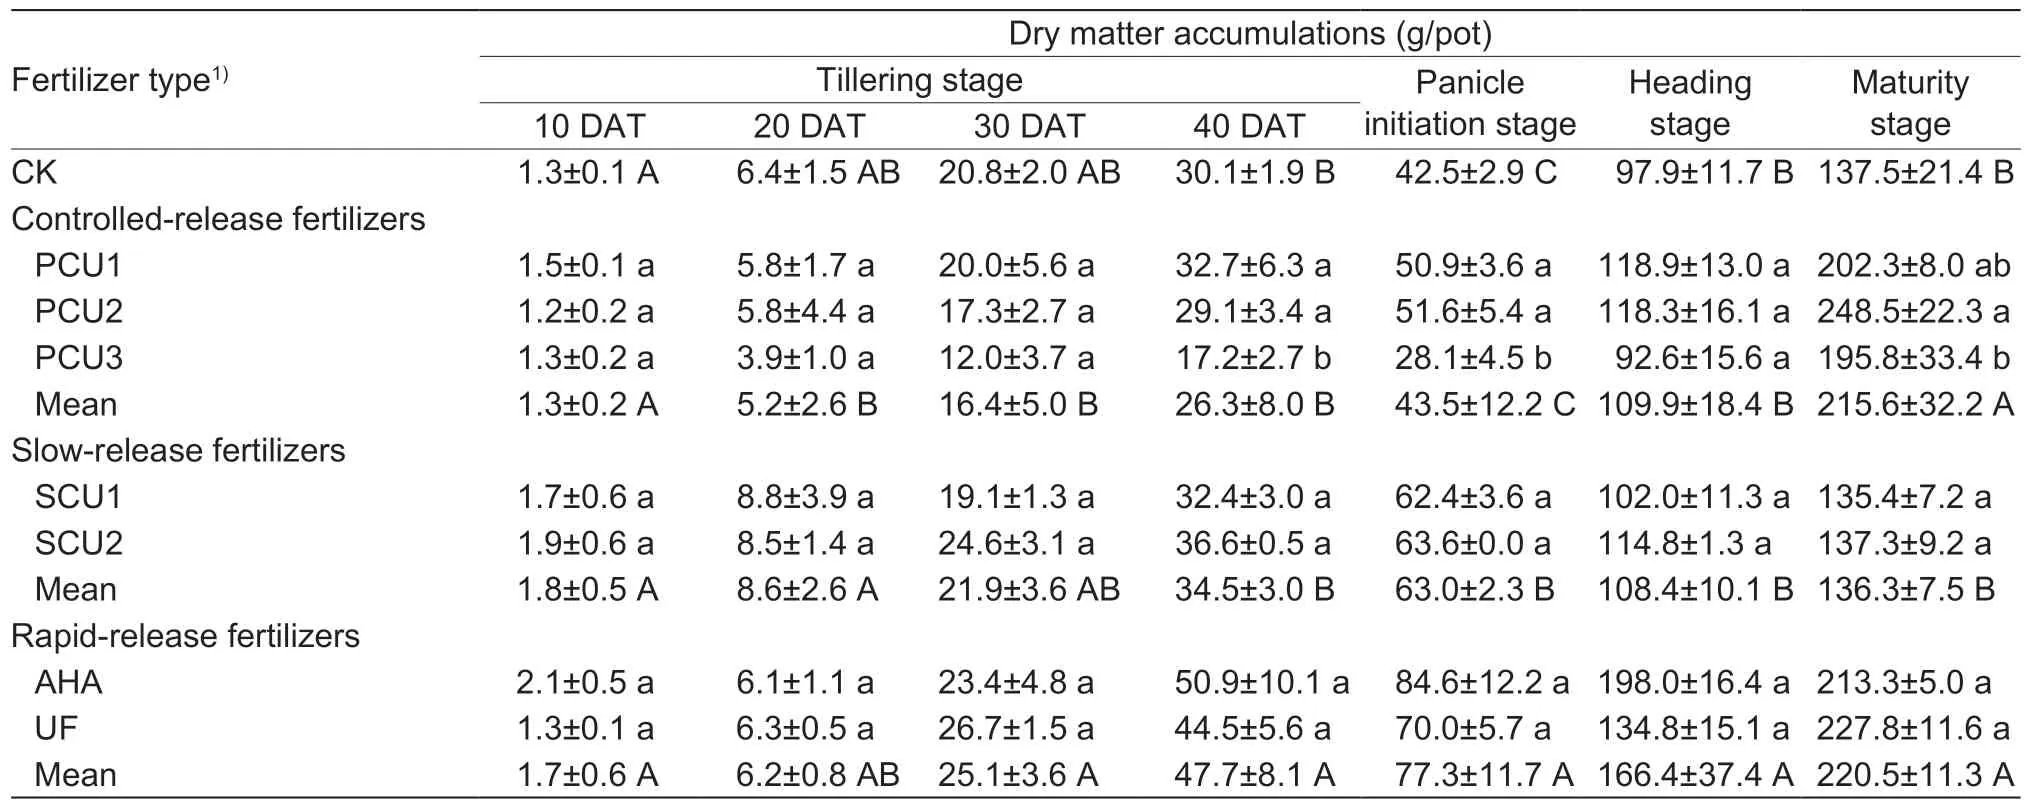
Table 5 Effects of different fertilizer treatments on dry matter accumulation of rice in 2019
The N release characteristics of different types of slowand controlled-release fertilizers also significantly affected the SPAD value of leaves (Fig.2). Leaves are the most important photosynthetic organs,and leaf color is a sensitive indicator of crop growth,metabolism and nutritional status.In particular,changes in the N nutrition of rice leaves have significant effects on leaf color (Wanget al.2002a,b;Xueet al.2003). Leaf color is an important diagnostic measure for seedlings. Leaf color changes are caused by changes in N uptake by root system (Linget al.2005;Zhaoet al.2006).Studies have found that the leaf color of high-yielding rice should be ‘two yellows and two blacks’,referring to yellow leaf color at ineffective tillering and heading stages and darker color at tillering and panicle initiation stages,which was conducive to high and stable rice yield (Linget al.1994).In our pot experiment,the SPAD values under the three types of slow-and controlled-release fertilizers at the tillering stage were significantly higher than those under CK,which met the N requirements at tillering stage. From ineffective tillering to panicle initiation stage,AHA and UF continued to supply N,and maintained SPAD values (Fig.2-D,H and K)at a high level that were significantly higher than CK,and exhibited no occurrence of leaf yellowing. However,SCU provided insufficient N supply during the same stages,the SPAD value (Fig.2-I and J) showed a downward trend,and the leaves were yellow and suppressed the occurrence of invalid tillers,which was beneficial to the growth of thick and strong panicles. From panicle initiation to heading stage,PCU showed a slight increase in SPAD value (Fig.2-A–C,E–G). However,this fertilizer’s N supply capacity was limited,and its SPAD value continued to decline,which was not conducive to panicle development. The differences between AHA/UF and CK were smaller than those between SCU and CK. Studies have suggested that an appropriate supply of N at the tillering stage is conducive to early and rapid growth of tillers,which in turn increases tillering rate and percentage of effective tillers. A sufficient N supply from jointing to heading stage is conducive to the development of glumous flowers and large spikes (Huet al.2014). From the perspective of rice growth and development,the N release and effective duration times of slow-and controlledrelease fertilizers must be in line with the requirements of rice. The results of this experiment indicated that relative effective duration times of fertilizers were as follows:PCU>AHA=UF>SCU. Of the four,the later-stage N supply capacity of PCU,AHA and UF are more conducive to the growth and development of rice.
4.2.Effects of different types of slow-and controlledrelease fertilizers on rice yield and yield components
Rice yield is determined by panicles,spikelets per panicle,seed setting rate,and 1 000-grain weight,and also shaped by dry matter accumulation,distribution,transportation and transformation of plant population (Weiet al.2007).Similarly,increasing total spikelets in the population (effective panicle×spikelets per panicle) and maintaining a stable seed setting rate and 1 000-grain weight are important ways to promote rice yield (Linget al.1993;Zhanget al.2010b;Liet al.2013). The SOI model,referring to stabilization,optimization and intensification during the early,middle and late phase correspondingly,adopts the ratio of basal-tillering and panicle initiating fertilizer of 50:50 and applies nitrogen at a leaf age of remaining leaf primordium number of 4 or 3.This model is an important way to quantify the cultivation of super high yield. Therefore,early population formation and sufficient N supply at the later stage have important contributions towards rice yield components (Zhanget al.2010a). In our pot experiment,the different slow-and controlled-release fertilizers affected the dynamic changes of rice tillers,SPAD value of leaves,dynamic changes of dry matter accumulation,rice yield components,and grain yield.Under the N application of 2 g/pot with CK,the rice yields in two study years reached 86.2 and 83.1 g/pot,respectively.
For the dynamic changes of rice tillers,PCU (Fig.3-A–C,E–G) as a whole presented a slower occurrence of tillers than CK within 20 days after transplanting. Rice tillers also began to increase slowly after 40 days,which delayed peak seedling stage,especially in 2019. This difference might be due to PCU’s slow release of N at the early stage and continuous supply of N at the middle and late stages.Therefore,under PCU,there were lower occurrences of early tillers and ineffective tillers than under CK. There were no significant differences in N supply,tillers,SPAD value,or dry matter accumulation between CK and PCU at the panicle initiation stage. However,a previous study has shown that PCU had a negative effect on rice yield (Keet al.2017). Our experiment reached the opposite conclusion,possibly due to different experimental conditions,since the PCU treatment was prone to a lack of N at the late stage.Although the N release of PCU at the tillering stage was slower than that of CK,its long effective duration time of N release in the pot made up for this weakness. Its spikelets per panicle,seed setting rate and 1 000-grain weight at the maturity stage were higher than CK,leading to a higher final yield than CK. The PCU treatment in field often lacked nutrient,which affected panicles at the early stage. This was difficult to compensate for at the later stage due to the loss of N through runoff and the influence of field conditions.
The dynamic changes of rice tillers under SCU were consistent with those under CK (Fig.3-I and J). This indicated that N release of SCU at tillering stage was high,which effectively promoted early tiller occurrence and the formation of low-position tillers. Its dry matter accumulation at tillering stage was found to be higher than CK. However,its SPAD value after panicle initiation stage was significantly lower than CK,which indicated that the N supply of SCU was significantly lower than that of CK,and the single application could not satisfy the N demand at the later stage of rice. A previous study has shown that an appropriate increase in N supply at the heading stage was beneficial for spikelets per panicle and seed setting rate (Zhanget al.2013). The N release of SCU resulted in a small number of effective panicles at the maturity stage,which reduced total spikelets and ultimately caused a significantly lower yield than CK.
The AHA and UF (Fig.3-D,H and K) treatments exhibited slightly different dynamic changes of rice tillers in the two years. The experiments in 2019 showed that rice tillers occurred faster within 20 days after transplanting and peak seedling stage appeared earlier under AHA and UF than under CK. The peak seedling numbers obtained under AHF and UF were significantly higher than those under CK and other types of fertilizers. The SPAD value also showed the same pattern. The number of rice tillers began to decrease rapidly within 30–40 days after transplanting under AHF and UF. This might be due to their explosive N release at the early stage,making the early N supply significantly higher than that of CK and other types of fertilizers followed by an absence of N release at the late stage. Therefore,the tillering characteristics of AHF and UF could be described as:tillers occurred early,but the number of ineffective tillers was higher. However,due to the advantages of early growing,the tillers,dry matter weight and effective panicles under AHF and UF were all significantly higher than those obtained under CK and other types of fertilizers. In addition,the final yield under AHF and UF was higher than that under other types of fertilizers,and significantly higher than that under CK. However,the experiment in 2018 showed that the number of tillers under the AHA treatment was relatively small,which affected the total spikelets at maturity stage and eventually reduced the yield as compared to CK.
5.Conclusion
The fertilizers tested in these experiments were mainly divided into three types:controlled-release fertilizers,slowrelease fertilizers and rapid-release fertilizers. Relative difference in release period of the three types is shown as:controlled-release>slow-release>rapid-release;but based on SPAD values,the release period was not equal to the effective duration time,particularly as the effective duration time of rapid-release fertilizers could continue until heading stage. Rice yield increased significantly under controlledrelease fertilizers,while slow-release fertilizers had little effect on yield,and rapid-release fertilizers had varying effects on yield as they were susceptible to environmental factors. Therefore,given a fixed amount of N is applied to the pot,the stronger the N supply capacity and the longer the effective duration time of the fertilizer,the higher the dry matter accumulation at the late growth stage,and the higher the rice yield.
Acknowledgements
Funding was provided by the National Key Research and Development Program of China (22017YFD0301203,2018YFD0300803),the Jiangsu Key Research and Development Program,China (BE2017369) and the Jiangsu Agricultural Science and Technology Innovation Fund,China(CX(18)1002).
Declaration of competing interest
The authors declare that they have no conflict of interest.
杂志排行
Journal of Integrative Agriculture的其它文章
- Low glycemic index:The next target for rice production in China?
- Effect of side deep placement of nitrogen on yield and nitrogen use efficiency of single season late japonica rice
- Advancements in plant regeneration and genetic transformation of grapevine (Vitis spp.)
- Indica rice restorer lines with large sink potential exhibit improved nutrient transportation to the panicle,which enhances both yield and nitrogen-use efficiency
- Effects of nitrogen management on the ratoon crop yield and head rice yield in South USA
- Response of grain-filling rate and grain quality of mid-season indica rice to nitrogen application
