Sediment pattern &rate of bathymetric changes due to construction of breakwater extension at Nowshahr port
2021-05-21FrhdSkheeFtemehKhlili
Frhd Skhee ,,Ftemeh Khlili
a School of Engineering,Parks College of Engineering,Aviation and Technology,Saint Louis University,USA
b Saroyeh Institute of Higher Education,Civil Engineering Dept.,Mazandaran,Sari,Iran
Abstract Erosion,scour and sedimentation are the most common phenomena which should be considered in the design of marine structures.Seas and oceans are dynamic environments,hence studying them in more details,gathering more information about their bathymetric changes and pursuing their historical evolution could be beneficial in the efficient design of marine structures such as:jetties,groins and breakwaters.To achieve this goal one desperately needs to know about currents and waves and the effects of their interactions as well as the rate of sedimentation (Net Gain),and erosion (Net Loss) in the field.On the other hand,to obtain a sufficient depth to facilitate marine traffics in the harbors the rate of sediment deposition must be calculated,offering effective annual dredging programs.In this research the pool of Nowshahr port and some parts to the east and west were modeled.Sediment transport direction was compatible with the counter-clock-wise circulation of the Sothern part of Caspian Sea.Wind data,water surface elevation,and hydrographic points from the bathymetric surveys applied in the hydrodynamic module of Mike 21 and the output of the hydrodynamic module (HD) were used as inputs for sediment transport module (ST).The result of the ST module shows that the main direction considering dominant waves is from northwest of the Caspian Sea to the southeast.Also,net rate of sediment transfer is from west to east.By approaching to the main breakwater arms from the west side sediment transport rate decreases which means deposition occurs behind the western arm.
Keywords:Numerical modeling;Sediment pattern;Wave and currents;Erosion;Nowshahr port.
1.Introduction
Nowshahr port is considered as one of the most important ports of the southern part of Caspian Sea.Coastal protection structures such as breakwaters are needed to create a calm situation to facilitate marine transportation.As soon as having the breakwater installed the sedimentation begins and in a matter of decades dredging is inevitable.In this study sediment pattern of Nowshahr port was modeled and sediment transport pattern was estimated with respect to the counter clock wise circulation for southern part of Caspian Sea.Construction of the port began in year 1930 and has been opened to facilitate navigational purpose in 1939.Nowshahr is the nearest port to Tehran (Capital City,Iran) within a distance of 200 km.The bed martials of the coastal areas for the domain mainly include fine sand with few silts.Collected samples of sea bed within the domain of the modeling areas revealed that the soil type is well graded sand (SW) withd50=0.13 mm.Currents of Caspian Sea induced by winds and irregularities of the bed morphology and divided into three main branches:northern currents,central currents,and southern currents.The direction of these currents is counter clock wise which is shown in Fig.7.Nowshahr is influenced by the southern current and the direction is from west to the east.
Nowshahr is located at southern part of Caspian Sea,with the longitude of 36.39 North and Latitude of 51.28 East which is shown in Fig.1.Some specifications of the port are provided in Table1.Location of Nowshahr port including its main breakwater,bed contours as well as general plan of breakwater shown in Fig.2.Fig.3 shows Nowshahr locations based on the report of maritime organization with respect to Caspian Sea.
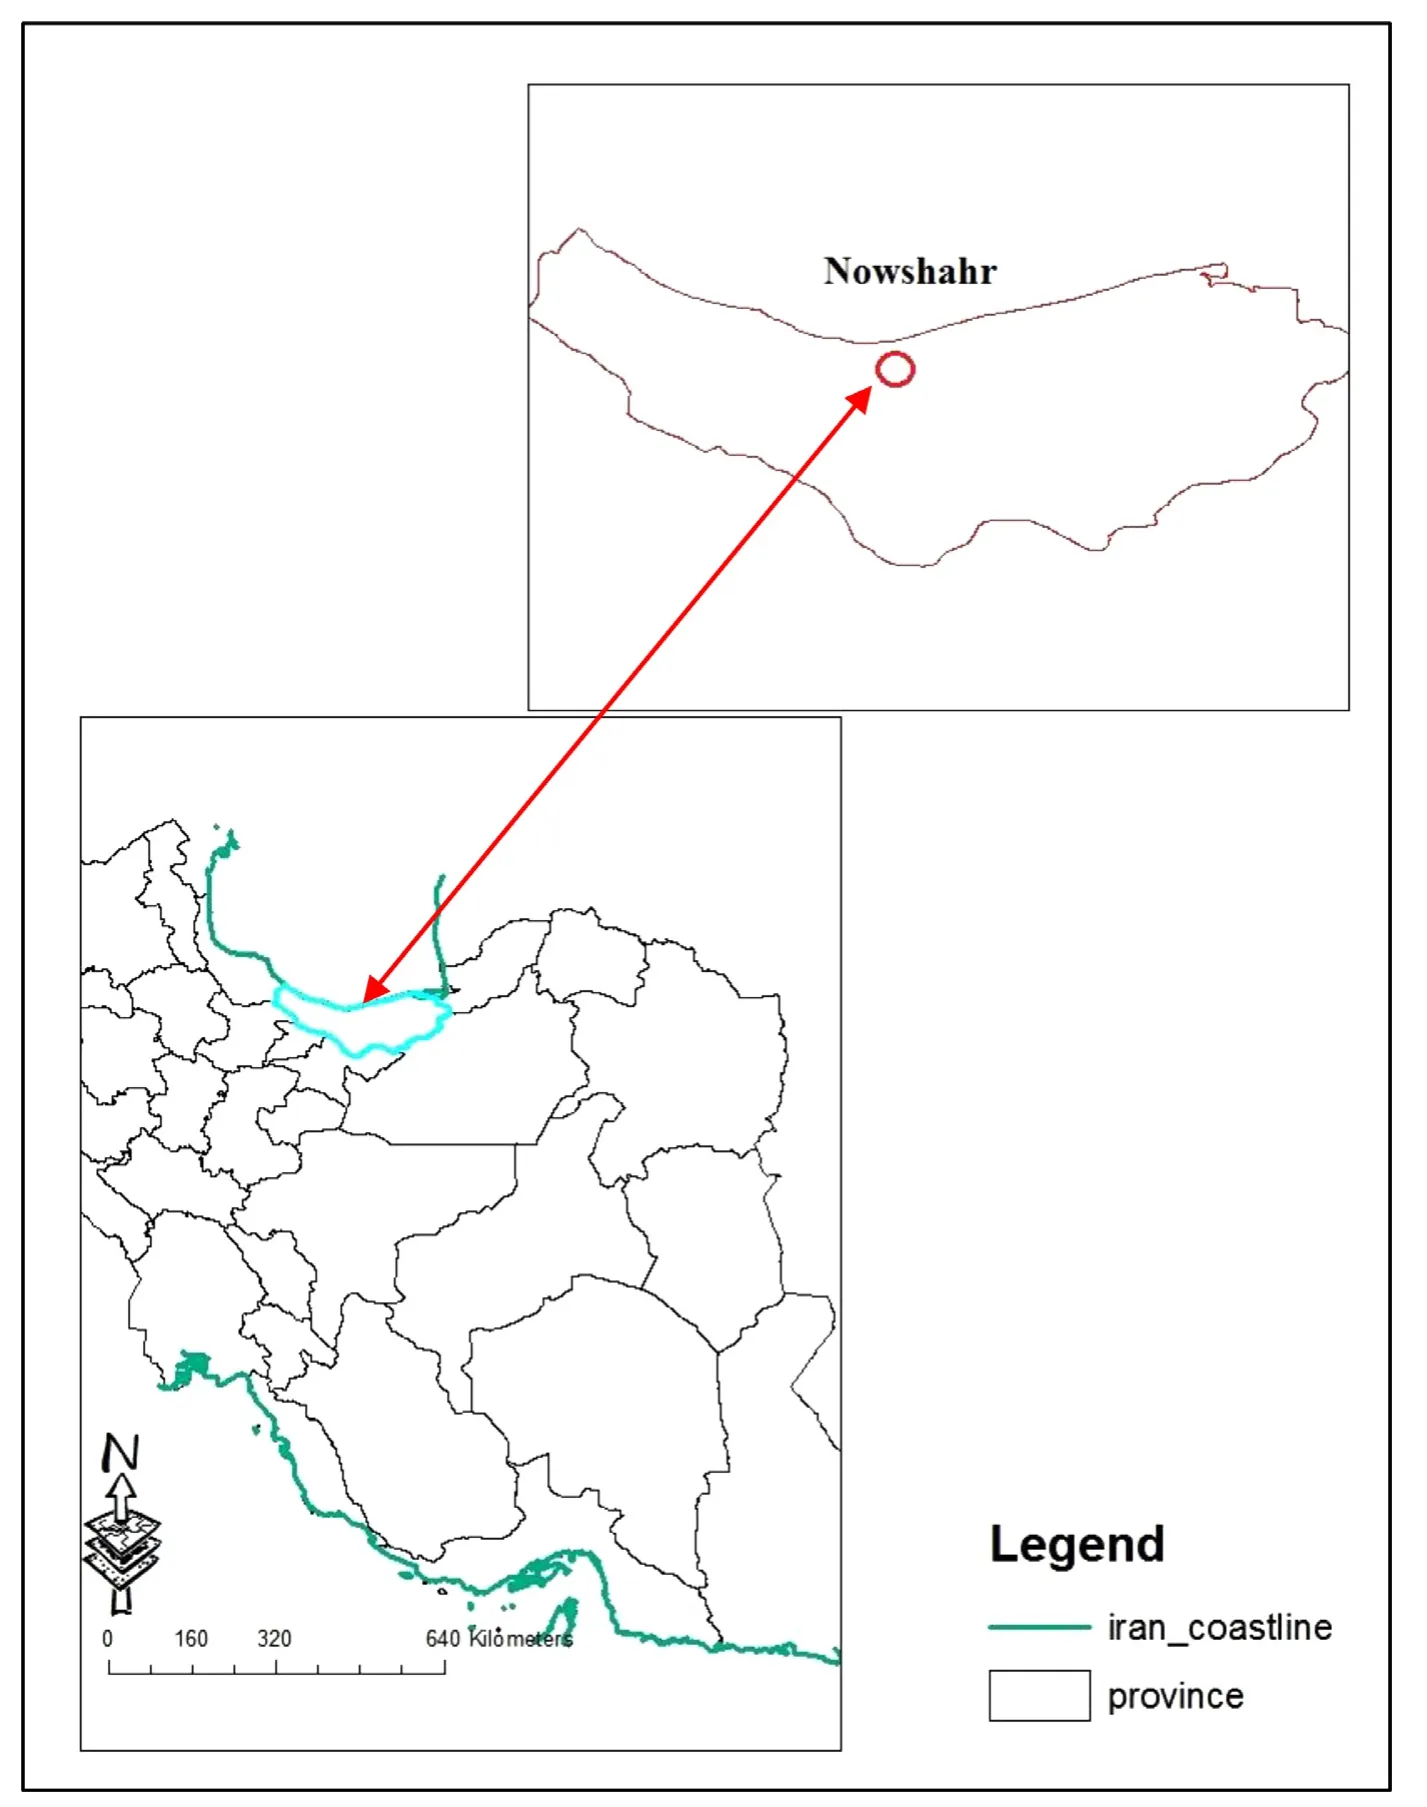
Fig.1.Location of Nowshahr port (Caspian Sea,Iran).

Table1 Nowshahr port characteristics
2.Physical characteristics of bed and sediment
2.1. Topography and hydrography
Nowshahr port is located in a flat land covered by sand.Land side of the port,slopes rapidly.The central port has an average depth of 6 m and maximum of 7.5 m.The depth of entrance channel from the sea at the central part has a depth in the range of 6–6.5 m.The configuration of bed line is parallel to the coastline but at the entrance channel there is some irregularity.
2.2. Geology and geotechnics
Based on the investigation soil of the coastal area could be categorized as below:in general,there is a depth of fine materials up to two to three meters at the eastern and western part of the port,the first 1.5 m consist of OH and gradually moves to CL.Second layer is Sandy Gravel with some cobbles and a few fine materials by a high degree of compaction and classified as a well graded gravel.The depth of this layer is almost five to seven meters.Finally,there is a silty sand layer which has a high compaction degree.The percentage of fine materials periodically changes within this layer and varies from poorly graded sand (SP) Silty sand (SM) silty sand with clay (SM-SC) and poorly graded sand with clay(SP-SM).The southern part of Caspian Sea has a high risk of earth quick due to code of 2800 Iran.

Fig.2.(a) Location of Nowshahr at South-east Caspian Sea,Iran,(b) Main breakwater,(c) Satellite images + Bed contours,(d) General plan of Nowshahr breakwater.
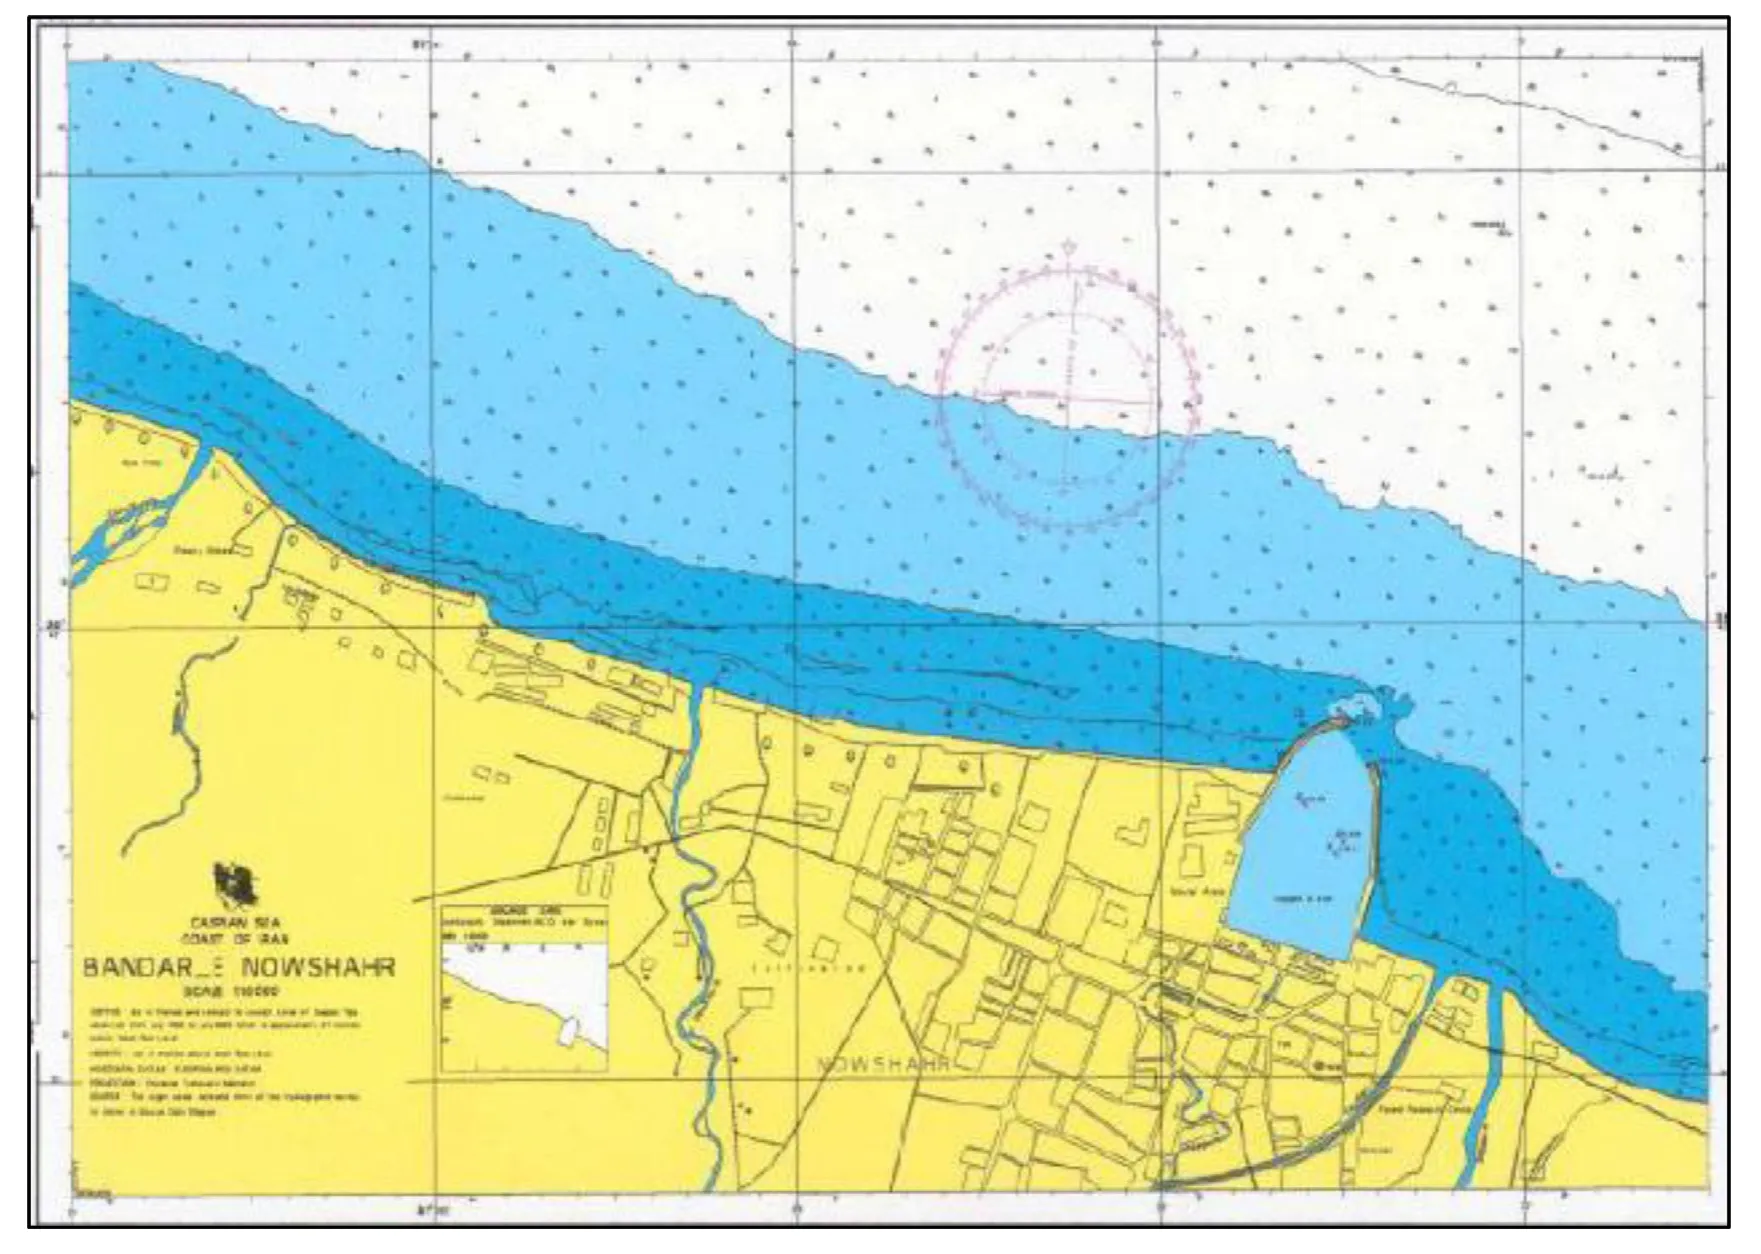
Fig.3.Location of Nowshahr port with respect to Caspian Sea (Maritime Organization).
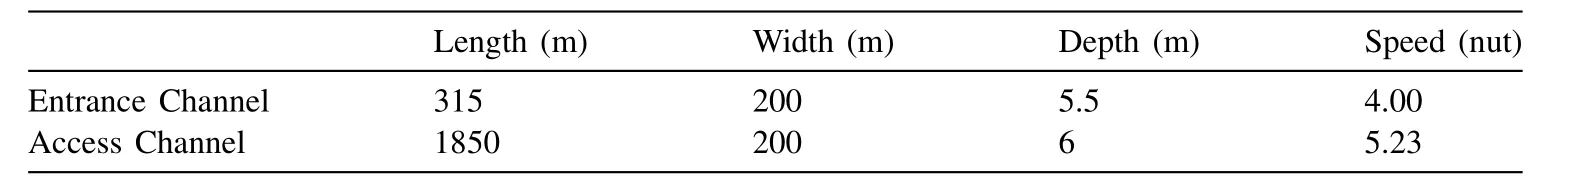
Table2 Entrance channel
2.3. Sediment and dredging
Sedimentation is the key element to determine the amount of dredging at the access channel and within the pool itself.There are two types of movement which carry the sediments.First is long shore sediment transport,second is cross shore sediment transport.The effective sediment transport direction is mainly from west and northwest to the east.Main direction is from west to east.
2.4. Channel access and anchorage area
The mean depth at the central part of the pool is about 6 m and the pool has an area of 47 hectares.The information of the entrance channel is provided in Table2.The anchorage depth reaches to 12 m and the minimum acceptable depth for ships is 5.5 m.
3.Materials and methods
There are different mathematical models which can simulate the coastal phenomena.Mike by DHI is a powerful tool amongst them which is created by Danish hydrodynamic institute.Mike 21 considered one of the most comprehensive models which can model the hydrodynamics processes,Mike 21 is based on flexible mesh approach within the coastal areas and deltas of the rivers.In this study sediment transport pattern was investigated based on the simulation of the interactions between waves and currents by applying HD and ST modules of Mike 21 simultaneously.HD (Hydrodynamic)and SW (Spectral Wave) modules are the foundations for ST(Sediment Transport) Module.The outputs of SW were introduced into HD Module and the outputs of the HD were the initial inputs for ST module.
Applied methodology in this research breaks into parts:
First:various data gathered together from both Maritime organization and National Cartographic Center including:wind and wave data,water surface elevation (WSE),and hydrographic points.Second:mesh of Nowshahr port has been created including some areas on both east and west sides.Finally,current’s parameters and sediment gradation were fed into hydrodynamic module.Then hydrodynamic and sediment transport modules were coupled and ran simultaneously.The modeling outcomes presented as results of this research.
3.1. Available data
Available information to develop a mathematical model for sediment transport of the area include:bathymetric maps of the area,statistical of wave and wind data in the area for a specific time,water level elevation data as well as gradation of the bed materials,which are all provided from maritime organization.
1.bathymetric map 2.Wave data,including significant wave height and period.3.Wind data:(three hours’ intervals)4.Water surface elevation data (WSE) base on 10 minute increment over a one-year timespan.5.Sediment gradation includingD50=0.13 mm.
3.2. Model objective
The main objective of this study focused on the sediment pattern and sediment transport direction to provide an annual dredging program to avoid sedimentation in the area.
3.3. MIKE 21 introduction and governing equations
The modelling system is based on the numerical solution of the two/three-dimensional incompressible Reynolds averaged Navier-Stokes equations subject to the assumptions of Boussinesq and hydrostatic pressure.Furthermore,the Hydrodynamic Module can be coupled to sediment module for sediment transport calculation.Sand transport module and mud transport module (MT) can be applied to simulate transport of non-cohesive and cohesive sediments,respectively.The choice between 2D and 3D model depends on several factors.For example,in shallow waters,wind and tidal current are often sufficient to keep the water column well-mixed,i.e.homogeneous in salinity and temperature,in such cases a 2D model can be used.MIKE 21 HD module is the basic for MIKE 21 calculations which is considered as a reference for other modules as well,such as:AD,ST,MT and PA.Shallow water equations are obtained directly from the Naiver-Stocks equations by considering these assumptions:1.density is considered to be constant.2.Turbulence represents by eddy viscosity.3.Hydrostatic pressure distribution is taken constant over the depth.Equations are
1 Conservation of mass

2 Conservation of momentum

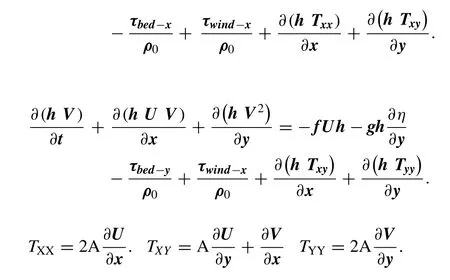
These equations include inertia/momentum,gravity,Coriolis,bed and surface friction as well as eddy viscosity.
3.4. Model setup information (boundary,time steps,constants)
3.4.1.Timedomain
It is very hard to exactly determine the initial and boundary conditions in simulation of the phenomena.It also needs some time to observe the effects of applied conditions in the model,hence reaching to a desirable convergence based on a criterion would be the limiting point from further iterations.In Mike by DHI the stability controlled by CFL Number which is also called Courant Number and defined as bellow:
cxand cyare the velocities,Δtis the time interval.ΔxandΔyare spatial increments.For a tidal wave velocity comes from below equation:
C=where g is gravity and h stands for water depth.
The model is stable when the CFL<1.
In this study for HD module time steps considered to be one second and for ST module the time interval considered to be 1800 seconds to comply with CFL criteria.By delineating the boundaries and considering time steps coupled model is ready for set up.Modules used for this study are:Hydrodynamic (HD),Spectral Wave (SW) as well as Sand Transport(ST) which are described separately in details.
3.4.2.HDmodule
The best way to observe the currents pattern is field investigation,but it is not achievable when the domain of the study is large or modeling is for a long period of time.HD module of Mike 21 is the basic for many other modules such as ST.HD module is capable to calculate the water surface elevation and the currents available within the area with respect to speed and direction.To develop a conceptual model first based on the bathymetric data from maritime organization,different domains were delineated on google earth which is presented in Fig.4 (b) Smallest one includes an area of 47 hectares which includes only the pool of Nowshahr port.Areas two and three include larger areas.Area one extended over a vast domain of the east and west to observe the currents not only around the pool of the port but to investigate some further areas.For HD [1–12]module,tidal and wind data as well as boundary condition were considered.There is a negligible tidal report for Caspian Sea hence it is not included in this report.Data which were fed into the model are:

Fig.4.(a) Nowshahr Port,(b) Three modeling domains,(c) Pool of Nowshahr port + Entrance.

Fig.5.(a) Wave rose,(b) Wind rose,based on the Iran Maritime Organization [2009-2010].
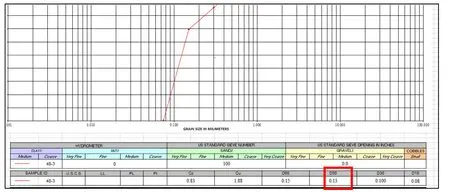
Fig.6.Soil gradation of the area.
Wind data:includes one-year data 07/2009–07/2010 by the time interval of three hour which will produces 365*8=2920 records.
Boundary conditions:after delineating the boundary of model based on the bathymetric data water surface elevation and model boundary conditions were assigned to the model.Three open boundaries to the sea were assigned to the model by the water surface elevation which is constant in time and varying in domain.Two months’ period was applied to the model,and to have a sufficient coverage a time interval of 30 minute considered as a time steps.
First the boundary was delineated in google earth based on the available hydrographic data and a TIN was created as mesh for the domain,then the boundary divided into three boundaries in red Fig.4(b) and finally by applying the WSE and the hydrographic data the bathymetric model of the domain was created.Fig.4(a)

Fig.7.Counter-clock-wise current of southern Caspian,HD simulation.
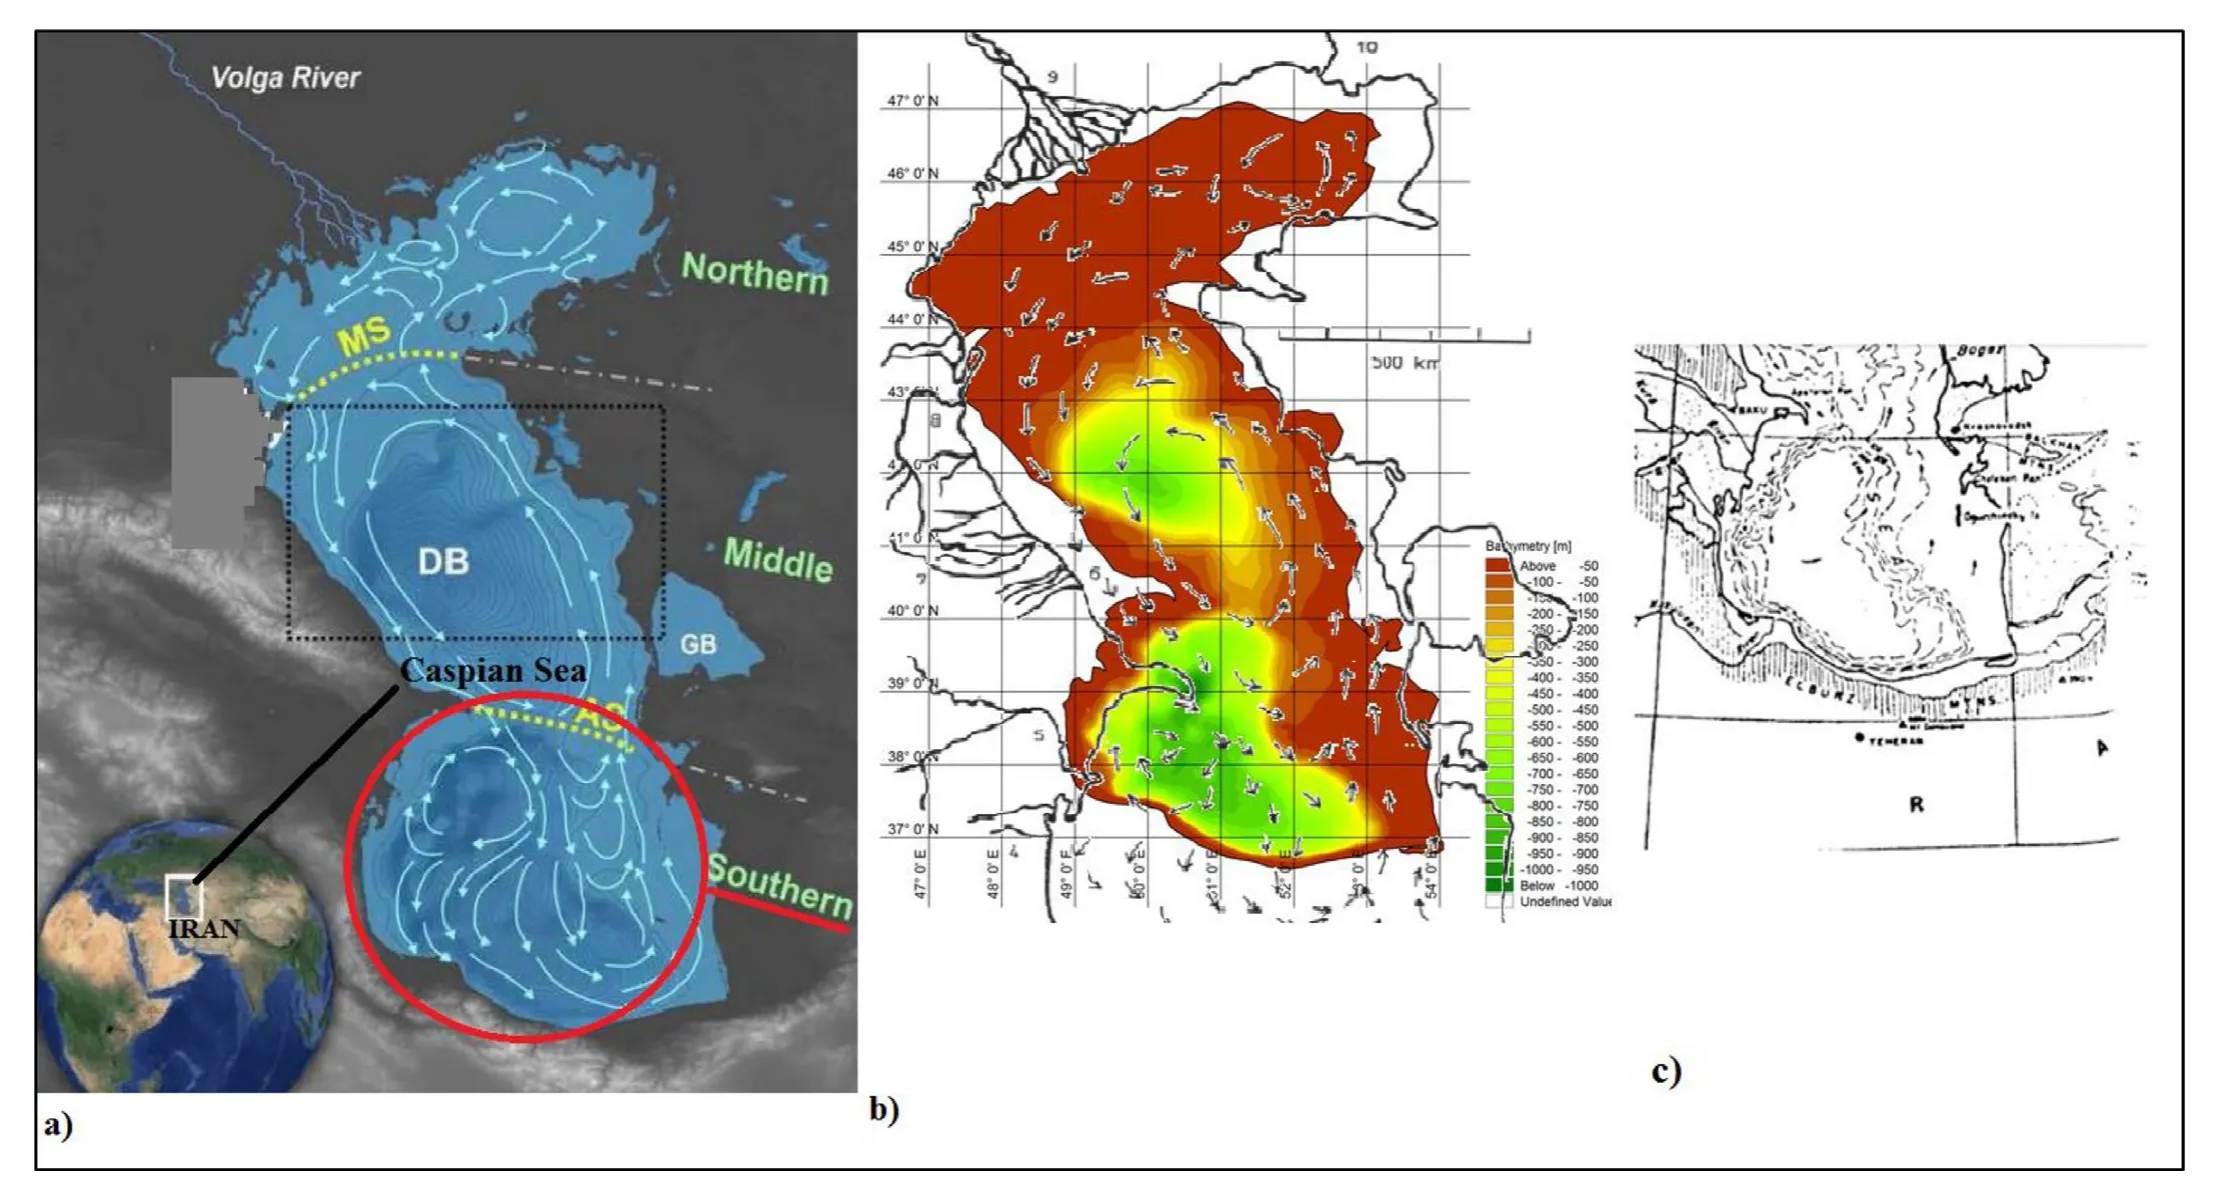
Fig.8.(a) Caspian Sea,(b) Counter clock wise current direction,(c) Southern Caspian currents,Courtesy to PARKEA.Dickey [ 25 ].
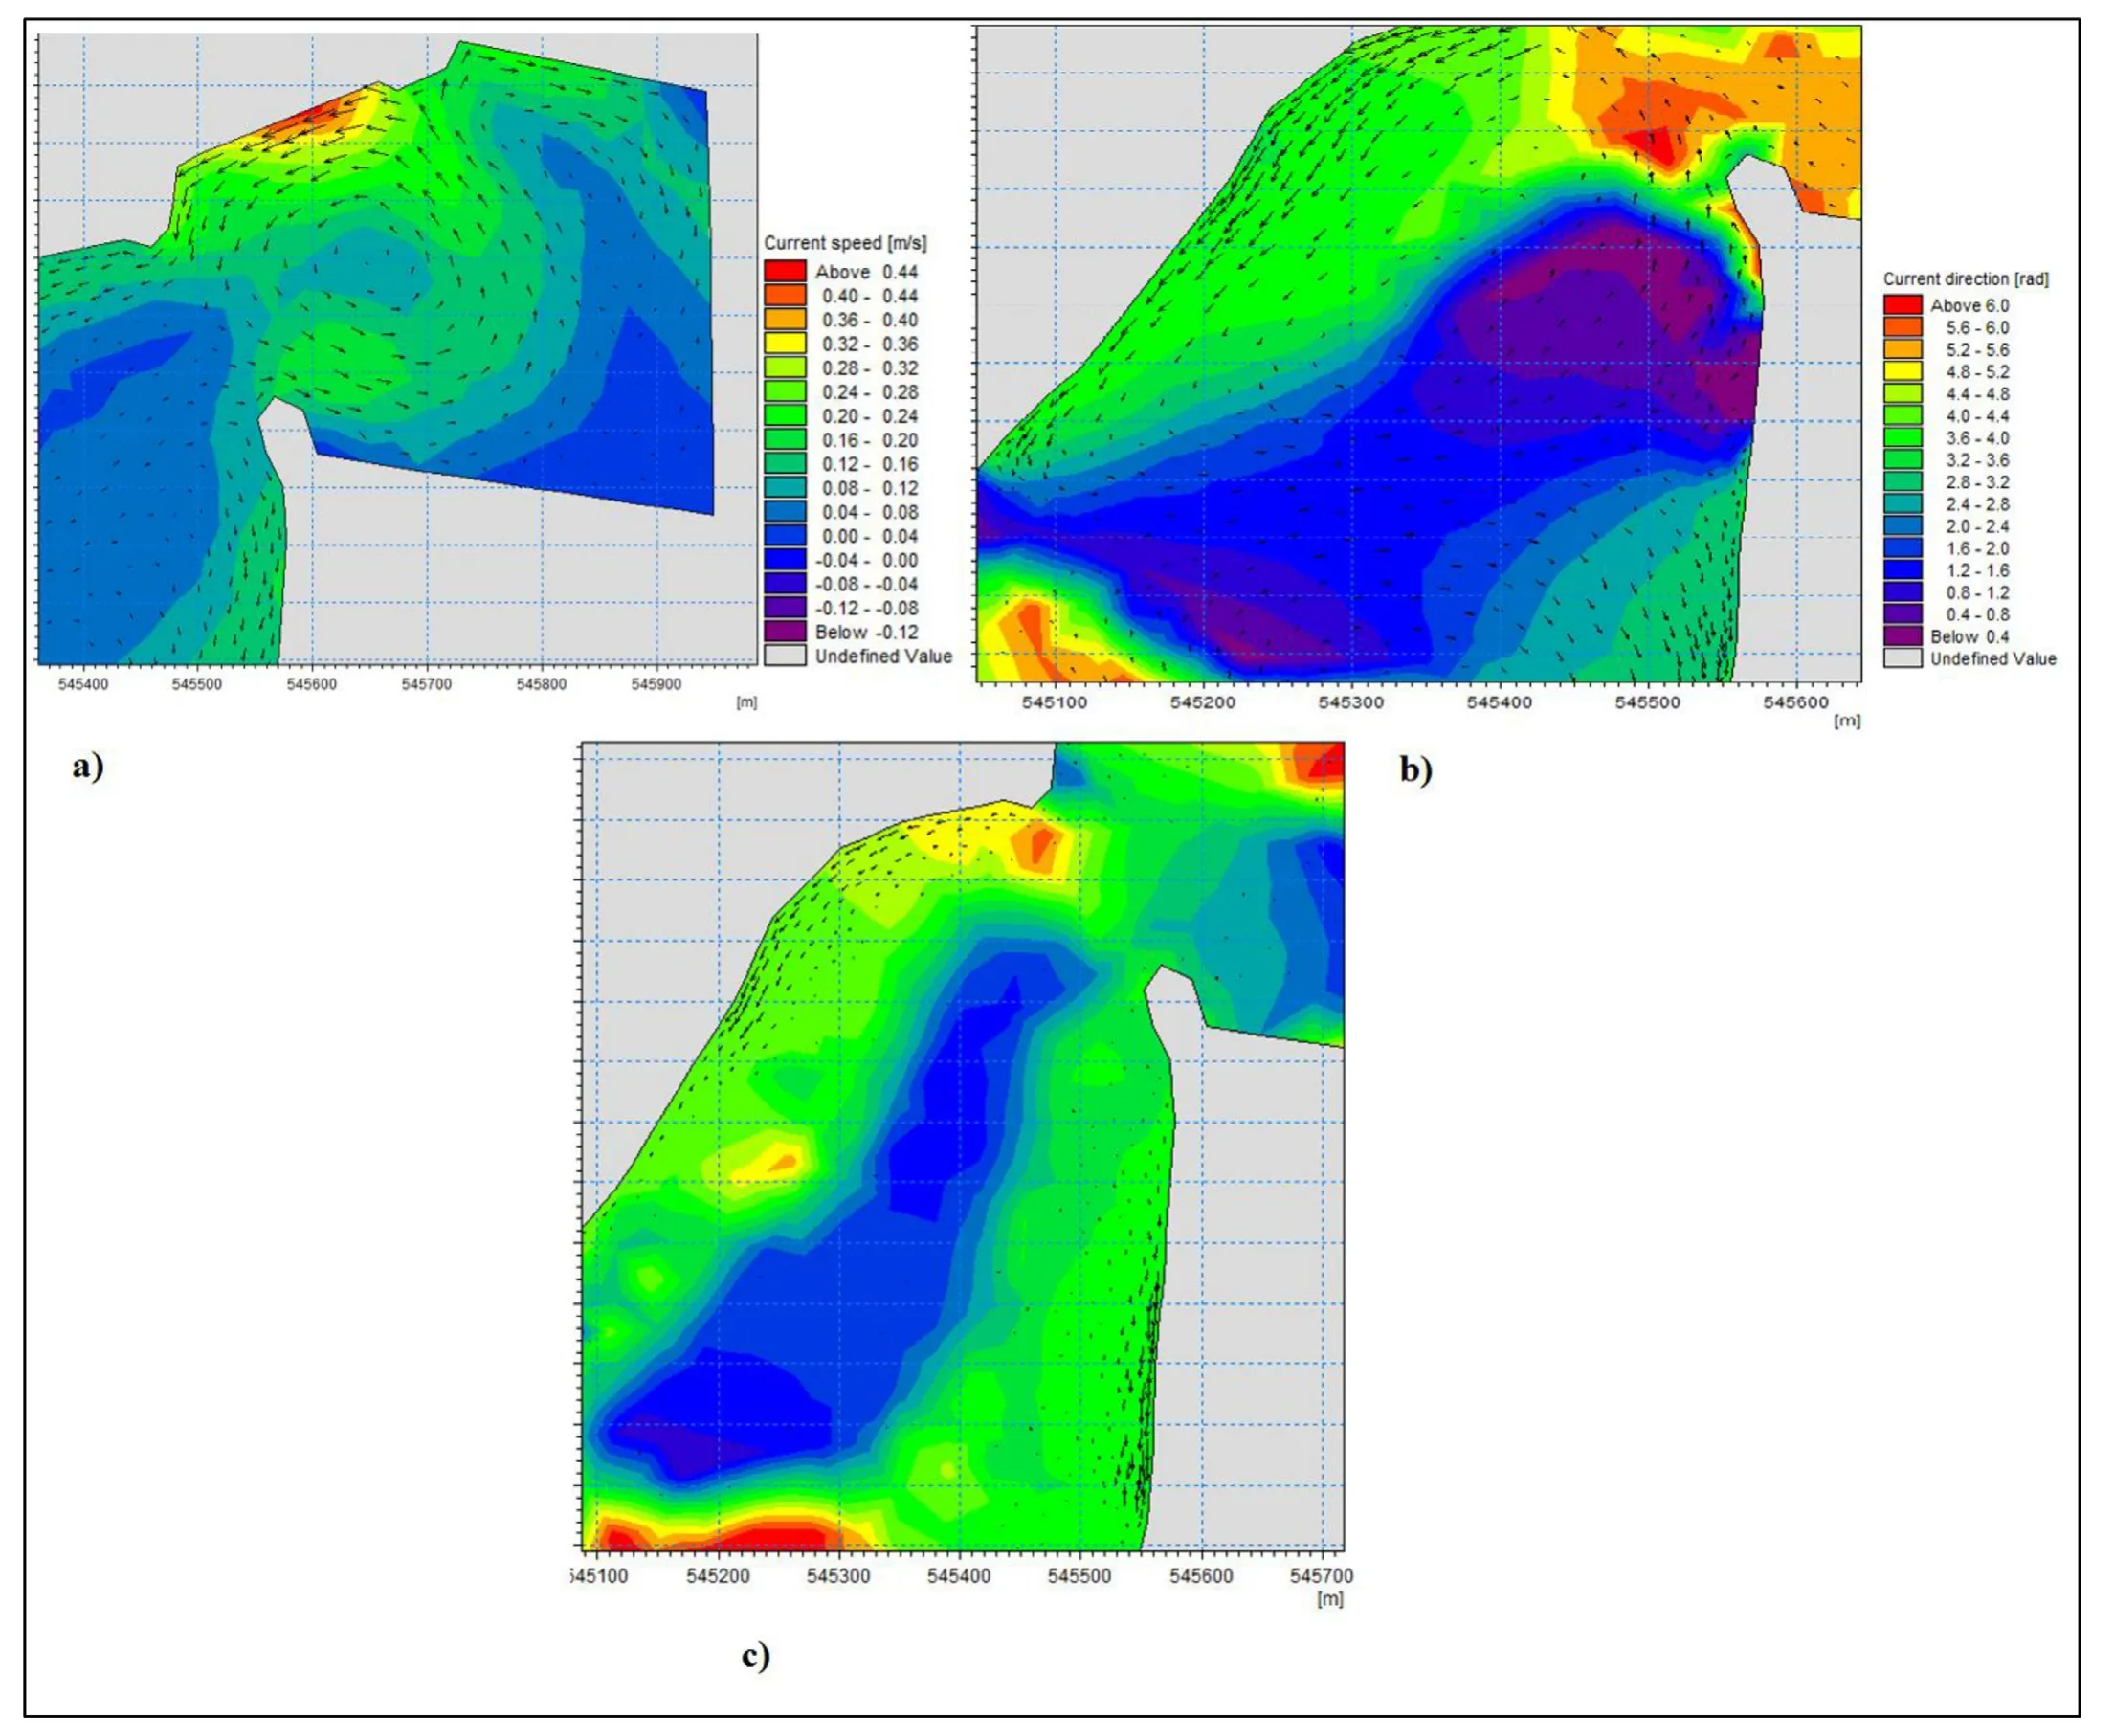
Fig.9.(a) Current speed (m/s),(b) Current direction (rad),(c) Total load direction.
3.4.3.SWmodule
In the hydrodynamic studies waves specifications such as height,period and length are calculated by computational approach based on the information for deep water but for observation of off-shore structure and the phenomenon such as sedimentation the characteristic of nearshore waves should be considered.SW module is a sufficient tool which includes nearshore activities such as shoaling and diffraction.SW module can simulate the production,growth,and translation of waves at the coastal areas.Two formulas for simulation are provided:1) Directionally decoupled parametric formulation and,2) Fully spectral formulation.Both are based on the wave power continuity equation.The first method is based on a finite difference approach by applying ADI [13].The second formula solved by Koman (1994) and Young (1999).
In this study,directionally decoupled parametric formulation was used.Two-month period with 30 minutes’ time steps considered to have a good coverage of the simulation interval.Constants for wave breaking are Gamma (ɣ) and Alpha(α) considered to beɣ=0.8,α=1 [14].Bottom friction considered to be 0.002 based on Nikuradse roughness value.For spectral discretization part the frequency is in the logarithmic scale with the minimum frequency of 0.055 Hz and frequency factor=1.1.Discretization was done in 15 directions and each includes 60arc.
3.4.3.1.Directionaldiscretization.Wave spectral distribution could be a whole circle or a part of it.Based on the wind rose from maritime organization discretization considered to be a ¼ of a circle (a 900arc) which has been divided into 15 smaller parts each represents for a 60arc.The result of SW module is the radiational stresses (Sxx,Syy,Sxy) which were replaced in the HD module then coupled to the ST module considering significant wave height and period to predict the sediment pattern as the outcome of ST module.

Fig.10.(a) First collected bathymetry 2009,(b) Second collected bathymetry 2009,(c) First simulation 2009,(d) Second simulation 2009.
Wave and wind roses were created from the wave and wind data respectively and presented in Fig.5 (a) and (b) respectively which were used in hydrodynamic and sand transport Modules.
3.4.4.STmodule
For morphological development of alluvial environments with interactions between bed bathymetry and hydrodynamics,only bed material transport is of interest,thus only bed material load will be considered.The interaction between bed load and alluvial bed is one of the fundamental aspects of morphological behavior of the channel [15–24].In contrast with suspended load it is assumed that bed load responds immediately to changes in local hydraulic conditions.
MIKE 21 can run HD and ST modules simultaneously while the output of HD will be the input of ST module.The coupled model of HD and ST modules of Mike by DHI is a strong tool to predict the bed level changes based on waves and currents interactions.In general,there are two sets of processes which mainly affect the sedimentation and erosion at the coastal areas.First is currents and the other is waves.Current study applies a coupled model which simulates the sediment pattern at Nowshahr port at the southern part of Caspian Sea.

Fig.11.(a) 13’161 hydrographic points,(b) Bathymetry of Nowshahr port (2009).
3.4.4.1.STmodulesetup.Eddy viscosity,Bed resistance,Porosity,D50and specific gravity of sediment particles are the most important parameters for ST module.Eddy viscosity and Bed resistance assumed to be 5 and 50 respectively,Specific gravity of the particles=2.65,the porosity=0.4 andD50=0.13 mm from the gradation results.Presented in Fig.6.
The domain for ST module is the same domain for HD.
4.Results
4.1. Mike results
Fig.7 shows the currents pattern from the simulation which is compatible with the counter clockwise currents direction from PARKEA.Dickey results for the southern part of the Caspian Sea (Fig.8 (c)).
Fig.9 (a) shows the current’s speed while entering into the pool.As velocity vectors approach the left arm their intensity increase.The physical understanding of such increase is the same when a water comes out from an outlet whereas an obstacle tries to cover the outlet partially.The same discharge should pass through a narrower slot (area decreases) hence velocity will increase.Similar kind of a thing happens here.Fig.9 (b) shoes the circulation of water within the pool in more detail.The overall flow direction is counter clock wise as observed in Fig.7 but a more precise look reveals that the current divided into two branches before it leaves the pool.The first part is the same counter clock wise current which results in erosion,the blue area Fig.9 (b) and the other turns to a clock wise circulation near the right arm and result in sedimentation (green area by the right arm) Fig.9 (c).
4.2. Calibration
For model calibration,eddy viscosity and bed resistance considered as the most influential parameters,because the eddy viscosity plays a crucial role in the stability of the model.Eddy viscosity considered to be 5 m2/s after some trial and error cycles.Bed resistance considered to be 50 and shallow water equation were used in the model to estimate the currents due to waves.In general Courant Number,less than one guarantees the stability of the model but if the bathymetry is not changing drastically Courant of o 5 and 6 would be acceptable and,if the bathymetry is changing very slightly it could be increased to 20.There are no major differences between the erosion and deposition areas between simulations and field measurements (Fig.10).Except that the purple area of deposition in the middle is a bit more extended in the simulation but considering similarity of the overall shape and pattern it can be neglected.

Fig.12.(a) First bathymetric collection (2009.a),(b) Bed contour (2009.a),(c) 3D bathymetry (2009.a),(d) Second bathymetric collection (2009.b),(e) Bed contour (2009.b),(f) 3D bathymetry (2009.b).
4.3. ArcGIS results
In 2009 there are two set of field measurements with a six-month period.Henceforth they are called first and second data collections.The first includes 13,161 hydrographic field collection and the second includes 26,000 hydrographic points.Fig.11 shows a schematic of field measurement converted to AutoCAD format and finally into a 3D-bed form by Arc-Scene.
Fig.12 shows data points from 2009 in shape forma,bed contours and bathymetrical shape of the basin.
Fig.13 shows the 3D bathymetry of Nowshahr port based on both set of field measurements including superposition of the layers for year 2009.
In Fig.14,depth variation presented both in plan-view and 3D view inside of the pool.
Hydrographic data was used to create the morphological shape of bathymetry.In 2012,2450 hydrographical points were collected covering an area of 525 m*200 m=1050001 m2which is almost 10.5 hectares compared to 47 hectares of the pool occupies almost one fifth of the entire area.Fig.15 shows the collected data,bathymetry created from them as well as raster and counter created from individual collected points.
5.Conclusion
Subtracting the volumetric bathymetry at the range of anchorage depth (five meters) in 2011-2012 shows the volume of 25,282.33 m3(See S.I.1) which is very close to data from attribute table of ArcGIS which is equal to 28,611.17 m3(See S.I.2).Gain and loss calculations show the total volume of + 6,981.70 m3(See S.I.3).(Positive values present the erosion).It means the erosion volume was higher in comparison to deposition volume for 2011 to 2012 while the deposition area (red) is bigger than the erosion area (blue) Fig.16.

Fig.13.(a) 2009.a bathymetry,(b) 2009.b bathymetry,(c) Superposition of bathymetric layers (2009).

Fig.14.(a) 3D depth variation,(b) Depth variation in the entire area of Nowshahr pool.

Fig.15.(a) 2450 hydrographical points adjacent to land boundary,(b) Bathymetry of the pool 2012,(c) Raster format of collected data,(d) Bed counters.
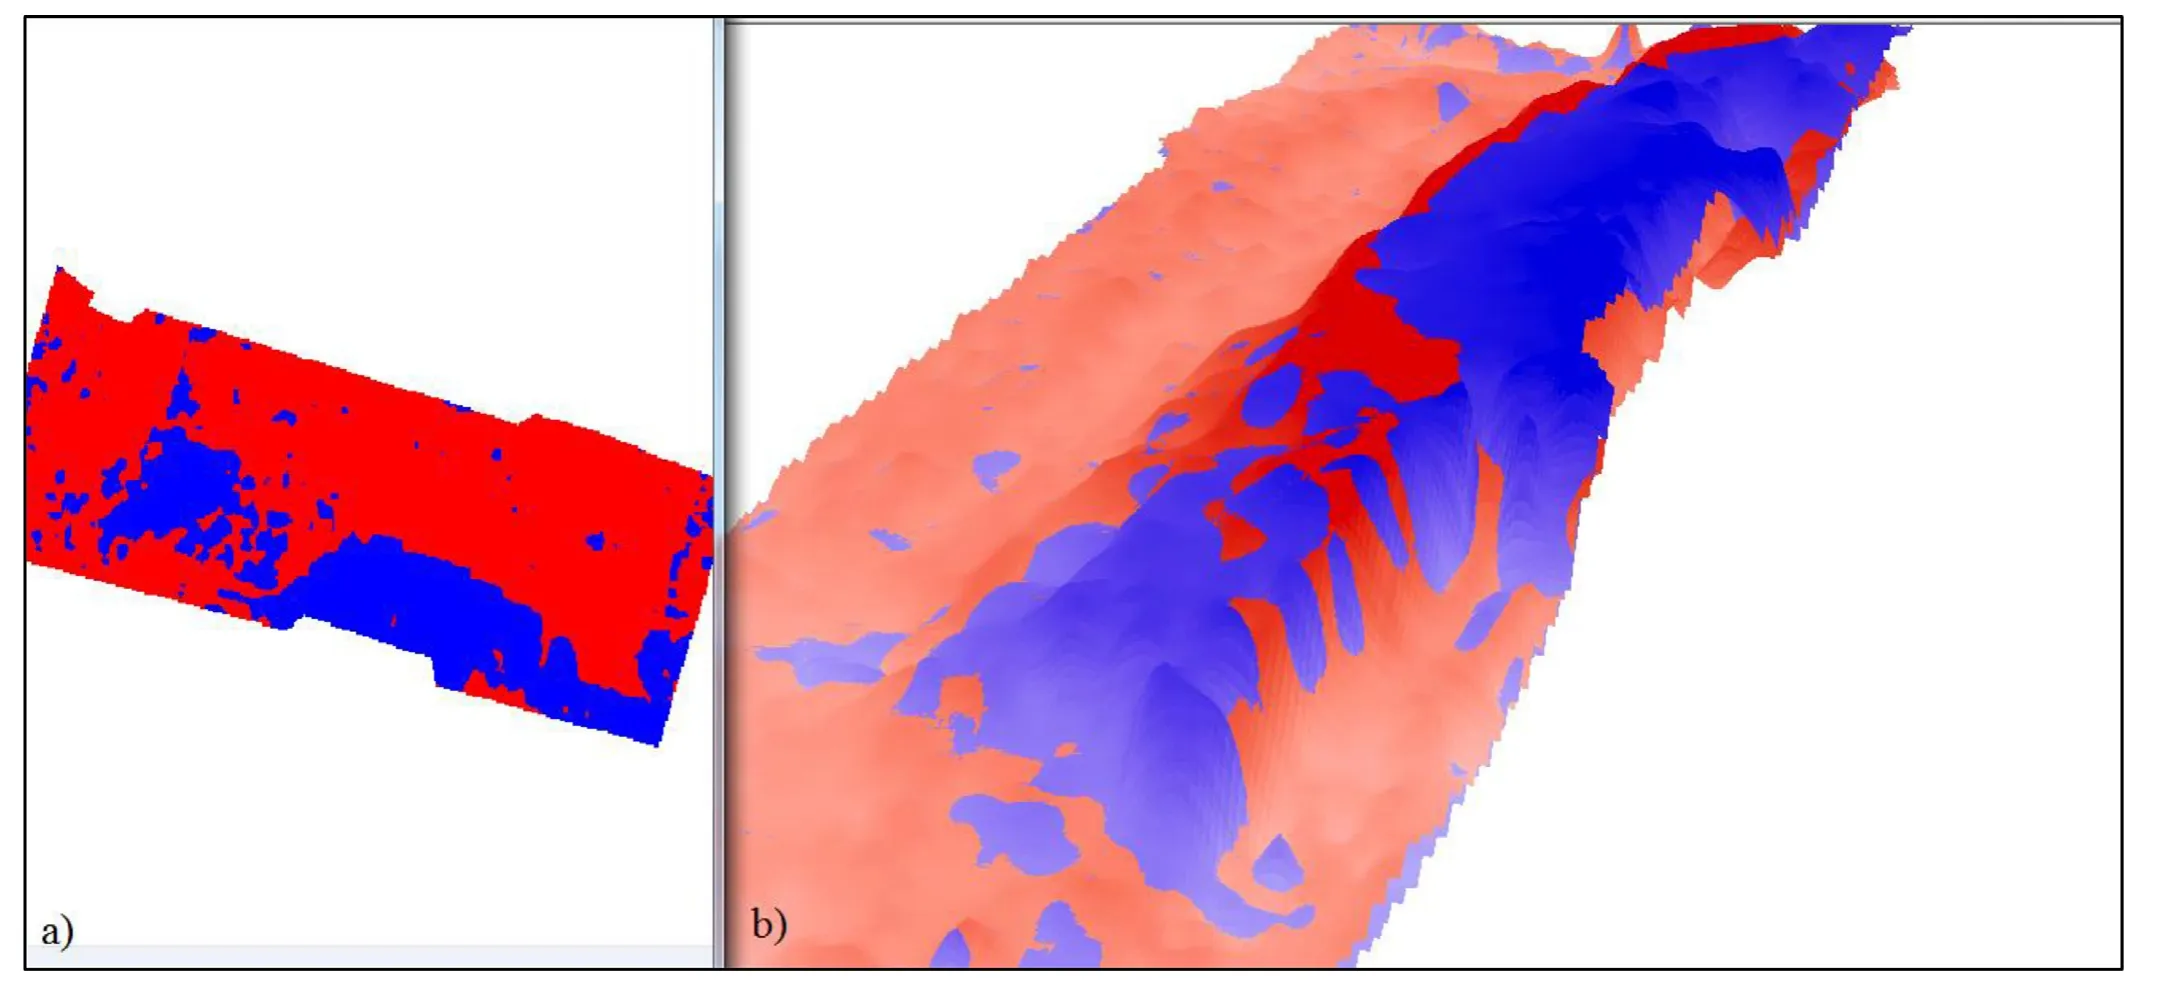
Fig.16.Superposition of bathymetric layers 2011 &2012 (a) Plan View,(b) 3D.
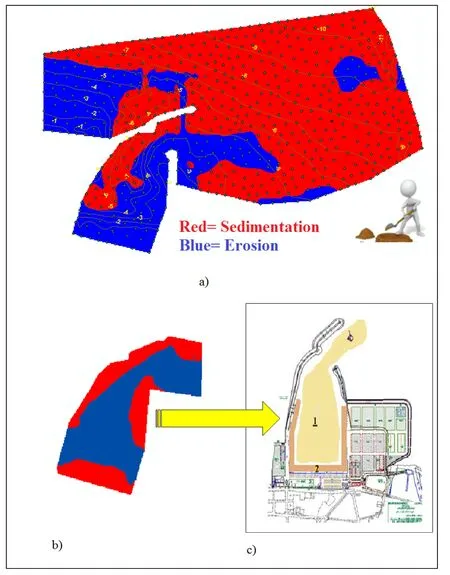
Fig.17.(a) Sediment pattern,(b) Red areas:depth < 5 m,(c) Two-folded areas for annual dredging.
Layers,areas,and volumetric calculations result in a very crucial conclusion.In the other terms although the red area(sediment deposition) seems to be bigger than the blue area(erosion) but the erosion volume was higher than the sedimentation volume,therefore depth factor plays a critical role in the interpretation of the annual dredging plan.In general,one can say sedimentation and erosion has neither regular pattern at the location nor volume,unless it is calculated from precise bathymetric modeling and superposition of the layers.
Erosion Area<Deposition Area (Fig.16) but,Erosion Volume>Deposition Volume based on 3D bathymetric superposition (S.I.1,2).It is interesting to know that the area calculation is not sufficient for sedimentation and erosion patterns estimation although it shows the extent and domain.Hence volumetric calculations come to play due to superposition of bathymetric layers.Based on Mike results the direction of the sediment transport is highly dependent to the direction of the waves introducing to the shore,but the main direction is from west to east (Figs.7–9).Based on Fig.17 (a)total sediment transport rate is from west to the east.By approaching the breakwater from west sediment transport rate reduces which means the sediment accumulation occurs behind the western arm,as the counter clock wise current enters the pool it slowdowns in the inner side of the western arms results in sedimentation (red area at the inner side of western arm) Fig.17 (a),then currents circulate inside the pool erodes the sediment and washes them away in an outward direction.When flow moves outside the eastern arm the rate of sediment transport increases which is an indicator of erosion at the outer side of the eastern arm and when it goes far enough the current velocity reduces when the vortex effect of rotating current inside the pool diminishes hence the sediment deposition occurs again which is not the field of our interest because there is no structure out there.To avoid sediment accumulation at the western arm in long term (e.g.20 years) which results in structural malfunction,annual or semi-annual dredging program is needed.Eastern arm area needs to be studied further for stability investigation due to erosion and if needed the protection must be done.Fig.17 (b)shows the red areas which has the anchorage depth below five meters offering the two-folded dredging areas shown in Fig.17 (c).
Declaration of Competing Interest
The authors declare that they have no known competing financial interests or personal relationships that could have appeared to influence the work reported in this paper.
Supplementary materials
Supplementary material associated with this article can be found,in the online version,at doi:10.1016/j.joes.2020.04.002.
杂志排行
Journal of Ocean Engineering and Science的其它文章
- Dispersive soliton solutions for shallow water wave system and modified Benjamin-Bona-Mahony equations via applications of mathematical methods
- Analytic approximate solutions of diffusion equations arising in oil pollution
- Absolute and relative sea-level rise in the New York City area by measurements from tide gauges and satellite global positioning system
- A semi-analytical method for forced vibration analysis of cracked laminated composite beam with general boundary condition
- An efficient computational technique for time-fractional modified Degasperis-Procesi equation arising in propagation of nonlinear dispersive waves
- Analytical solution for one-dimensional nonlinear consolidation of saturated multi-layered soil under time-dependent loading