Expression patterns and pheromone-binding properties of the pheromone binding protein CpunPBP3 in Conogethes punctiferalis (Lepidoptera: Crambidae)
2021-05-11CHENQiuYingYANGXiYOUDongRuiYANGMuXUZhiFengXIAOWei
CHEN Qiu-Ying, YANG Xi, YOU Dong-Rui,YANG Mu, XU Zhi-Feng, XIAO Wei,*
(1. Key Laboratory of Entomology and Pest Control Engineering, College of Plant Protection, Southwest University,Chongqing 400715, China;2. Academy of Agricultural Sciences, Southwest University, Chongqing 400715, China)
Abstract: 【Aim】 This study aims to better understand the sex pheromone perception mechanisms by identifying and characterizing a sex pheromone binding protein (PBP) in the yellow peach moth, Conogethes punctiferalis (CpunPBP3). 【Methods】 The cDNA sequence of CpunPBP3 of C. punctiferalis was amplified and analyzed, and the amino acid sequence was compared to those of the homologous proteins in other Crambidae species. The day-age-dependent changes and circadian fluctuations in the expression levels of CpunPBP3 in the male adult antenna of C. punctiferalis, and the changes in the expression level of CpunPBP3 in the antenna over 24 h-period following exposure of adult males to the sex pheromones E10-16∶Ald (150 ng) and Z10-16∶Ald (6 ng) were examined by qRT-PCR. The recombinant expression vector pET-30a(+)/CpunPBP3 was constructed, and the recombinant CpunPBP3 was expressed in Escherichia coli. The binding capacity of the purified recombinant protein CpunPBP3 with the above two sex pheromones was evaluated by fluorescence competitive binding assay. 【Results】 The phylogenetic analysis result revealed that CpunPBP3 and the previously identified C. punctiferalis PBP genes CpunPBP2 and CpunPBP5 clustered in different branches, but CpunPBP3 is similar to PBP genes in other insect species. The qRT-PCR results showed that the expression level of CpunPBP3 in the male adult antenna increased first and then decreased from day 0 to 8 after adult eclosion, with significantly higher expression level at 17∶00 than at 1∶00, but with no significant difference at other time points within 24-h photoperiod. However, the expression level of CpunPBP3 in the male adult antenna significantly decreased after induction by 150 ng E10-16∶Ald for 3 and 6 h, and significantly increased after induction by 6 ng Z10-16∶Ald for 6 and 24 h. Fluorescence competitive binding assay result showed that the recombinant CpunPBP3 had strong binding capacity with E10-16∶Ald and Z10-16∶Ald, with the Ki values of 9.267 and 8.656 μmol/L, respectively. 【Conclusion】 The study determined the nucleotide and amino acid sequences and the expression pattern of CpunPBP3, and CpunPBP3 was expressed in response to the sex pheromone induction. The recombinant CpunPBP3 has strong binding capacity with sex pheromone, indicating that CpunPBP3 is a sex pheromone binding protein in C. punctiferalis.
Key words: Conogethes punctiferalis; sex pheromone binding protein; expression pattern; circadian rhythm; prokaryotic expression; fluorescence competitive binding assay
1 INTRODUCTION
Sex pheromones play important roles in moth sexual communication. Upon entry into antennal sensillum lymph, pheromone molecules are bound by pheromone binding proteins (PBPs) and transported to olfactory receptors (ORs) located on the olfactory receptor neurons (ORNs), where signal transduction is initiated (Suhetal., 2014). As a subclass of odorant binding proteins (OBPs), PBPs are small soluble proteins of 13-17 kD with six conserved cysteine residues that are thought to form three disulfide bridges that stabilize the 3-dimensional structure (Pelosietal., 2006; Vogtetal., 2015). Since the first PBP was found in the antennae of the male silk moth,Antheraeapolyphemus, PBPs have been identified in many Lepidoptera species (Vogt and Riddiford, 1981; Pelosietal., 2006) and show to cluster into three groups in evolutionary analyses (Sunetal., 2013). Three or four PBP homologs were found in each moth species (Lealetal., 1999; Pelosietal., 2014; Vogtetal., 2015; Sunetal., 2019). The sex- or organ-biased expression of PBPs reflect their major functions, for example, PBPs highly expressed in male antennae play a critical role in the perception of female sex pheromone (Guetal., 2013). The expression patterns of PBPs can be altered by exposure to synthetic pheromone components and plant volatiles (Wanetal., 2015).
The binding properties of OBPs and PBPs in many moth species have been investigated with fluorescence competitive binding assay (Zhangetal., 2012; Sunetal., 2013). Although different PBPs generally exhibit distinct binding affinities, no consistent patterns have been observed (Liuetal., 2013; Jinetal., 2014). For example, in the diamondback moth,Plutellaxyllotella, three PBPs strongly bind with all four pheromone components (Sunetal., 2013), whereas in the Oriental fruit moth,Grapholitamolesta, only GmolPBP2 showed strong binding affinity with two sex pheromone components, (Z)-8-dodecenyl acetate and (E)-8-dodecenyl acetate (Songetal., 2014).
The yellow peach moth,Conogethespunctiferalis, is a polyphagous insect pest widely distributed in East Asia, South Asia and Australia. The sex pheromones of this species are (E)-10-hexadecenal (E10-16∶Ald) and (Z)-10-hexadecenal (Z10-16∶Ald), with the former being predominant (Konno and Arai, 1982). Antennal transcriptomic analysis has tentatively identified five PBPs in this species (Xiaoetal., 2016), of which CpunPBP2 and CpunPBP5 showed high affinity withE10-16∶Ald andZ10-16∶Ald (Geetal., 2018).
In this study we cloned the PBP geneCpunPBP3, which is the one of the above five PBP genes, expressed in the antennae ofC.punctiferalisand characterized its expression pattern including circadian variations and changes in response to sex pheromones. We also evaluated the binding characteristics of the purified recombinant protein CpunPBP3 with pheromone components by fluorescence competitive binding assay. The results demonstrate thatCpunPBP3 functions in pheromone recognition inC.punctiferalisand enriches the existing PBP genes identified in this species.
2 MATERIALS AND METHODS
2.1 Insects
A colony ofC.punctiferaliswas established from pupae collected from a chestnut orchard in Chongqing, southwestern China as previously reported (Xiaoetal., 2012; Yangetal., 2017). Briefly, larvae were reared on chestnuts or corn at 25±1℃, 40%-60% relative humidity under a photoperiod of 15L∶9D, in which the scotophase and photophase were set oppositely to those of the natural photoperiod outside the experimental room. Adults were sexed upon eclosion and separately maintained in cages where they were provided with a 10% sugar solution. A 15 W red incandescent light was used for observation during scotophase. The antennae of male adults were removed 2-4 d after eclosion and processed for RNA extraction.
2.2 Chemicals
The synthetic pheromone componentsE10-16∶Ald andZ10-16∶Ald were purchased from Shanghai Udchem Technology Co. (Shanghai). 1-NPN (purity≥95%) was purchased from Sigma-Aldrich (St. Louis, MO, USA). All chemicals were stored as specified by the manufacturers.
2.3 RNA extraction and cDNA synthesis
The RNeasy Plus Micro Kit (Qiagen GmbH, Hilden, Germany) was used to extract the total RNA from 50 pairs of antennae from 2-day-old male adults according to manufacturer’s instructions. RNA integrity was verified by 1.0% agarose gel electrophoresis and quantified with a NanoVue UV-Vis spectrophotometer (Sangon Biotech Co., Ltd., Shanghai). First-strand cDNA was synthesized from one μg of RNA using the PrimeScriptTMRT Kit DRR037A (TaKaRa Biomedical Technology Co., Ltd., Dalian).
2.4 Cloning and sequence analysis
Based on the antennal transcriptome information (Xiaoetal., 2016), a full-length sequence of theCpunPBP3 gene was cloned with primers (F: 5′-CAAGCGGATCAAGACATT-3′; R: 5′-ACCCAAAG CCTCAATACA-3′) designed using Primer Premier 5 (www.Premierbiosoft.com) and DNAMAN 8.0 (www.lynnon.com). The PCR reaction system (25 μL) contained 22 μL T3 super PCR Mix (TsingKe Biotech, Beijing), 1 μL each of the forward and reverse primers (10 μmol/L), and 1 μL cDNA from Section 2.3. The amplification program was as follows: 98℃ for 2 min; 34 cycles of 98℃ for 15 s, 55℃ for 10 s and 72℃ for 10 s; and 72℃ for 2 min. The PCR products were separated by electrophoresis on a 1% agarose gel in 1×Tris-acetate-EDTA buffer, excised from the gel, and purified with a DNA gel extraction kit DP209 (TianGen Biochemical Technology, Beijing) according to the manufacturer’s protocol. The purified products were cloned into the pGEM-T easy vector (TaKaRa Biomedical Technology Co., Ltd., Dalian), which was then transformed intoTrans5αcompetentEscherichiacoli(TransGen Biotech Co., Ltd., Beijing). Positive clones were selected and sequenced.
A putative signal peptide was predicted with SignalP 4.1 Server (http:∥www.cbs.dtu.dk/services/SignalP). Amino acid sequences were aligned with Clustal 1.41, and a phylogenetic tree was constructed with the neighbor-joining method using MEGA5 (bootstrapping with 1 000 replications). Sequences used for alignment and phylogenetic tree construction were downloaded from the NCBI database (https:∥www.ncbi.nlm.nih.gov/).
2.5 Expression profiling of CpunPBP3
Insects were sexed at the pupal stage and the antennae of male adults were collected at 0, 2, 4, 6 and 8 d post eclosion. Antennae (40 pairs of antennae a sample, three samples of a group) of 3-day-old male adults were also collected at different time points (9∶00, 13∶00, 17∶00, 21∶00, 1∶00 and 5∶00) of the day. To evaluate the effects of sex pheromone exposure on the expression level ofCpunPBP3 at 3 h after lights-off, lures loaded with theC.conogethessex pheromoneE10-16∶Ald andZ10-16∶Ald (For each ofE10-16∶Ald andZ10-16∶Ald, one female equivalent was 5 and 0.2 ng, respectively, total dose: 150 ngE10-16∶Ald, 6 ngZ10-16∶Ald) dissolved inn-hexane were placed for 2 min in a cage (40 cm×40 cm×40 cm) containing 30 males. The antennae (30 pairs of antennae a sample, three samples of a group) of the male adults were collected at 0.5, 3, 6, 12 and 24 h after sex pheromone exposure and RNA was extracted as described in Section 2.3. Male adults without exposure to sex pheromone were used as the control. The primers forCpunPBP3 (F: 5′-ATGG AGCTGATGACGCCAC-3′; R: 5′-CCAAGATCTCT GCCAACACG-3′) were designed with Primers3 Input (http:∥frodo.wi.mit.edu/).RP49 (GenBank accession no.: KX668533, primers F: 5′-AAAGGTTTATCCGCCATCA-3′; R: 5′-TAGAC GAGACGCCGTGAGC-3′) was used as a reference gene (Yangetal., 2017). The qRT-PCR reaction system (20 μL) contained 10 μL SYBR Premix ExTaq mixture (TaKaRa Biotechnology Co., Ltd., Dalian), 1 μL each of the forward and reverse primers (10 μmol/L), 1 μL cDNA, and 7 μL RNase-free water. The amplification program was designed as follows: denaturation at 95℃ for 2 min; followed by 39 cycles of 95℃ for 15 s and 60℃ for 30 s, with melting curve analysis performed from 60℃ to 95℃ to evaluate the specificity of PCR products using qTOWER2.2 (Analytik Jena, Germany) with three technical repetitions.
2.6 Expression and purification of the recombinant protein
The entire coding region ofCpunPBP3 without the signal peptide sequence was cloned into the pET-30a(+) bacterial expression vector (Novagen, Madison, WI). The pET-30a(+)/CpunPBP3 plasmid was transformed intoTransBL21 (DE3) competentE.colicells (TransGen Biotech Co., Ltd., Beijing), which were grown on Luria-Bertani (LB) agar plates with kanamycin (50 mg/mL). A single positive clone was selected and grown overnight at 37℃ in liquid LB with 50 mg/mL kanamycin. The culture was diluted 1∶100 (v/v) and cultured for 5-6 h at 37℃ until the optical density at 600 nm reached 0.6-0.8. To induce protein expression, isopropyl β-d-1-thiogalactopyranoside (IPTG) was added to the culture at a final concentration of 0.1 mmol/L, followed by incubation at 28℃ for 18 h. Cells were collected by centrifugation (5 000 r/min for 15 min) and resuspended in 5 mL phosphate-buffered saline (PBS), lysed by sonication and centrifuged (10 000 r/min, 20 min, 4℃). The supernatant was purified using the Ni-NTA SefinoseTMResin Kit (Sangon Biotech Co., Ltd., Shanghai) and dialyzed overnight at 4℃. The purity of the protein was verified by SDS-PAGE, and protein concentration was determined with the BCA Protein Quantification Kit (Bomed Biotechnology Co., Antwerp, Belgium).
2.7 Fluorescence competitive binding assay
To determine the affinity of the recombinant CpunPBP3 with sex pheromone, a fluorescence binding assay was performed. The fluorescent probe 1-NPN (Sigma-Aldrich) and all tested chemicals were dissolved in HPLC purity methanol at a final concentration of 1 mmol/L. To measure the binding of the florescent ligand 1-NPN to the recombinant CpunPBP3, a 2 μmol/L solution of the protein in 50 mmol/L Tris-HCl (pH 7.4) was titrated with 1 mmol/L ligand in methanol to a final concentration of 2-20 μmol/L. The probe was excited at 337 nm and emission spectra were recorded between 360 and 490 nm with a fluorescence spectrophotometer (F970CRT; Shanghai Lengguang Technology Co., Shanghai) using a 1 cm light path fluorimeter quartz cuvette. The affinities ofE10-16∶Ald andZ10-16∶Ald to ligands were evaluated with a competitive binding assay at concentrations ranging from 0.5-20 μmol/L using 2 μmol/L 1-NPN as the fluorescent reporter (Liuetal., 2013; Sunetal., 2013).
The binding constant K1-NPNof 1-NPN to the protein was determined by plotting fluorescence intensity values against free ligand concentrations using Prism software (GraphPad, La Jolla, CA, USA). It was assumed that the protein was 100% active with a stoichiometry of 1∶1 (protein∶ligand) at saturation. Dissociation constants of the competitors (Ki) were calculated from the corresponding IC50values (concentrations of ligand that reduced the initial fluorescence value of 1-NPN by 50%), using the equation: Ki=[IC50]/(1+[1-NPN]/K1-NPN), where [1-NPN] is the free concentration of free 1-NPN and K1-NPNis the dissociation constant of the 1-NPN (Sunetal., 2019).
2.8 Data statistics
One-way analysis of variance (ANOVA) followed by a least significant difference (LSD) test (P<0.05) was used to analyze differences in gene expression levels among different ages and time points, andt-test was used to analyze differences in gene expression levels between the treatment group and the control group at the same time point. Data were analyzed using SPSS v16.0 software (SPSS Inc, Chicago, IL, USA).
3 RESULTS
3.1 Sequence analysis of CpunPBP3
TheCpunPBP3 gene comprises an open reading frame of 486 bp encoding 161 amino acids. A 19-amino-acid signal peptide cleavage site was predicted using SignalP. Alignment of the amino acid sequences of CpunPBP3, CpunPBP2 and CpunPBP5 revealed six conserved cysteine residues, which is typical for classic OBPs (Fig. 1). CpunPBP3 shows relatively high amino acid sequence identity with CmedPBP2 (48.17%) ofCnaphalocrocismedinalis, OfurPBP-A (51.81%) ofOstriniafurnacalis, OnubPBP2 (51.81%) ofOstrinianubilalis, CpunPBP2 (43.53%) and CpunPBP5 (41.07%) (Fig. 1), and is most similar to MvitPBP1 ofMarucavitrata(Fig. 2) with 74.53% amino acid sequence identity (Fig. 1). The previously identified CpunPBP2 shows relatively high amino acid sequence identity (68.82%) to CmedPBP2, while the amino acid sequence identity of CpunPBP5 to CmedPBP5 is 75.1% (Fig. 2).
3.2 Effects of circadian cycle and pheromones on the gene expression level of CpunPBP3
Daily fluctuations in the expression level ofCpunPBP3 were evaluated by qRT-PCR. The maximum expression level in the antennae of male adults was observed at 2-6 d post eclosion (P<0.05), after which the expression level decreased significantly (P<0.05) (Fig. 3). There was no significant difference in expression levels in adults at 0 and 8 d post eclosion. The circadian rhythm ofCpunPBP3 expression shown in Fig. 4 revealed that its expression level at 17∶00 was significant higher than that at 1∶00 (P<0.05), although the expression levels at these 2 time points did not differ significantly from those at 9∶00, 13∶00, 21∶00 and 5∶00 (P>0.05). There were no significant differences in the expression level ofCpunPBP3 among the 3 time points of the scotophase (9∶00, 13∶00 and 17∶00) or photophase (21∶00, 1∶00 and 5∶00)(P>0.05).

Fig. 1 Sequence alignment of CpunPBP3 with homologous PBPsOrigin species of PBP proteins and their GenBank accession numbers: CpunPBP3: Conogethes punctiferalis, AVL25107.1; CpunPBP2: Conogethes punctiferalis, ALC76550; CpunPBP5: Conogethes punctiferalis, KP985227; CmedPBP2: Cnaphalocrocis medinalis, AGI37364.1; MvitPBP1: Maruca vitrata, AGS46557.1; OfurPBP-A: Ostrinia furnacalis, BBB15962.1; OnubPBP2: Ostrinia nubilalis, ADT78496.1. The same for Fig. 2. Six conserved cysteine residues are marked in red.
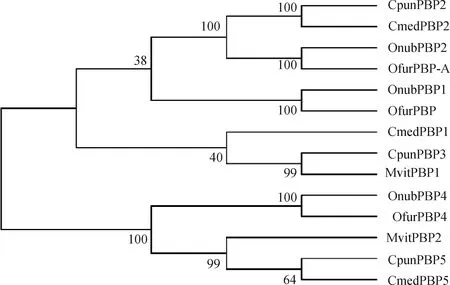
Fig. 2 Phylogenetic analysis of CpunPBP3 from Conogethes punctiferalis and homologous PBPsusing neighbor-joining method based on amino acid sequences (1 000 replications)Origin species of PBP proteins and their GenBank accession numbers are as follows: CmedPBP1: Cnaphalocrocis medinalis, AFG72999.1; CmedPBP5: Cnaphalocrocis medinalis, ALT31680.1; OnubPBP1: Ostrinia nubilalis, ADT78495.1; OnubPBP4: Ostrinia nubilalis, ADT78498.1; OfurPBP: Ostrinia furnacalis, XP_028175141.1; OfurPBP4: Ostrinia furnacalis, ADT78503.1; MvitPBP2: Maruca vitrata, ANA06563.1.

Fig. 4 Circadian rhythm of CpunPBP3 expression level inthe antennae of male adults of Conogethes punctiferalisData in the figure are means±SD. Different letters above bars indicate significant difference (P<0.05, LSD test) in the gene expression level among different time points.
The expression levels ofCpunPBP3 in the antennae of male adults at 3 and 6 h after exposure to 150 ngE10-16∶Ald decreased significantly, as compared to that of the control without exposure to sex pheromone (P<0.05) (Fig. 5: A). There were no significant differences in the expression level ofCpunPBP3 in the antennae of male adults exposed toE10-16∶Ald for 0.5, 12 and 24 h and the control (P>0.05). The expression levels ofCpunPBP3 in the antennae of male adults after exposure to 6 ngZ10-16∶Ald for 6 and 24 h were significantly elevated as compared to that in the control (P<0.05), whereas no significant differences in the expression level ofCpunPBP3 were observed at other time points between the treatment and the control (P>0.05)(Fig. 5: B).
3.3 Binding affinity of the recombinant CpunPBP3 to sex pheromones
Recombinant CpunPBP3 was expressed inE.coli, purified by affinity chromatography and verified by SDS-PAGE (Fig. 6), with the concentration of 1 mg/mL. The binding constant (K1-NPN) of the fluorescent probe (1-NPN) with the recombinant CpunPBP3 was firstly measured in the fluorescence displacement assay, and the dissociation constant of the CpunPBP3/1-NPN complex was calculated as 10.41 μmol/L, based on the binding curve and Scatchard plot (Fig. 7: A). The binding affinity of the recombinant CpunPBP3 to sex pheromones was measured and revealed that the fluorescence intensity of the protein declined with increasing of sex pheromone concentration (Fig. 7: B). The Kivalues indicated that the recombinant CpunPBP3 had a similar binding affinities toE10-16∶Ald (Ki=9.267) andZ10-16∶Ald (Ki=8.656) (Table 1).
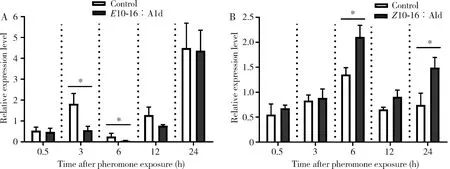
Fig. 5 Effects of sex pheromones E10-16∶Ald (A) and Z10-16∶Ald (B) on the expression levelof CpunPBP3 in the antennae of male adults of Conogethes punctiferalisThe treatment doses of E10-16∶Ald and Z10-16∶Ald are 150 ng and 6 ng, respectively. Data in the figure are means±SD. Asterisk above bar indicates significant difference (P<0.05, t-test) in the gene expression level between the pheromone treatment group and the control group (without exposure to sex pheromone).

Fig. 6 SDS-PAGE analysis of the recombinantCpunPBP3 of Conogethes punctiferalisM: Protein molecular mass marker; 1: Sediment after sonication; 2: Purified recombinant CpunPBP3; 3: Supernatant after sonication; 4: Control (protein without IPTG induction); 5: pET-30a (IPTG induction).
4 DISCUSSION
The sequence alignment showed that CpunPBP3 shares high amino acid sequence identity with MvitPBP1 ofM.vitrataand relative high similarity to the other two PBPs, CpunPBP2 and CpunPBP5, ofC.punctiferalis(Fig. 1). The 3 PBPs fromC.punctiferalisclustered in different clades in the phylogenetic tree of Crambidae species PBPs (Fig. 2). PBPs of Noctuidae species also cluster into 3 different clades. PBPs within a clade and those in different clades share high and low amino acid sequence identity, respectively (Jinetal., 2014). The relatively high similarity (>40%) among pheromone binding proteins suggests their similar ligand binding specificities. For example, strong binding affinities of CpunPBP2 and CpunPBP5 to two pheromone components,E10-16∶Ald andZ10-16∶Ald were proved recently (Geetal., 2018).

Fig. 7 Binding curves of the recombinant CpunPBP3 to 1-NPN (A) and to two sex pheromones (B)Data in the figure are means±SD. A mixture of the recombinant CpunPBP3 and 1-NPN (both at a final concentration of 2 μmol/L) were titrated with 1 mmol/L methanol solutions of the tested ligands (two sex pheromones) to final concentrations of 0.5-20 μmol/L.
A clear circadian rhythmicity in the expression level ofCpunPBP3 in the antennae of male adults was observed in our study. At 2-8 d post adult eclosion, the expression level ofCpunPBP3 first increased and then decreased (Fig.3), being consistent with the time course of sexual maturation and mating inC.punctiferalis, that occurs from 2 to 9 d post adult eclosion with a peak between 3 and 5 d post eclosion (Kaneko, 1978). The expression level of PBP genes is strongly correlated with pheromone sensitivity in moths (Wanetal., 2015). The high level ofCpunPBP3 expressed in the adult antennae of maleC.punctiferalispresumably facilitates pheromone detection and copulation. Additionally, it should be noted that the scotophase and photophase in the experiment were set oppositely to those of the natural photoperiod for operation convenience. But the influence of such a treatment on the circadian rhythmicity of PBP genes was neglected because the colony ofC.punctiferalisused in this experiment had been reared consecutively under this photoperiod for more than 7 years (>80 generations). Therefore, the results of the gene expression experiment were considered as a normal and natural reflection of the circadian rhythmicity ofCpunPBP3.

Table 1 Binding affinity of the recombinant CpunPBP3to the two sex pheromones
Odorant exposure is known to alter the expression of chemosensory genes in insect antennae. For example, in maleS.exiguaandS.littoralis, sex pheromone stimulation enhanced the expression level of PBP genes in the antennae (Guerrierietal., 2012; Wanetal., 2015). On the other hand, odorant exposure markedly reduced the transcription of odorant receptor genes inDrosophilaantennae (Weidetal., 2015). We examined the effects of sex pheromone exposure on the expression level ofCpunPBP3 in the antennae of male adults ofC.punctiferalisand found thatZ10-16∶Ald induced the expression up-regulation andE10-16∶Ald induced the expression down-regulation (Fig. 5), indicating that the two sex pheromones ofC.punctiferalishad opposite effects on the expression ofCpunPBP3. The mechanisms by which odorants and pheromones modulate gene expression in insect antennae are not well understood. Generally, it was reported that pheromone exposure could up- or down-regulate the transcription levels of PBP genes. However, the mechanisms of such regulation remain much unknown. In our study, the primary objective is to identify pheromone binding protein genes ofC.punctiferalis. Therefore, pheromone exposure experiments were conducted to find the corresponding response of some PBP genes to pheromone stimulus, which indirectly provided evidence of function of those genes in pheromone binding. We actually found the expression level of the PBP3 gene responded oppositely to stimulation of two sex pheromonesZ10-16∶Ald andE10-16∶Ald. This result strongly implicates the function of the gene in binding with two sex pheromones, providing valuable information for us to identify pheromone binding protein genes. As to possible mechanisms of gene expression levels regulated by pheromone stimuli, we speculated that the dosage of odorants and exposure time might influence transcription of the gene. In our study, the exposure time ofC.punctiferalisadults toZ10-16∶Ald andE10-16∶Ald was the same (2 min). The only difference between the two sex pheromones was their doses, which was based on the natural amounts present in the female pheromone gland, whereE10-16∶Ald was identified as the major component, andZ10-16∶Ald the minor one (a ratio of two components was 95.5∶4.5) (Xiaoetal., 2011).
The fluorescence displacement binding assay is an effective tool for evaluating the binding affinity of proteinsinvitroand is often used to identify PBPs in insect species (Banetal., 2002). Meanwhile, the pheromone induction experiment can provideinvivoevidence for the pheromone-binding function of PBPs. In this study, we combined both methods to identify PBP3 gene inC.punctiferalis. Our findings therefore have potential applications in the development of pest control strategies for yellow peach adult that involve the disruption of mating by targeting PBPs.
