Chassis trafficability simulation and experiment of a LY1352JP forest tracked vehicle
2021-04-30ShufaSunJinfengWuChunlongRenHualinTangJianweiChenWenliangMaJiangweiChu
Shufa Sun · Jinfeng Wu · Chunlong Ren ·Hualin Tang · Jianwei Chen · Wenliang Ma ·Jiangwei Chu
Abstract Based on the analysis of complex terrains and current forest transportation equipment, a forest tracked vehicle prototype LY1352JP was developed. The road model and the virtual prototype of the chassis were constructed using dynamic simulation software RecurDyn. The optimal tension of the vehicle as well as its capabilities for crossing trenches, climbing vertical walls, uphill and downhill slopes were simulated. The simulation results showed that the optimum tension force of the chassis of the vehicle was 63 kN (kilonewton), accounting for 45% of the total vehicle weight. The maximum trench crossing width and vertical obstacle climbing height were 1.35 m and 0.45 m, respectively. The maximum uphill and downhill angles were 50°and 45°, respectively. Tests on the prototype capacity for crossing trenches, and uphill and downhill driving were carried out. The test results were in agreement with the simulation results. A cross-country performance of a f ire truck based on the tracked vehicle chassis was conducted in an old-growth forest. Tests verif ied that the vehicle has a strong forest trafficability performance and can meet the needs for forest transportation.
Keywords Tracked vehicle · Chassis · trafficability ·RecurDyn dynamics simulation
Introduction
Forestry mechanization is an inevitable trend of modern forest management. Forest tracked vehicles can cope with complex terrain conditions. Presently, most Chinese forest tracked vehicles are ref itted from military armored vehicle chassis such as the “SXD09” multi-functional tracked f ire truck developed by JIANGLU Mechatronics Group Co.,Ltd. (Xiangtan, Hunan Province) and the all-terrain doublesection tracked truck developed by Hayi Machine Co., Ltd.(Harbin, Heilongjiang Province) (Lan 2017). Outside China,there is Bv206 series of multi-section tracked all-terrain vehicles produced by the Swedish Alves Hergelon Company and the Mustang all-terrain double-section tracked vehicle produced by the Singapore Technological Power Company(Sun et al. 2019). However, Chinese vehicles are insuffi -ciently optimized structurally and have limited adaptability to forest terrain. Foreign models are expensive and often have high maintenance problems and are seldom introduced into forested areas of China.
The trafficability of forest vehicles is an important indicator of their adaptability in forested areas, especially in diffi cult terrain. The chassis is a signif icant structure inf luencing the trafficability of forest vehicles. At present, selfdeveloped vehicle chassis for rough forest terrains are still relatively rare in China (Zhao et al. 2018). The chassis of the Skidding Tractor-50 was made in the 1950s and although it has good trafficability, with the implementation of the Natural Forest Protection Project in 1998, the main function of the machine cannot meet the requirements of forested areas.The LY1352JP chassis developed by the team has been constructed on the basis of Skidding Tractor-50 chassis. It maintains the excellent navigability of the original vehicle and improves the load-carrying capacity. The chassis has a complex structure and involves multi-system cooperation. In the process of transformation, virtual prototyping technology(GöKdere et al. 2002; Zu et al. 2004; Zhang et al. 2009; ALMilli et al. 2010) and RecurDyn software (Rubinstein and Hitron 2004; Ma and Perkins 2006; Bo 2009; Janarthanan et al. 2012; Mocera and Nicolini 2018) were used to analyze the vehicle indices on climbing, obstacle crossing and trench crossing. The experimental prototype was also validated in forested areas, and the results show that the chassis of the LY1352JP tracked vehicle has superior trafficability and can be an ideal chassis for various types of transport in forested areas.
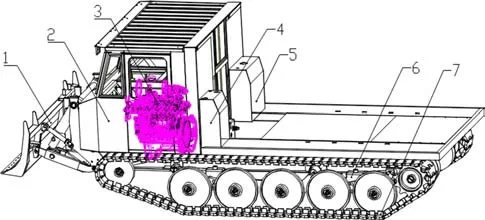
Fig. 1 Structure of the LY1352JP chassis. 1. Cowcatcher, 2. cab, 3.engine, 4. oil tank, 5. diesel tank, 6. elastic suspension, 7. walking mechanism
Materials and methods
Chassis parameter selection
The chassis of the LY1352JP tracked vehicle is composed of a cowcatcher, cab, diesel engine, oil and diesel tanks,elastic suspension and a walking mechanism (Fig. 1).
The structural parameters of the chassis can be categorized into three types: geometric dimension parameters,dynamic performance parameters, and work related parameters. Based on the comprehensive analysis of the road data for the forested area, the chassis size and the relevant parameters of the Skidding Tractor-50 (Sun and Pu 1982;Huang et al. 2003), the overall design parameters of the chassis were determined (Table 1).
Tracked device structure
The chassis walking structure of the tracked vehicle includes the track, tensioning wheel and tensioning device, leaf spring of the front shock absorber, supporting wheelset, balance rod, auxiliary spring, leaf spring of the rear shock absorber, driving wheel and other mechanisms (Fig. 2). The driving wheel of the track is connected with the rear axle by the rear mounted structure. The leaf springs of the front and rear shock absorbers are connected to the main frame of the vehicle, the suspension is connected to the group of supporting wheels via a balance rod.This structure can Effectively absorb the vibration of the track to reduce the jolting of the vehicle. The tensioning wheel provides proper pre-tension force to keep the track tight during the running process, which prevents excessive vibration-induced derailment.
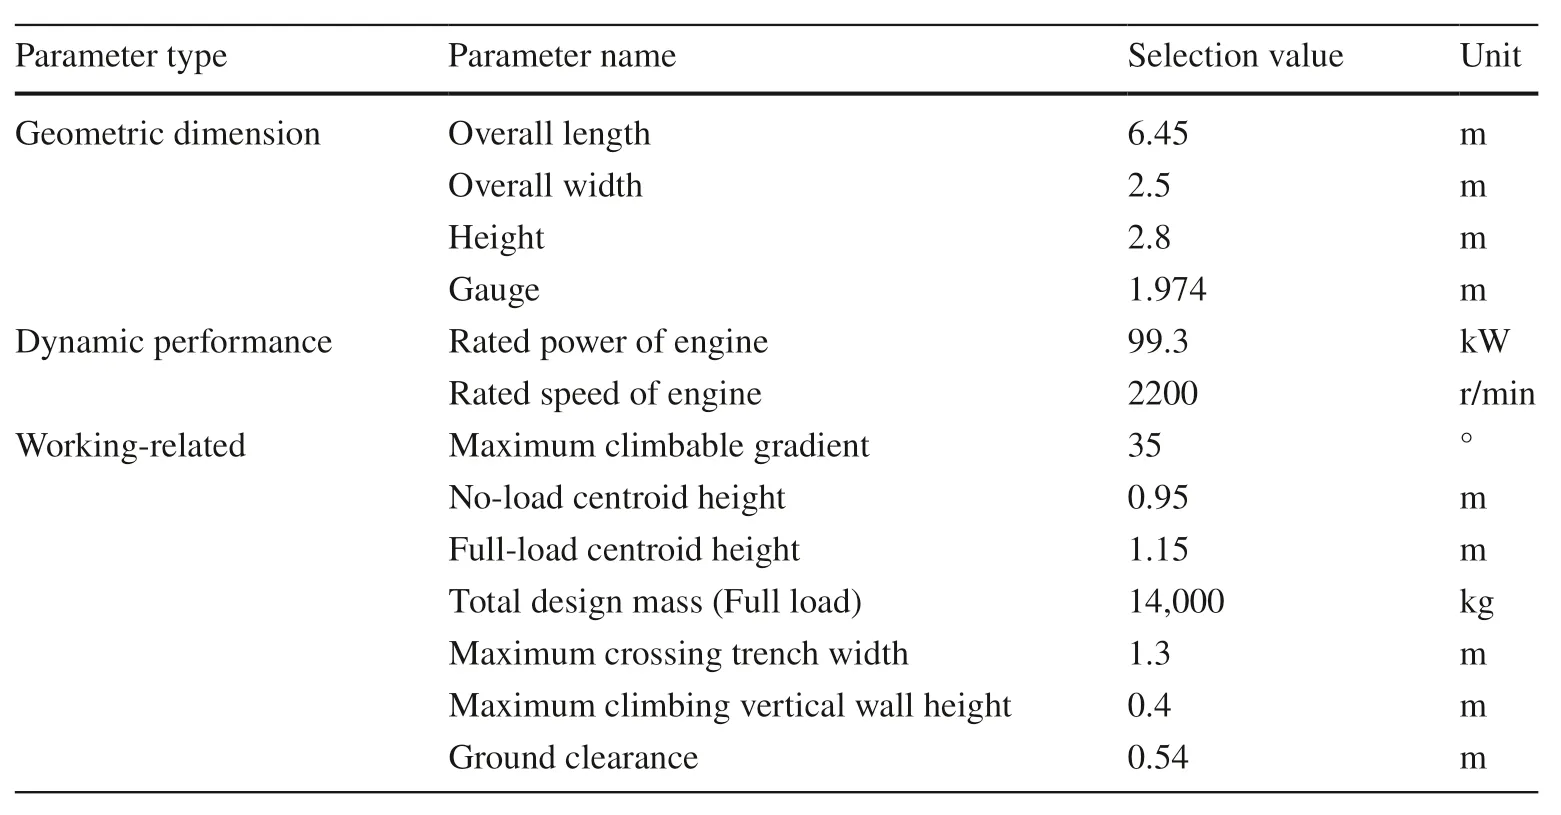
Table 1 Parameters of the LY1352JP chassis

Fig. 2 Structure of the LY1352JP chassis track unit. 1. Track, 2. tensioning wheel, 3. tensioning device, 4. front shock absorbing leaf spring, 5.supporting wheel, 6. balance rod, 7. auxiliary spring, 8. rear shock absorber leaf spring, 9. driving wheel
Establishment of road model
Because of diff erent ground characteristics, the vehicle has diff erent mechanical models (Riggert et al. 2016; Edwin et al.2018). Many ground models are provided in RecurDyn, and the interaction between track and ground forces is diff erent under diff erent road conditions. In RecurDyn, the formula of contact impact force under hard ground condition is as follows:

whereFis contact impact force,kthe ground stiff ness,zthe amount of settlement,cthe ground damping, andnis an exponent of soil deformation.
A soft ground model can record the process of track and ground action. There is a force between each track board and the ground, and the calculation and recording of the force are completed by relevant programs. The formula for calculating soft ground follows Bekker ( 1969):

wherepis ground pressure,kcis cohesive modulus of soil deformation,bis track shoe width,kφis deformation modulus of soil internal friction angle,zis amount of settlement; andnis exponent of soil deformation.
Equation 2 calculates the continuous loading process.For the unloading-loading cycle, the calculation formula is(Wang et al. 2013):wherepis ground pressure;puis unloading pressure;k0and

Auare response parameters of soil to cyclic loading;zuis settlement before unloading commences.
Based on roads in forested areas and the analysis of soil structure (Bekker 1969), two parameter systems, a hard ground model and a soft ground model, were proposed. Figure 3 shows the parameter settings in RecurDyn.
Results
Establishment of virtual prototype
The assembly drawing is loaded into RecurDyn software to obtain the virtual prototype model (Fig. 4).
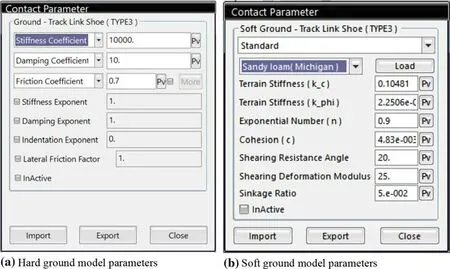
Fig. 3 Parameter settings of ground model in RecurDyn
Constraint commands in the “Professional” menu are used to establish the constraints among each other, i.e., the setting of constraint pairs. The relationships among components are shown in Table 2.
Multi-body dynamics analysis of virtual prototype
The dynamics simulation of the chassis of the LY1352JP tracked vehicle was carried out. The “Step” smooth transition curve function in RecurDyn can avoid sudden change and achieve the goal of uniform acceleration and deceleration. “Step (x,x0,h0,x1,h1)” is the expression of this function, where “x” is an independent variable, basically a function of time, wherex0is the start time;x1is the end time;h0is the start speed;h1is the end speed.
Driving simulation under diff erent tension forces
To reduce track vibration and maintain normal contact between the track and the wheels, pre-tension forces are applied to the track. When track tension is insuffi cient, the track will jolt violently and easily cause the wheel to fall off . When track tension is too large, the wearing of the track and the driving wheel will be serious and will aff ect the service life of the vehicle. Pre-tension forces are calculated according to empirical formulas, and a certain proportion of vehicle weight is usually selected (Ge et al. 2016). Based on the weight of the vehicle, the driving simulation was carried out under a pre-tension force of A = 42 kN (30% of the weight), B = 63 kN (45% of the weight) and C = 84 kN (60%of the weight). This simulates the vehicle’s straight state on ordinary roads, so the hard road model is adopted, and the“Step” function is employed as the driving function. The centroid pitch angle of the vehicle, yaw rate and dynamic track tension under diff erent pre-tension forces are obtained by simulation, as shown in Fig. 5.
The ride comfort of the LY1352JP tracked vehicle can be measured by the centroid pitch angle. From Fig. 5 a, it can be seen that the f luctuation of vehicle centroid in curves A and C are relatively large, which shows that the jolt of the vehicle was greater under these two pre-tension forces.Curve B f luctuates little in the acceleration stage, indicating the pre-tension force of 63 kN (45% of the vehicle weight)is the optimum of the three. Figure 5 b shows that when the tension was small, the yaw rate f luctuated greatly; as the tension force increased, yaw rate f luctuation decreased. The waveform and amplitude of curves B and C are basically the same, indicating that 63 kN (45% of the vehicle weight) and84 kN (60% of the vehicle weight) are the preferred options.With the increase in pre-tension force, the dynamic tension force of track increased gradually, as shown in Fig. 5 c. The dynamic tension in curve A is small, and there is a risk of wheel shedding under this condition. The dynamic tension in curve C is larger which will aggravate the wear and tear of the track and easily cause breakage, indicating the pretension force of 63 kN (45% of the vehicle weight) is the preferred option. Through comprehensive analysis, it can be concluded that 63 kN (45% of the vehicle weight) is the pre-tension force of the track.

Fig. 4 Virtual prototype of the LY1352JP chassis

Table 2 Relationship among constraints in RecurDyn
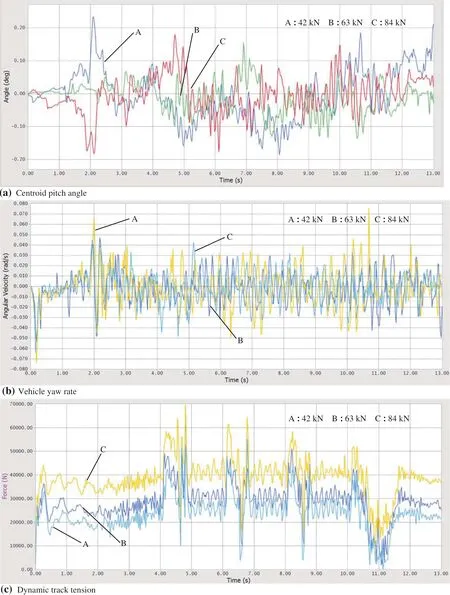
Fig. 5 Dynamics simulation of the LY1352JP chassis under diff erent pre-tension forces
Simulation of trench crossing
Trenches are common obstacles encountered by vehicles when performing tasks in forested areas. Trench crossing capacity is an important parameter to measure a vehicle’s ability to surmount obstacles. According to the driving mode and relevant parameters of tracked vehicle, a trench- crossing model of the tracked vehicle was developed (Hei et al. 2010;Janarthanan et al. 2012; Liu et al. 2014) and a dynamics simulation of the chassis of the LY1352JP trench-crossing state was carried out. Trench crossing can be divided into three stages (Fig. 6). In the f irst stage, the center of gravity of the vehicle is above the road surface in front of the trench.In the second stage, the center of gravity is above the trench,and in the third stage, it is on the road behind the trench. The spanning ability of the tracked vehicle can be determined when the vehicle drives at a uniform low speed without falling into the trench.
The “Step” function is used to drive the chassis of tracked vehicles with “Step (time, 1, 0, 3, 10)”, “Step (time, 1, 0, 3,20)” and “Step (time, 1, 0, 3, 30)”, respectively. This indicates that the tracked vehicle accelerated from one second to three seconds to 10 rad/s (“rad” is the radian), 20 rad/s and 30 rad/s, respectively, and crossed the trench at a uniform speed. The simulation time was 15 s and the simulation step was 1500. Since the forest soil was soft, the soft ground model was used in this part of the simulation (Bekker 1969;Park et al. 2008). The pre-tension force was set to 63 kN.Through the establishment of trench models with diff erent widths, the ultimate trench crossing width of the tracked vehicles was simulated. The stepped trench widths were set to 1.10 m, 1.20 m, 1.25 m, 1.30 m, 1.35 m, and 1.40 m. The simulation results are shown in Table 3. When the vehicle speed was 10 rad/s and the width of the trench was 1.25 m,the tracked vehicle crossed the trench; when the vehicle speed was 20 rad/s and the width of the trench was 1.30 m,it crossed the trench; when the speed was 30 rad/s and the width of the trench was 1.35 m, it crossed again. This shows that the tracked vehicle has the ability to cross trenches, and such ability is related to speed. The limited trench crossing width of the tracked vehicle was 1.35 m.
Simulation of vertical wall climbing
The obstacle-surmounting ability of a vehicle is characterized by the maximum height at which it can smoothly pass through a vertical obstacle. According to the actual climbing ability of the vehicle, the whole obstacle surmounting process can be divided into three stages (Shen et al. 2009; Janarthanan et al. 2011; Ata and Oyadiji 2014). Stage 1: In Fig. 7 a, the guide wheel of the tracked vehicle contacts the edge of the vertical wall, at which time the vehicle starts to cross the barrier under the action of traction. Stage 2: In Fig. 7 b, with an increase in height of the guide wheel, the angle between the ground and the chassis of the tracked vehicle gradually increases, and the center of gravity of the vehicle main body continuously increases. As the vehicle moves forward, the center of gravity of the main body is just above the edge of the step. Stage 3: In Fig. 7 c, the center of gravity of the vehicle passes over the vertical wall edge. At this point,the tracked vehicle returns to the horizontal plane, having successfully climbed the obstacle.

Fig. 6 Trench crossing process

Table 3 Trench crossing at diff erent speeds
The soft ground model was used to simulate actual forest road conditions. The rotation function of the driving wheel was set at: “Step (time, 1, 0, 2, 20)”, “Step(time, 1, 0, 2, 15)”, “Step (time, 1, 0, 2, 10)”. The vertical wall height was set at 0.30 m, 0.35 m, 0.40 m, 0.45 m,and 0.50 m. The simulation time was set at 10 s and the simulation step to 100. Table 4 shows the vehicles passing through vertical walls at various heights. The tracked vehicle climbed the 0.45 m obstacle at 10 rad/s of driving wheel speed, the 0.40 m obstacle at 20 rad/s and climbed the 0.30 m obstacle at 30 rad/s. The obstacle-surmounting ability of the tracked vehicle is good and is related to the speed. Therefore, the limited vertical wall climbing height of the tracked vehicle is 0.45 m.
Performance simulation of uphill and downhill drive
Due to often hilly terrain in forested areas, the simulation of uphill and downhill drive performance of the LY1352JP tracked vehicle virtual prototype was carried out (Fig. 8).Considering that the vehicle needs a large traction force when climbing slopes, a low gear will be used. The speed for uphill drive was at 5 rad/s, and for downhill drive at 1 rad/s.The pre-tension force force of the track was set at 63 kN. The soft ground model was used as the ground model. Slopes were set at 25°, 30°, 35°, 40°, 45°, 50°, and 55°. The simulation results are shown in Table 5. The limited gradient of the tracked vehicle is 50° in uphill driving and 45° in downhill driving.
Test analysis

Fig. 7 Vertical wall climbing process

Table 4 Experiment results of vertical wall climbing

Fig. 8 Simulation of uphill and downhill drive of the LY1352JP at a slope of 25°

Table 5 Angle of passing slope

Fig. 9 Trench crossing experiment
The research reported in this paper can divided into two stages.In the f irst stage, the chassis of the tracked vehicle was evaluated for trench crossing, vertical wall climbing and downhill tests in Harbin Yushu test f ield March 2019. In the second stage, the cross-country performance test was conducted in the Northern Primitive Forest Region of the Great Xing’an Range,Inner Mongolia July 2019.
Experiments on trench crossing
The vehicle’s performance when crossing trenches of diff erent widths under Gear I and Gear II were tested (Fig. 9; Table 6).Gear I and Gear II provide suffi cient traction to prevent the vehicle from falling into trenches, and were therefore selected as the experimental gear positions. The vehicle crossed the trench in Gear I but failed to complete the crossing at 1.2 m width. When Gear II was used, 1.3 m wide trench could not be passed. The error between the experiment and simulation results is 3.7%.
Uphill drive test
The uphill drive results at diff erent slopes under Gear I and Gear II are shown in Fig. 10.
When the tracked vehicle used Gear I, the uphill time was barely aff ected by gradient < 45°. The uphill time peaked at 48°. When the tracked vehicle used Gear II, the vehicle failed to climb the lower slope due to a lack of traction. The maximum climbing slope was 48° and the error was 4.0% compared with the maximum angle of 50°in simulation.
Downhill drive test
The results of the downhill drive test with Gear I and Gear II are shown in Fig. 11.
The turning point was the 35° slope. Before this, the vehicle ran smoothly in either Gear I or Gear II. When the gradient was > 35° or < 43°, the downhill test was not carried out with Gear II for safety reasons. Although there was a slide tendency in the downhill drive test with Gear I, the vehicle could be braked slowly. The limited slope in the experiment was 43° while in the simulation, it was 45°an error rate of 4.4%.
Cross-country performance test in an old-growth forested area
The cross-country performance test was carried out in the Northern Primitive Forest Region of the Great Xingʹan Range in Inner Mongolia. The old-growth forest is a mixed coniferous and broad-leaved forest belt with various tree species and spacings between 1 and 3 m. In this forested area, the terrain is relatively undulating, with dense forests, mountain rivers, meadows and swamps.
The results show that the tracked vehicle can lay a temporary road and clear meadow soil with a thickness of more than 0.3 m (Fig. 12 a, b). It can push over coniferous trees less than 0.25 m in diameter (Fig. 12 c). The depth of the river through which it passes is 0.7 m (Fig. 12 d). It can pass between bush and dense forests where the spacing is less than the width of the vehicle (Fig. 12 e, f).

Table 6 Results of trench crossing experiment
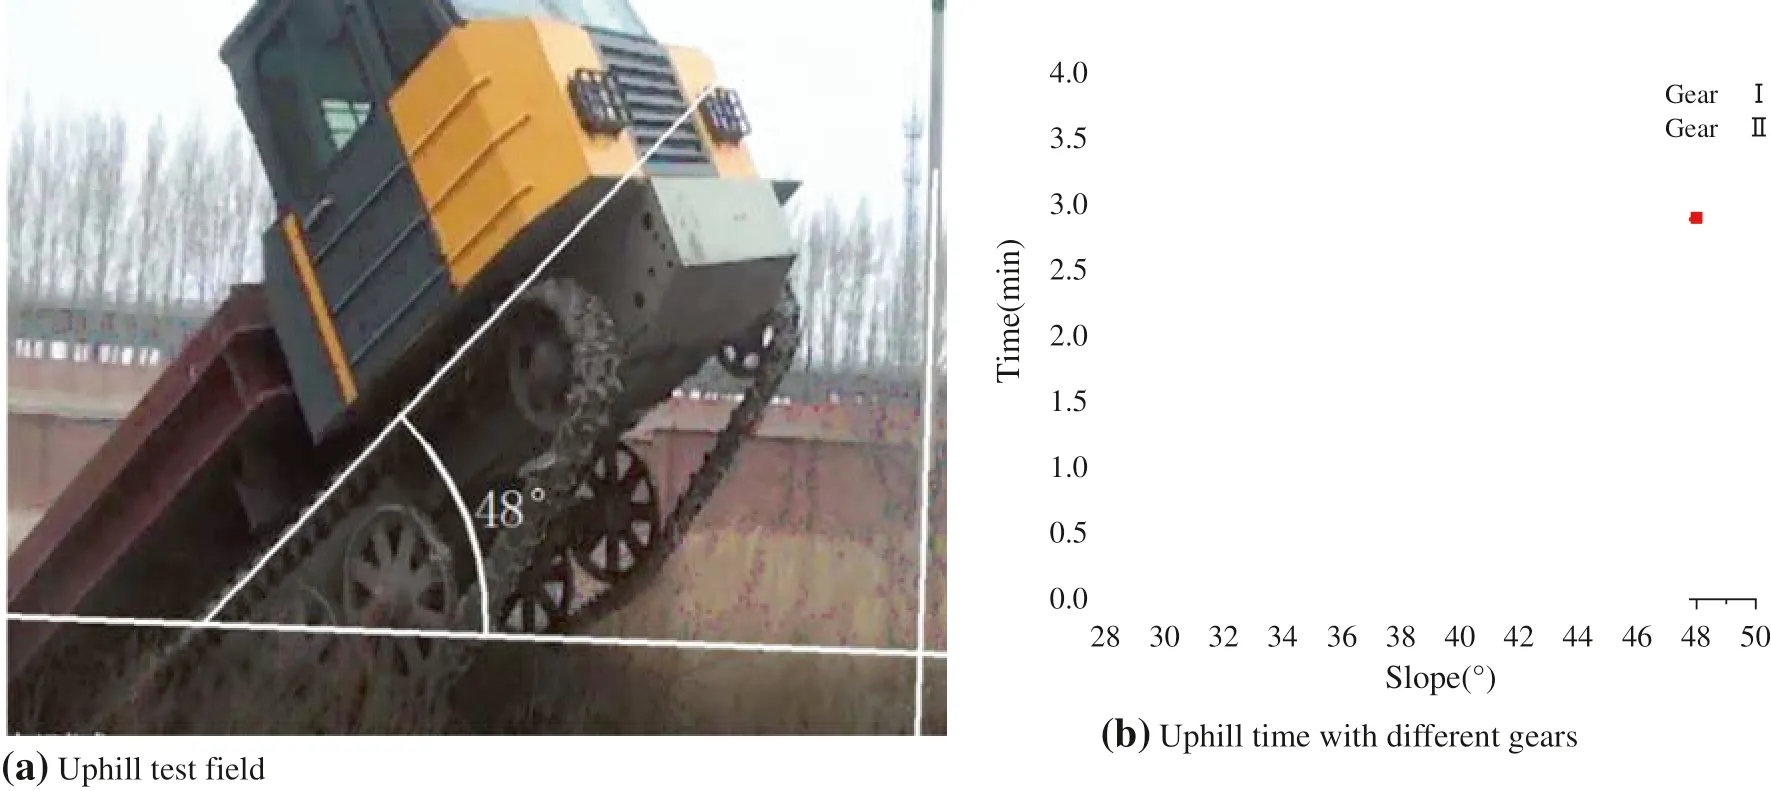
Fig. 10 Uphill test

Fig. 11 Downhill test
Conclusions
A chassis of the LY1352JP forest tracked vehicle was designed and manufactured and the multibody dynamic software RecurDyn was used to simulate and analyze the chassis properties. The results were in good agreement with the simulation values. The following conclusions can be drawn:
(1) Based on the characteristics of the forest terrain, the chassis parameters were determined, and a type of crawler transport vehicle for forest was designed. The road model and the virtual prototype of the chassis of the proposed vehicle were constructed using dynamic simulation software RecurDyn;
(2) Dynamics simulations were conducted to analyze the optimum tension force for the LY1352JP tracked vehicle, as well as the vehicle’s performance in trench crossing, vertical obstacle climbing, and uphill and downhill driving. The results show that the optimum tension force was 63 kN (45% of the vehicle weight),the limited trench crossing width was 1.35 m, the limited vertical obstacle climbing height was 0.45 m, the limited climbing angle was 50° and the limited downhill angle was 45°.
(3) According to the simulation results, the prototype of the LY1352JP was trial-produced. Experiments on trench crossing, climbing up and down slopes of the prototype were carried out on the test site. The results show that the maximum trench crossing width was 1.3 m, the climbing slope limit was 48°, and the downhill slope limit was 40°. The experimental results were in good agreement with the simulation analysis.
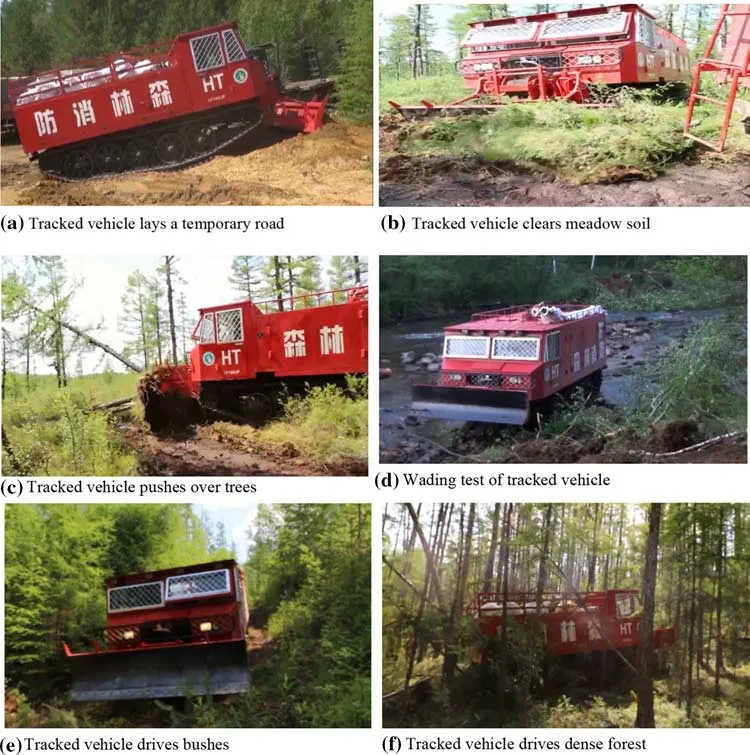
Fig. 12 Cross-country performance test of tracked vehicle in old-growth forested area
(4) The cross-country performance of a f ire truck based on the tracked vehicle chassis was conducted in the northern old-growth forested area. The results show that the tracked vehicle can lay a temporary road and clear meadow soil with a thickness of more than 0.3 m and can push over conifers < 0.25 m in diameter. The depth of the river through which it passes is 0.7 m. It can pass between bush and dense forests where spacing is less than the width of the vehicle.
Publisher’s NoteSpringer Nature remains neutral with regard to jurisdictional claims in published maps and institutional affi liations.
杂志排行
Journal of Forestry Research的其它文章
- Sacred groves of India: repositories of a rich heritage and tools for biodiversity conservation
- Relationship between H 2 O 2 accumulation and NO synthesis during osmotic stress: promoted somatic embryogenesis of Fraxinus mandshurica
- Changes in leaf stomatal traits of diff erent aged temperate forest stands
- Somatic embryogenesis and plant regeneration in Betula platyphalla
- Hydrogen peroxide as a systemic messenger in the photosynthetic induction of mulberry leaves
- Production and quality of eucalyptus mini-cuttings using kaolin-based particle f ilms
