Dynamical evolution of cross phase of edge fluctuations and transport bifurcation
2021-04-22XueyunWANG王雪韵ZhenyuZHOU周振宇ZhuoyiLI李卓懿andBoLI李博
Xueyun WANG(王雪韵),Zhenyu ZHOU(周振宇),Zhuoyi LI(李卓懿) and Bo LI(李博)
1 School of Physics,State Key Laboratory of Nuclear Physics and Technology,Peking University,Beijing 100871,People’s Republic of China
2 School of Physics,Beihang University,Beijing 100191,People’s Republic of China
Abstract The dynamical evolution of edge turbulence during a transport bifurcation is explored using a flux-driven nonlinear fluid model with a geometry relevant to the plasma edge region.The simulations show that the self-generated mean shear flows can dramatically modify the phase angle between turbulent fluctuations.The changes in phase differences and amplitudes of edge fluctuations give rise to the modifications of turbulent edge transport.The statistical properties of flux and fluctuations are also investigated before and after edge shear flow generation.
Keywords:plasma turbulence,plasma edge transport,plasma simulation
1.Introduction
The study of turbulence and transport due to the curvaturedriven modes is of high interest because they are believed to play a central role in the edge region of magnetic confinement devices[1-4].The topic is of great importance to the fusion community because edge turbulence largely governs the overall confinement performance of tokamaks and similar machines.The edge region,comprising the transition zone from the inner,hot core plasma to the outer,cold scrape-off layer(SOL),exerts vital control over the plasma discharge through its role in the L-H(low-high confinement)transition[5],and the formation of the edge pedestal.Considerable efforts in experiments[6-12],theoretical modeling[13-16],and nonlinear simulations[17-25]have been devoted to the understanding of transport-reduction mechanism in L-H transitions.In particular,the nonlinear energy transfer during the transition process has been experimentally studied[6-9],and the limit cycle oscillations before a transition have been observed in the edge region of tokamak experiments[10-12].Radial profiles of fluctuations and velocities have also been measured in the edge transition region where the plasma is crossing the last closed flux surface(LCFS)[26-28].
The generation of mean E×B shear flow in the edge region is believed to be responsible for quenching turbulent transport and further triggering the formation of plasma edge transport barriers[29].On one hand,the fluctuation levels can be suppressed by strong mean shear flows,which directly limit the amplitudes of turbulent fluxes.On the other hand,mean shear flow may modify the phase angle between the fluctuations,whose correlation drives a turbulent flux and determines the direction of radial flux.These effects of E×B shear flows on turbulence and its transport play an important role in turbulence suppression.The changes in turbulent transport through the modificaton of cross phase of fluctuations in frequency domain have been investigated in the experiments where the plasma flows are self-generated through the interaction with turbulence[30],and in the experiments where the shear flows are controlled externally by biasing voltage[31].The effects of strongly sheared flows on the cross phase between turbulent fluctuations in wavenumber space have been studied theoretically[32-34].The impact of phase dynamics on transport has also been explored in numerical simulations of the edge localized modes[35]and the biasing-induced transport reduction[36].However,the nonlinear simulation of phase dynamics during the transitions between low and high confinement modes has not been reported.The interaction between fluctuation phases and mean shear flow still requires more detailed investigation.
In this work,we present self-consistent nonlinear simulations of fluctuation-induced transport bifurcation in plasma interchange turbulence.The simulations are carried out in a poloidally and radially localized domain at the outboard midplane of toroidal plasma devices.In particular,radial computational domain is across the LCFS to explore the interaction between the plasma edge and SOL.We consider the edge region of a plasma column full of bad curvature of magnetic field line,which is relevant to the edge bad-curvature region of toroidally confined plasmas.Parallel losses are introduced through sheath boundary conditions in the SOL region.This produces plasma pressure gradients at the LCFS that drive the pressure-driven interchange instability.The simulations evolve full profiles of the various quantities without separation of equilibrium and fluctuations.In the simulations,the mean E×B shear flows are self-generated just inside the LCFS through the fluctuation-induced nonlinear energy transfer[22].Previously,we have shown the existence of two transport regimes(L and H regimes)for plasma interchange turbulence[22,37,38].The L and H regimes refer to the state with weak and strong mean flows,respectively.Steeper gradients are formed at the plasma edge in the pressure and density profiles in H-regime[22].Here,we examine the role of the phase angles between fluctuations in the fluctuation-induced nonlinear transport bifurcation.We focus on the time evolution of the transport cross phase and self-generated shear flows,as well as their interaction on the turbulence suppression.The dynamics of cross phase and fluctuation levels are explored throughout the forward and back transitions.The statistical properties of turbulent flux and fluctuations in the two transport regimes are also compared to further explore the impact of mean shear flow generation.
2.Model equations
The simulation model is based on the drift-reduced Braginskii equations with ion pressure dynamics[39].For simplicity,we consider the pressure-driven electrostatic instability with parallel wavenumbers k‖≃0.The geometry used in the simulations is a two-dimensional(2D)plane perpendicular to the equilibrium magnetic field.The 2D computational domain is radially localized at the plasma outer boundary on the low field side and poloidally localized at the midplane of a toroidally confined plasma.Since the variation of magnetic field is much slower,the changes in plasma profiles,the curvature and strength of the equilibrium magnetic fields are assumed to be constant across the computational domain.The equilibrium field is assumed to be dominated by the toroidal component,and the curvature radius of magnetic filed lines is given by the major radius from the torus axis.The simulated geometry does not describe the full equilibrium magnetic configuration such as the shape of cross sections.The fieldaligned coordinates are used in the simulations.The parallel coordinate z is in the direction of the equilibrium magnetic field.The transverse coordinates x,y correspond to local radial and poloidal variables.The time(t),perpendicular(x,y),and parallel(z)normalization scales are t0=a/cs,ρs=cs/Ωi,and Lcthe connection length of field lines,whereis the sound speed and Ωiis the ion gyrofrequency.The normalized nonlinear equations for the perpendicular dynamics of the total plasma density,pressure,and vorticity are[22]

where the Laplacian has the formwhen applied at the outer midplane in field-aligned coordinates[17].The effects due to the curvature of magnetic field lines are included in the curvature terms of the model equations:where R is the curvature radius of field lines.The convective derivatives are written in the conservative form

where vx=−∂φ/∂y and vy=∂φ/∂x are the radial and poloidal components of normalized E×B velocityin units of cs.Equation(2)in our 2D model assumes the adiabatic closure,d(p/nγ)/dt=0 for the plasma pressure,where γ=5/3.We note that this adiabatic approximation and the assumption of electrostatic flute-like mode may not be valid for comparison with the L-H transition experimentally observed in tokamak plasmas.The ion pressure term in the generalized vorticity results from the diamagnetic velocity part in the ion polarization current[40,41].Thus,the gradients of plasma potential and pressure are coupled through equation(4).This coupling is vital to realize transport bifurcation in our nonlinear simulations.The input flux is introduced from source terms SE,Snthat are localized near the inner boundary.In the SOL region,sheath boundary conditions are applied in the parallel direction:parallel flowsand parallel currentswith[42,43].Thus,the sheath terms are added into model equations for the SOL region with σ=a/Lcthe normalized loss rate due to the sound-speed parallel flows to the ends of open field lines.Dirichlet boundary conditions are imposed at the inner and outer boundaries.Periodic boundary conditions are assumed in the poloidal y direction.The nonlinear fluid equations are solved by a finite-difference turbulence code.The numerical algorithm used in our code is described in section 3.The simulation parameters are a/ρs=100,a/R=0.3,σ=0.015,and Λ=3.Note that the perpendicular diffusion coefficients are taken to be the same for three field variables n,p and w,and specifically the values of the coefficients used in the nonlinear simulations μ=1 in units ofare small compared to Bohm diffusion ρscsby a factor of ρs/a ≪1.
3.Numerical algorithm
We have developed an explicit time-dependent code for the solution of coupled,nonlinear equations(1)-(3)on uniform,rectangular grids in the(x,y)plane.All of our equations are of the form
where F=vψ is the flux and v is the velocity.The dominant nonlinearities in the equations arise from the convective terms,which are written in the conservative form.The second-order,centered-difference expression is used for the divergence of flux.The diffusive terms are centrally different to second-order accuracy.The explicit time stepping scheme is a second-order trapezoidal leapfrog algorithm[44]
where i labels the discrete time.Since the vorticity is evolved in equation(3),we obtain the potential at each time step by the matrix inversion of the Poisson equationwhere Φ=φ+p.Fourier transforming this equation in y gives
This equation in the finite-difference form can be inverted using a standard tridiagonal solver.Then inverse Fourier transform in y gives Φ(x,y)and the potential is given by φ=Φ−p.
4.Simulation results
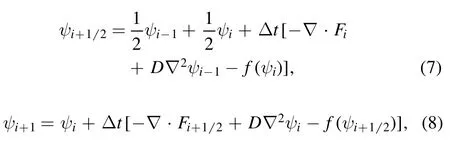
The curvature-driven interchange instability is triggered by sufficient pressure gradients at the LCFS.As the system evolves,interchange modes saturate in the nonlinear phase and the L-regime turbulent state is reached with quasi-stationary plasma profiles.Figure 1 shows the poloidal-averaged potential signals at two different radial locations just inside the LCFS.In the quasi-stationary nonlinear L-regime(t=70−110),the two signals oscillate in phase and only have slight difference in amplitude.This implies weak radial gradients of plasma potential and strong radial correlations of potential fluctuations at the plasma edge.
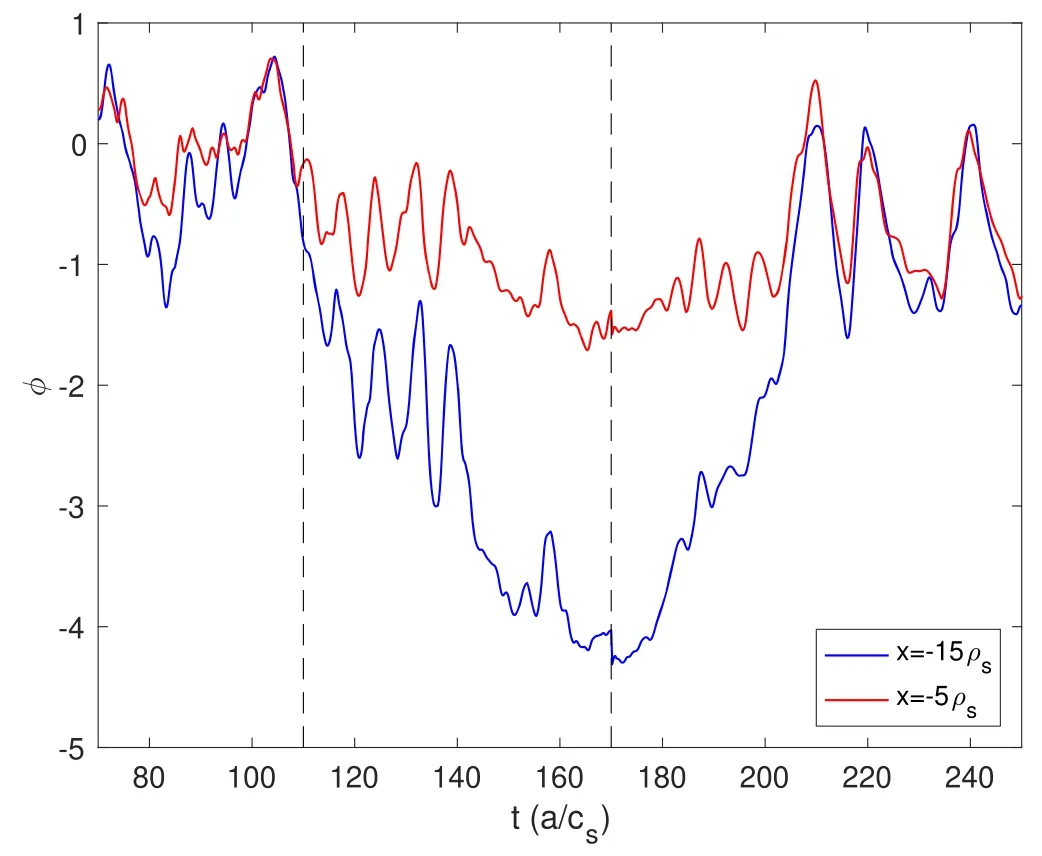
Figure 1.Time evolution of poloidal-averaged potential at x=−15ρs(blue),and x=−5ρs(red).The LCFS is located at x=0.The vertical lines indicate the moments of increasing and decreasing heating power,respectively.
From the L-regime nonlinear state,we increase input power above a certain threshold at t=110.As seen in figure 1,the two potential signals begin to separate and oscillate with higher frequencies,known as the limit cycle oscillation(t=110−140).The strong oscillations of the potential induce the radial electric fields and the associated poloidal flows localized just inside the LCFS.This reveals that the limit cycle oscillation,as a process of relaxation of heating,is strongly correlated to the generation of mean flow shear.After the mean shear flow is fully generated in the H-regime,the differences between the two potential signals approach maximum and the limit cycle oscillation ends.The significant gap between the two potential signals indicates a large radial potential well in the edge region.The simulations show that the radial gradients of electric potential and the resulting radial electric field strongly depend on the magnitude of local heating power,hence on the plasma local temperature.The temperature dependence for generation of edge inward electric field due to ion orbit losses has been studied in[45].
During the state of H-regime,we decrease the input heating power below a certain threshold at t=170.In response to the change of the driven flux from the plasma core,a back transition is eventually triggered at t=180.The two potential signals at plasma edge oscillate faster again and the amplitudes get closer to each other as the mean shear flow gradually disappears in the edge region.After the system returns to L-regime(t≃210),the large-scale fluctuations with strong radial correlations are developed again in the edge region.Comparing the fluctuation level of potential signals before and after the transition,it is obvious that the amplitude of fluctuations in H-regime is much smaller than that in the L-regime,which shows the turbulence suppression in H-regime.
To explore the amplitude and phase evolution of fluctuations during a transition,we write the perturbations in terms of Fourier series,

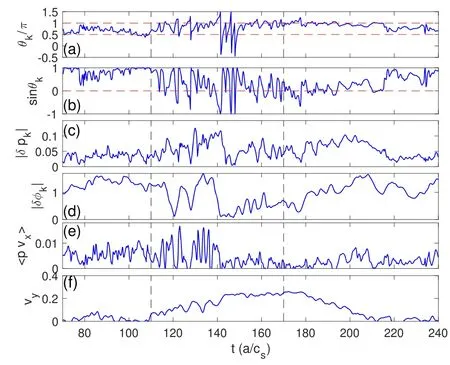
Figure 2.Time evolution of(a)phase angle θk,(b)sin θk,(c)|δpk|,(d)|δφk|,(e)radial flux 〈δ pδ vx 〉and(f)mean poloidal E×B flow vy in the edge region.The vertical lines indicate the moments of increasing and decreasing heating power.

Figure 3.Probability density function(PDF)of radial flux in the edge region in(a)L-regime and(b)H-regime.Here σ is the standard deviation.
where k ≡kyis the poloidal wavenumber.Then the Fourier components of the average radial flux can be written as
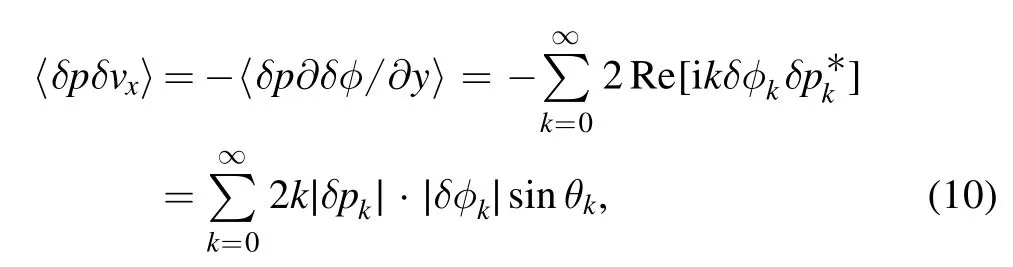
is a combination of the amplitudes of potential and pressure fluctuations and the phase differences between them.The wavenumber we choose for Γkis the dominant poloidal wavenumber of fluctuations in the nonlinear turbulent state.
As seen in figure 2(a),the relative phase angle is mainly oscillating between π/2 and π in the nonlinear L-regime(t=70−110).Correspondingly,sinθ kin figure 2(b)oscillates near the value of one,producing the maximum amount of flux in the outward radial direction.As shown in figures 2(c)and(d),the amplitudes of potential perturbations are large compared to pressure perturbations.The resulting outward turbulent flux in figure 2(e),which consists of all Fourier components of perturbations,fluctuates around a stationary and relatively high level while the mean shear flow vyin figure 2(f)remains small at the plasma edge.
When the limit cycle oscillation(t≃110−140)is triggered by the increase of input power,the phase angles as well as the amplitudes of pressure and potential perturbations exhibit stronger oscillations in response to the increased heating.This induces large-amplitude fluctuations in radially outward energy flux as the edge mean flows begin to grow during the limit cycle oscillation period.The transition occurs at t≃140 when the radial flux gets decreased to a low level.As shown in figure 2,the amplitudes of pressure and potential fluctuations suddenly drop to a low level compared to those just before the transition.Meanwhile,the relative phase angle oscillates dramatically.As the growth of mean shear flow saturates in H-regime,the phase differences between potential and pressure fluctuations eventually change to π so thatsinθ koscillates near zero.As a result,the radial fluxes remain at a low level even though the fluctuation amplitudes start to increase again after the transition.
The back transition(t≃180−210)is characterized by the increase of fluctuation amplitudes and reduction of mean flows in response to a sudden decrease of input power.The final transition to the turbulent state of L-regime occurs when the edge mean flows completely collapse at t≃210.Meanwhile,the phase angle between potential and pressure fluctuations reduces to a value near π/2 that is favorable for outward transport.After the back transition,the amplitude of pressure fluctuations drops because of the decreased heating.In contrast,the potential fluctuations maintain at the high level throughout the back transition.The turbulence phase and mean flow dynamics during the forward and back transitions in figure 2 reveal that the mean E×B flow has a direct impact on the phase angles of fluctuations which determine the direction as well as amplitude of turbulent transport.
We further study statistical properties of average radial flux in the two transport regimes.The probability distribution of flux is calculated from the time series of Γkand the flux is normalized by the standard deviation of the time series.As shown in figure 3(a),the dominant k components of turbulent radial flux in L-regime has a non-Gaussian distribution with a long tail at the positive flux and has a large positive mean value,indicating intermittent,outward transport events.The strong radial flux is related to large-scale convective turbulent eddies in the edge region.In contrast,the distribution of radial flux is changed dramatically in H-regime.As seen in figure 3(b),the probability density function becomes approximately symmetric about the zero value.Thus,the inward and outward fluxes have a nearly equal probability.The deviation of the flux amplitude from the mean is significantly reduced,implying the turbulence suppression.

Figure 4.Maximum value of cross-correlation function as a function of separation distances in(a)radial and(b)poloidal directions.
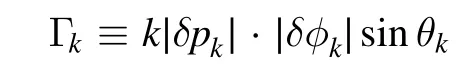
Finally,we examine the correlations of spatial structures.The cross-correlation functions are calculated from the time series of density fluctuations at two different locations just inside the LCFS.The correlation lengths are obtained by measuring the decay of the peak correlation amplitude as a function of separation distance[42].The cross-correlation functions in the radial and poloidal directions are defined as
Here,〈… 〉denotes an average over time.In L-regime,as seen in figures 4(a)and(b),the correlation lengths of fluctuations in the radial and poloidal directions have similar decay lengths λc≃10ρs,which are approximately the size of the large,round eddies in the potential structures.In H-regime,radial correlation lengths of density fluctuations are significantly reduced,indicating the decorrelation of structures in the radial direction.The potential differences in the radial direction induce radial electric fields,which result in the generation of mean E×B flows at the location about 10ρsinside the LCFS,as shown in figure 1.When calculating the poloidal cross-correlation function,we choose the radial location where the flows exist.As shown in figure 4(b),the poloidal correlation length is significantly enhanced at the plasma edge.The enhancement of correlation in the poloidal direction implies the flow generation at the position.Note that the simulations are not compared with experiments due to the limitation of the model discussed earlier.
5.Conclusion
In summary,the dynamical evolution of cross phase and amplitudes of fluctuations during an edge transport bifurcation has been explored from self-consistent nonlinear fluxdriven simulations,focusing on the curvature-driven instability.We find that the generation of mean edge shear flow is strongly correlated with the modification of amplitudes and phase angles of edge turbulent fluctuations.During the transition to a suppressed transport regime,the changes of phase angles become significant as the fluctuation-induced mean shear flows grow at the plasma edge.The mean shear flows act on the amplitudes and phase angles of turbulence through the modification of coherent structures of fluctuations as demonstrated by the changes in the spatial correlations.Our 2D simplified model only describes the electrostatic interchange modes in a toroidal magnetic field with bad curvature.For comparison with the L-H transitions in tokamak plasmas,however,the ballooning modes should be considered for tokamak plasmas with magnetic shear[46,47].We also note that the particle source is fixed in the simulations.However,the change of particle sources would possibly affect the dynamical evolution of the relative phase angle and the mean flow shear,which is for future investigation.
Acknowledgments
We thank Chuankui Sun,Cong Meng,Pengfei Li,Zhijian Xie,Dianjing Liu,and Ao Zhou for help with simulations.We acknowledge extensive discussions with Tianchun Zhou,Guosheng Xu,Jiaqi Dong,and P.H.Diamond.This work was supported by the National Magnetic Confinement Fusion Energy Program of China(No.2018YFE0311300).
猜你喜欢
杂志排行
Plasma Science and Technology的其它文章
- Electric-field induced fluctuations in laser generated plasma plume
- Comparison of emission signals for different polarizations in femtosecond laser-induced breakdown spectroscopy
- Modeling of the impurity-induced silicon nanocone growth by low energy helium plasma irradiation
- High harmonic generation driven by twocolor relativistic circularly polarized laser pulses at various frequency ratios
- Influence of target temperature on AlO emission of femtosecond laser-induced Al plasmas
- Modelling of electronegative collisional warm plasma for plasma-surface interaction process