十次对称二维准晶含II 型Griffith 裂纹的动力学问题
2021-03-30周建敏李联和王桂霞
周建敏, 李联和, 王桂霞
(内蒙古师范大学数学科学学院,呼和浩特 010022)
1 Introduction
The quasicrystal was first observed by Shechtman et al[1]. The stability and service life of quasicrystals are decreased by defects that are inherent or caused by external loads. As commonly used functional and structural materials, the strength and malleability of quasicrystals have become an issue of concern. They are brittle at low temperatures and at room temperature,and the failure of brittle materials is related to the existence and propagation of cracks. Therefore, the study of the problem of fractures in quasicrystals is of great significance and has become the focus of experimental and theoretical research. A large number of meaningful results have been obtained in solving quasicrystal static problems with cracks, especially in the study of analytical solutions[2-9]. For dynamic study, Bak[10,11]believes that the motion mode of both the phonon and phason fields are fluctuation modes. However, Lubensky et al[12]believe that the motion mode of the phason field is a diffusion mode. Others believe that there are both fluctuation and diffusion characteristics in the phason field. Rochal and Lorman[13], for example, give a more general motion mode of the phason field, which has both fluctuation and diffusion terms. Specifically, the phonon field is described by the wave equation and the phason field is described by the telegraph equation,while the telegraph equation can be reduced to the wave equation and the diffusion equation[14].The advantage of the telegraph equation is that it provides the possibility of describing the phason dynamics of all the intermediate values of parameters of the phason. For a system of equations composed of multiple equations described by the wave equation and the telegraph equation,even if restrictions are appended,it is difficult to solve such a problem by general analytical methods.
However, by using numerical methods, not only can the limiting condition of the studied problem be reduced, but also the practical problem can be simulated better.Based on the dynamic model given by Lubensky,Zhu and Fan[15],the wave propagation and diffusion and their interaction through a cracked sample with the finite difference method are revealed. Wang et al[16]used this model and method to study the dynamic response of an icosahedral Al-Pd-Mn quasicrystal with a Griffith crack to impact loading, particularly exploring the phason dynamics. With this dynamic model, Li[17]derived a general solution in terms of two introduced auxiliary functions. By introducing a new auxiliary function, Zhou and Li[18]analyzed a problem of the mode III crack in one-dimensional hexagonal quasicrystals subjected to anti-plane impact loading. Ma et al[19]used the finite difference method to study the dynamic problem of the octagonal two-dimensional quasicrystal with a mode II crack. Chen et al[20]used the finite difference method to study the fracture dynamics problem of the octagonal quasicrystal with a Griffith crack. Based on the dynamic model given by Bak,Hao[21]used the finite difference method to calculate the dynamic stress intensity factor (DSIF) of the mode II crack. Based on the dynamic model of wave-telegraph, Li[22]analyzed the elastohydrodynamics of decagonal quasicrystals and gave a general solution by introducing an auxiliary function. It is difficult, however, to give the conditions required for the general solution. The structural complexity of this kind of quasicrystal dynamic model leads to some difficulties in the process of a numerical solution.
In this paper, based on the dynamic model of wave-telegraph, the finite difference method is used to solve numerically the dynamics problem of the decagonal symmetric two-dimensional quasicrystal materials with a mode II Griffith crack,that is,the initial boundary value problem of wave-telegraph equations. As a result, the numerical solutions are obtained for the DSIF of the phonon field and the displacement component of the phason field. Through modeling of the factors such as loading time, specimen size, and the phonon-phason coupling elastic constant, the physical natures and motion mechanisms of this model are discussed, with respect to the decagonal symmetric two-dimensional quasicrystal with a mode II Griffith crack.
2 Basic dynamic equations of decagonal quasicrystals
2.1 Motion equations
According to the quasicrystal elasticity theory[23], we have the generalized Hooke’s law

where Cijkl, Kijkl,Rijkland Rklijare the elastic constants of the phonon, phason and phonon-phason coupling,respectively;εkland wklare phonon strain tensor and phason strain tensor, respectively; the corresponding phonon stress tensor and phason stress tensor are σijand Hij, respectively; and the deformation geometry equation

where uiand wiare the displacement vectors of the phonon and phason field, respectively. Collaborating arguments of [13,14], under linear and small deformation, the equations of the motion are
where -κ∂wi/∂t is the density of phason bulk forces, ρ is the mass density of the quasicrystal,ρpis the phason mass density in the vertical space,and the friction coefficient κ = 1/Γw, in which Γwis the dissipative kinetic coefficient of the material. When ρp=ρ, κ=0, equation (3) reduces to the dynamic model in [10,11], and when ρp=0,equation (3) reduces to the dynamic model in [12].
In this paper, only point two-dimensional decagonal quasicrystals will be considered. We denote the periodic direction as the z-axis and the quasiperiodic plane as the x-y plane. Assume that a Griffith crack penetrates through the crack surface of the whole material along the periodic direction, that is, the z-axis. Then, the geometric properties of the material will not change with the periodic direction. In this case,from equation (3), and expressions (1) and (2), we obtain the motion equations of the decagonal quasicrystal as follows

in which


2.2 Boundary conditions
Consider a decagonal quasicrystal specimen with a Griffith crack as shown in Figure 1. The boundary is subjected to the uniform mode II dynamic loading p(t) = p0f(t),in which f(t) is a Heaviside function and p0is a constant. The length and height of the specimen are 2L and 2H, respectively. The crack length, 2a0, is a constant.

Figure 1 The specimen of a mode II Griffith crack
Because of the symmetry of the specimen, only the upper right part is taken for analysis and calculation. The corresponding boundary condition should be satisfied

2.3 Initial conditions
The initial condition needs to be given for the problem of transient dynamics. This paper studies only the zero initial condition

3 The finite difference scheme and its examination
A grid is imposed on the upper right of the specimen shown in Figure 2[15,16,21,24-30].
Figure 2 Schematic diagram of the specimen grid
Both space step size Δx and Δy are denoted as h, which the divided mesh is set to square, and the time step size Δt is denoted as τ. The crack tip is located at the midpoint of the mesh interval and, for the stability condition, take c1τ/h = 0.8. The grid is extended by half a step due to the addition of four special grid lines x=-h/2,x=L+h/2, y =-h/2 and y =H+h/2, which form the grid boundaries. The central difference scheme is adopted in the internal domain. On the boundary, the non-central difference is used for the partial derivative perpendicular to the boundary, and the central difference is used for the partial derivative parallel to the boundary.
The difference equations corresponding to the initial-boundary conditions and corner treatment can be referred to in [29]. The difference results corresponding to the equations of motion are as follows


The decagonal symmetric quasicrystal Al-Ni-Co, as an example, is investigated in this paper, in which ρ = 4.186×10⁻³g/mm3, C11= 2.343×10⁻¹g/mm·μs2, C12=0.5741×10⁻¹g/mm·μs2,K1=1.22×10-1g/mm·μs2,K2=0.14×10-1g/mm·μs2,Γw=1/κ=4.8×10-7mm3·μs/g,which are obtained by resonant ultrasound spectroscopy[31-33].Select a0= 12mm, L = 52mm, H = 20mm, p0= 10MPa, ρp= 4.186×10⁻³g/mm3,and R = 0.01M, in subsequent calculations, unless otherwise specified, the above parameters are used.


In this paper,the decagonal quasicrystal is degraded to the crystal. The time-dependent curve of normalized DSIF of the crystal is compared to the Hao’s solution[33],see Figure 3. The result shows that the curves correspond with each other.

Figure 3 Normalized DSIF versus time for crystals
It is understandable that there are some small differences between the different dynamic models because they are approximate solutions. This predicts that our method is a powerful one for solving problems of elastohydrodynamics of fracture dynamics of quasicrystalline materials.
4 Results and discussion
4.1 Effects of the loading time on the DSIF
In practice,the external load is mostly pulse load,see Figure 4,and compared with the step load, the pulse load is closer to the actual situation. In the calculation, we assume that H is 20mm, and R is 0.01M. Results of the DSIF from pulse load with different loading times are shown in Figure 5.
Figure 4 The rectangular pulse
Figure 5 KII versus different loading times
We can see from Figure 5 that, with the increase in loading time tc, the time of the arrival peak of the DSIF under pulse loads have become gradually longer, and gradually approximates the curve to step load. After the plate is end-loaded, the time required for the initial stress wave to propagate from the plate end to the crack surface is t0≈2.67μs. When t <t0, the DSIF is equal to zero because the stress wave of the plate end has not reached the crack tip. Therefore,the velocity of the wave propagation is v =H/t0=7.49mm·μs-1,which is just equal to the wave speed c1of the shear wave,where the mode II stress load is parallel to the end of the plate and perpendicular to the propagation direction of the wave, and this kind of wave is called a shear wave.This result indicates that,in the complex system of the coupling,the phonon field plays a dominate role in the wave propagation,precisely because the boundary of the phason field is not subjected to load. Because of the interaction between the initial wave and the crack tip, the DSIF changes at 2.67μs, and the DSIF reaches the local peak at different time points under the difference loading time tc. This phenomenon is caused by the shear wave from the interaction between the initial stress wave and the crack tip. After reaching the maximum value, it begins to decrease, which is caused by the shear wave from the interaction between the initial stress wave and the crack.
4.2 Effects of the loading location on the normalized DSIF
The numerical results of the DSIF for plate end loading (see Figure 1) and crack surface loading, see Figure 6, are shown in Figure 7.

Figure 6 Loading on the crack surface

Figure 7 Normalized DSIF versus time under different loading modes
We can see from Figure 7 that the two loading locations lead to different results of the normalized DSIF,indicating that the two modes can not be equivalent. For the plate end loading, the normalized DSIF is 0 for some time, indicating that the stress wave caused by the step load at the plate end has not reached the crack surface immediately.For crack surface loading, the normalized DSIF changes at the beginning, because the propagation time of the initial stress wave is related to the distance of the loading location to the crack tip. The normalized DSIF under crack surface loading maintains a small fluctuation near the initial value. The variation range of the normalized DSIF at the plate end loading is much more than that loaded on the crack surface. So the plate end loading is more likely to lead to the fracture of the material.
4.3 Effects of the specimen width on the normalized DSIF
In the calculation, the width H of the specimen is 20mm, 25mm, and 30mm;R=0.01M. The results of the normalized DSIF are shown in Figure 8.
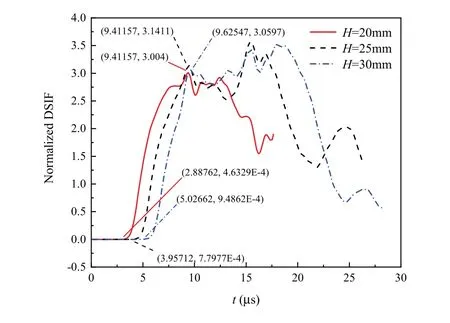
Figure 8 Normalized DSIF versus time under different specimen widths
With the increase of the specimen width,the time t0for the stress wave to reach the crack tip is longer and longer. This trend is reflected in Figure 8, where t0= 2.888μs at H =20mm, t0=3.957μs at H =25mm, and t0=5.027μs at H =30mm. The peak times of the three curves are about 9.412μs,9.412μs,and 9.626μs,and the corresponding normalized DSIF values are 3.004,3.141,and 3.06,respectively. Therefore,we conclude that the time of the interaction between the stress wave and the crack tip changes with the width of the specimen, thus affecting the peak of the normalized DSIF.
4.4 Effects of the R on displacement component wy
In the calculation, we assume that H is 20mm. For different phonon-phason coupling elastic constants R, the variation situations of the displacement component wyof the phason field with time are shown in Figure 9.
In Figure 9, when R /= 0, the displacement component wyof the phason field has a diffusion trend and is related to the size of the phonon-phason coupling constant R.When R=0, the displacement component of the phason field is equal to zero because the boundary of the phason field is not subjected to load. The force of the displacement component of the phason field comes from the phonon field, which shows that the phonon field plays a dominating role in the coupling. Compare the two curves corresponding to R = 0.01M and R = 0.02M. We can find that before t0= 3.208μs, the displacement components are all equal to zero, and it then presents a diffusion characteristic. The displacement component wycorresponding to R=0.02M is greater than that corresponding to R = 0.02M. That is, with the increase of the phonon-phason coupling constant R,the displacement component wyof the phason field also increases.

Figure 9 wy versus time under different constants R
4.5 Effects of the κ and ρp on displacement component wy
The numerical results of the displacement component wyof the phason field at the crack tip are shown in Figure 10.
We can see from (a) and (b) in Figure 10 that, when the friction coefficient is greater than the effective mass density, the effect of the latter on wycan be ignored.When the friction coefficient is less than the effective mass density, the latter changes the wyvalue size. From(a),(b),(c),and(d),the curve gradually presents a fluctuation characteristic with the decrease of the friction coefficient.
5 Conclusions
In this paper, a new model on dynamic response of quasicrystals based on [13,14]is formulated. This model is more complex than elasto/hydro-dynamics model for the material. Numerical procedure based on finite difference algorithm is developed.
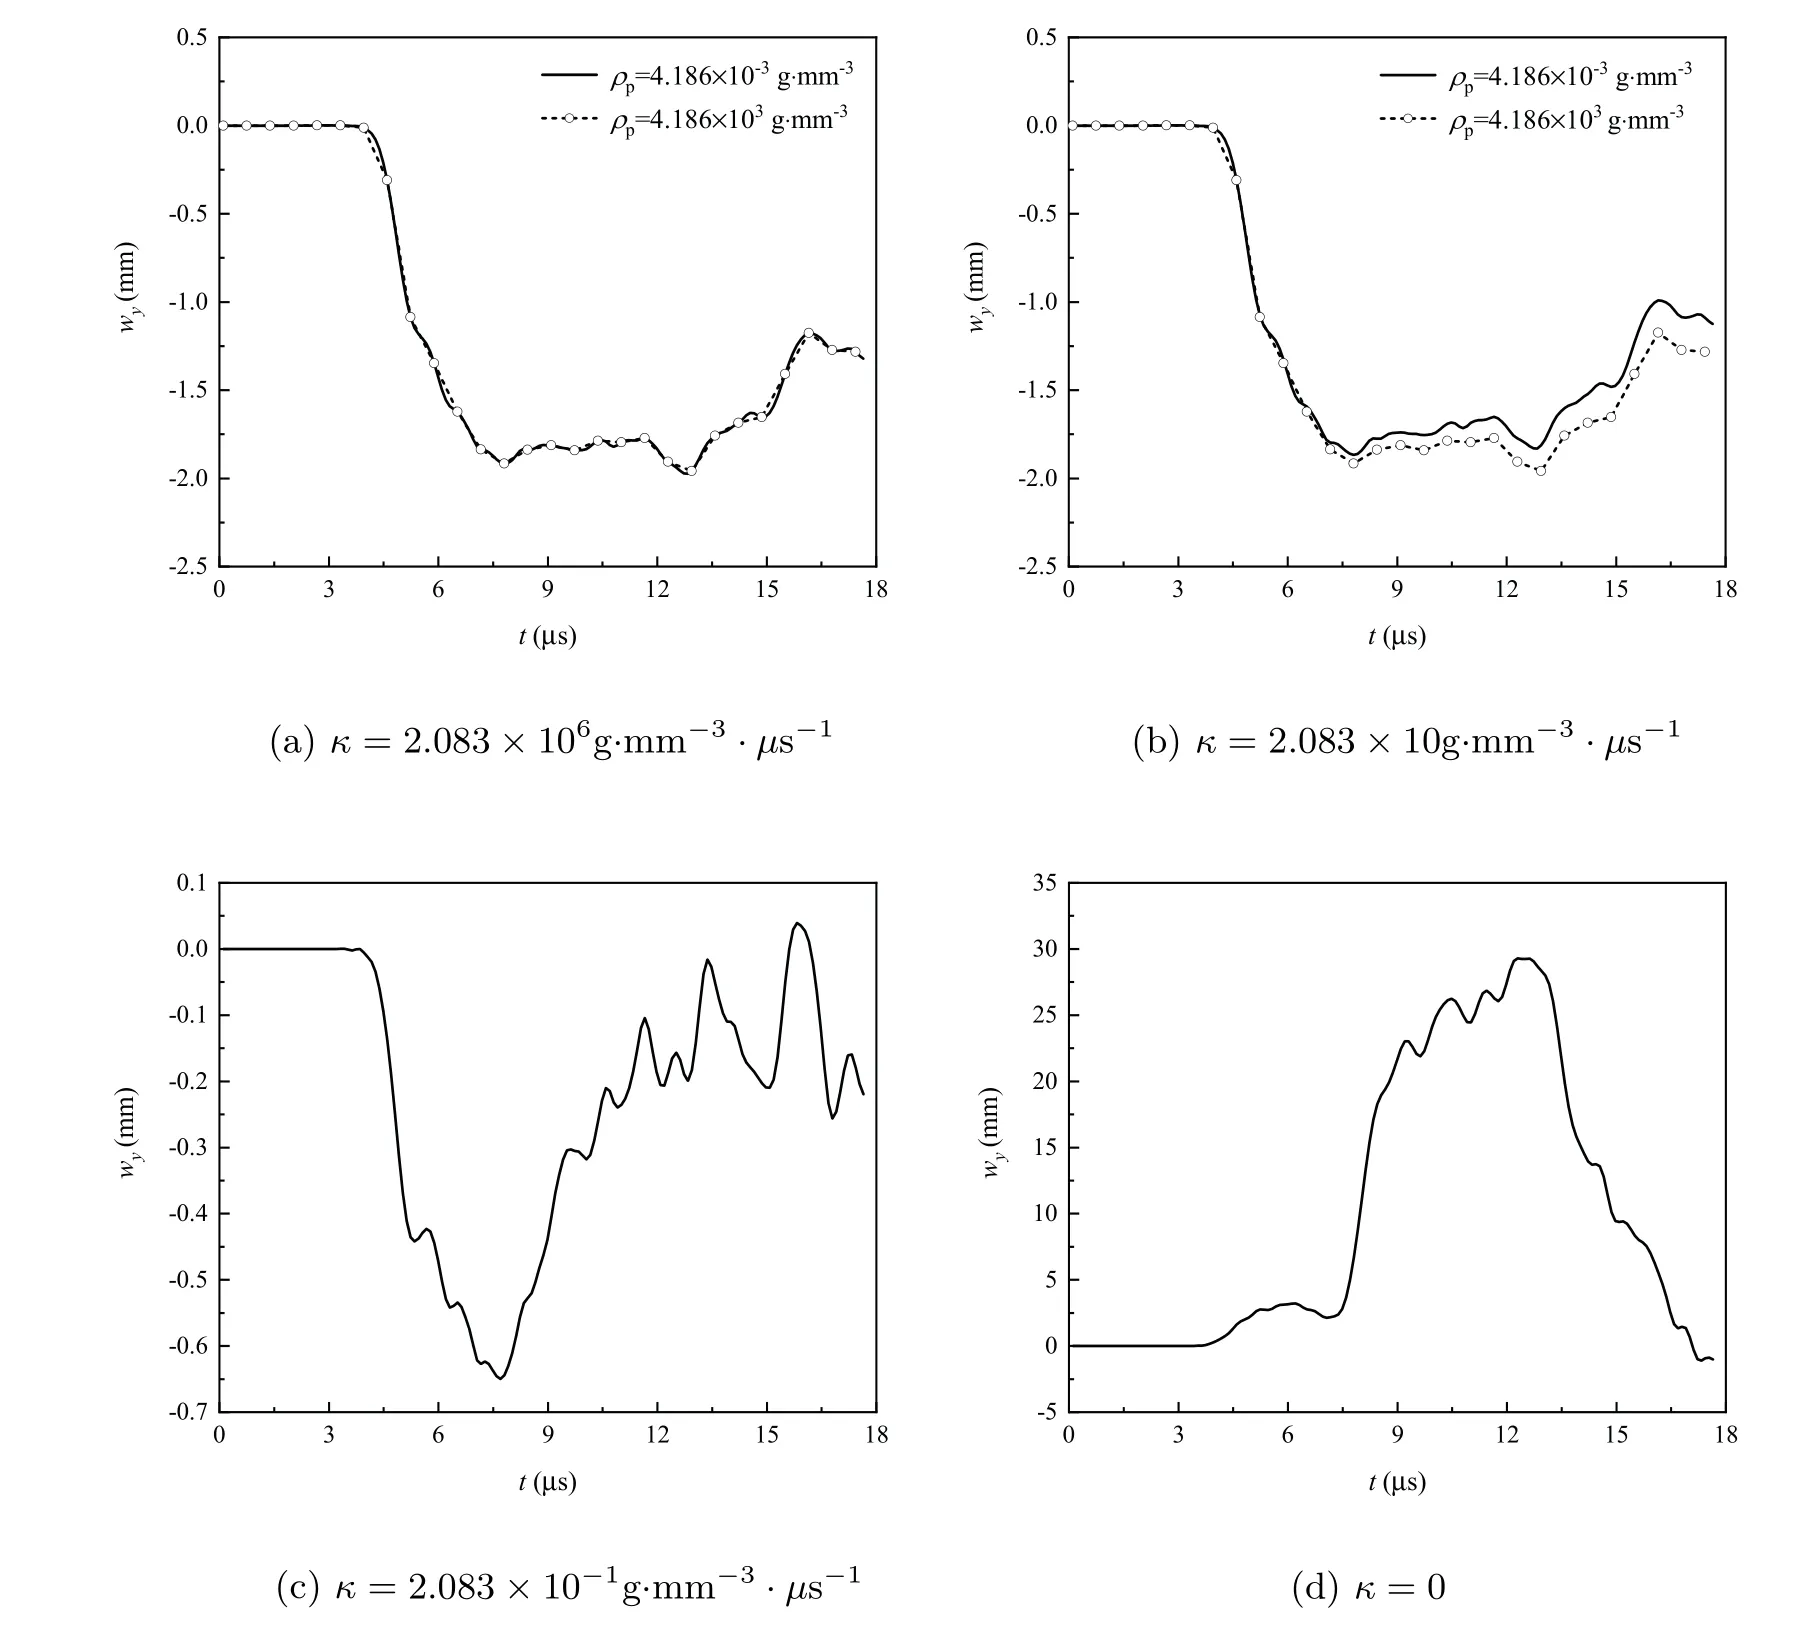
Figure 10 The displacements versus time for the different κ
Dynamic stress intensity factors of the phonon field, influence factors of the displacement component of the phason field, and characteristics of the phason field wave propagation of the decagonal symmetric quasicrystal with a mode II Griffith crack are investigated by the finite difference method. The results are as follows. The DSIF size of the phonon field is related to the loading time and loading location of the pulse load and the specimen size. The displacement component size of the phason field is related to the phonon-phason coupling constant. The propagation characteristic of the phason field wave is related to the value selection of the friction coefficient and the effective mass density.
When the pulse load is the same size,the longer the loading time,the later the peak of mode II DSIF appears, and the curve gradually approximates the curve under step load. The plate end loading and crack surface loading are not equivalent. The variation range of the normalized DSIF of the former is larger than the latter,which corresponds with the fact that the plate end loading is more likely to lead to material fracture.With the increase of the specimen width, the time of the stress wave to reach the crack tip becomes long, and the normalized DSIF becomes small. When the phonon-phason coupling elastic constant is equal to zero, the load has no effect on the displacement of the phason field. On the contrary, the displacement component wypresents a diffusion characteristic,and increases with the increase of R,increasing in the negative direction.In the phason field, the friction coefficient plays a dominating role. When the friction coefficient is greater than the effective mass density, the effect of the latter on the wyvalue can be ignored, and the wave propagation presents a diffusion characteristic.When the friction coefficient is less than the effective mass density,the latter has effects on the wyvalue. When the effective mass density is not equal to zero, the wycurve characteristic gradually changes from diffusion to fluctuation with the decrease of the friction coefficient.
AcknowledgementsThank“Technology Innovation Center for Ocean Telemetry,MNR” for funding this project.
