A method of predicting visual detectability of low-velocity impact damage in composite structures based on logistic regression model
2021-03-16FengyangJIANGZhidongGUANZengshanLIXiaodongWANG
Fengyang JIANG, Zhidong GUAN, Zengshan LI, Xiaodong WANG
School of Aeronautic Science and Engineering, Beihang University, Beijing 100083, China
KEYWORDS Composite materials;Damage tolerance;Machine learning;NDT;Logistic regression
Abstract This paper proposed a new method for quantitative assessment of visual detectability of damage based on logistic regression,using the Probability of Detection(POD)as a criterion.Experiments were performed to establish the massive hit/miss data of visual inspection. Authoritative investigations verified the reliability of the data.The prediction function concluded comprises more than one flaw size parameters,including the depth and diameter of the dents.The results show that the depth and diameter of the dents are pivotal for the evaluation of detectability;the type of detection, the detection distance, and the qualifications of personnel are critical external factors to be considered. This function, with an accuracy rate of nearly 85%, is capable of predicting the visual detection probability of impact damage under various detection environments,which will provide a reference for the damage tolerance design of composite materials and field maintenance in the Non-Destructive Testing (NDT) field.
1. Introduction
As composite structures are widely used in aviation, their reliability and maintenance requirements are improving. Consequently, the composite damage detectability is becoming increasingly significant. The detectability of impact damage,closely related to composite structures’ safety and durability,is a fundamental theme in damage tolerance theory.1,2As for economic concerns, visual inspection remains one of the most widely used techniques by aircraft designers and operators.3,4Visual inspection is relatively fast as a primary method and has a large field of view for the in-service inspection of composite structures.5-7Other non-destructive inspection techniques such as ultrasound and digital image correlation will be performed later to determine the specific internal damage,such as delamination, debonding, and matrix cracking.8-11The precise non-destructive testing methods often require sophisticated measuring instruments and particular detection environment and location.Furthermore,the cost of skill training is high. Due to the above facts, visual inspection is more favored by periodic inspection in the field. Therefore, visual inspection is also one of the important basis for defining Barely Visible Impact Damage(BVID).BVID is traditionally defined as a threshold, usually measured by the depth of dents, which means that the structure with BVID has a positive margin for the ultimate load. However, with the emergence of many new materials and the update of design concepts, this value is usually changeable.Based on the discussion above,many scholars have put forward quantitative researches on the probability assessment of the damage.
To evaluate the visual detectability of damage and its influencing factors, various studies were performed by aircraft manufacturers and academics. Aerospatiale’s research12showed that dents with a depth of 0.3 mm - 0.5 mm could be detected through detailed visual inspection (the inspection consisted of closely examining the panels from a distance of about 0.5 m) with a probability higher than 90%, which was used as the detection criteria of the first civil aircraft with composite wings. Erhart et al.13initiated a study on the effect of human factors on the detectability of dents on the composite specimen, and it showed that gender had little effect on visual test, and age might be an influencing factor but more conclusions needed further research. Airbus14and Boeing15defined barely visible impact damage (BVID) based on depth through visual inspection and highlighted that relaxation should be taken into account.Defined by Airbus, BVID is the minimum impact damage (depth of dents as metric) evidently detectable by scheduled inspection. It corresponds to a probability of detection of 90% with an interval of confidence of 95%. Boeing defined BVID as the small damage which may not be found during heavy maintenance general visual inspections using typical lighting conditions from a distance of 1.5 m; generally,typical dent depth is 0.254 mm to 0.508 mm. European Aviation Safety Agency’s report16,17found that variation of a single inspection parameter such as cleanliness, inspection angle and color/finish combination did not have a large effect on inspection results, that meant that when evaluating the detection probability of the dents, it was necessary to comprehensively consider the influence of various factors in the environment.Cook et al.18,19conducted some visual inspection trials with virtual specimens to get a mass of data and proposed that visual inspection detection thresholds must not be considered in terms of either dent depth or dent width alone. Dubinskii et al.20,21investigated the influence of cleanliness, paint color,and viewing distance on the probability of visual inspection,with the consideration of relaxation behavior, the authors determined the BVID values under several typical testing conditions,which made a reference for the airworthiness certification of Irkut MC-21 aircraft.
Barely visible impact damage (BVID) is the basic standard of the damage tolerance theory, which provides a threshold depth for reference. It may be sufficient for the mechanical property analysis of the damaged material,22,23but it is not rigorous for non-destructive testing.18The depth alone provides an insufficient description of the surface flaw or dent topography.Dents on a composite laminate are 3D in shape;therefore,multiple variables are required to describe their topography,i.e. depth and diameter, all of which may affect their detectability. In order to incorporate environmental factors into the Probability of Detection (POD) function, various influencing factors of visual inspection should be quantified,for example, panel colors and gender. To accurately model the visual inspection reliability of impact damage to composite aircraft structures, a multivariate probability of detection(POD) analysis method should be developed. This method is needed in the early stage of material design and damage detection.
With the advent of artificial intelligence, many machine learning methods such as K-Nearest Neighbor (KNN), naı¨ve Bayes, decision tree, Support Vector Machines (SVM), and logistic regression are widely used in composite materials.Addin et al.24proposed a naı¨ve Bayes classifier for damage detection in engineering materials and the accuracy rate can reach 90%. Wagner et al.25applied the decision tree method to optimize the laminate stacking of cylinders for maximum buckling load and minimum imperfection sensitivity. Jac Fredo et al.26classified the strength of composites using the SVM with an accuracy of 85%. The model used in this article is logistic regression, a generalized linear model since the predicted probabilities only depend on the weighted sum of the input variables. The advantage of the model is to convert the binary dependent variable (0 or 1) into a continuous probabilistic variable(0-1),and the weight of each independent variable is interpretable. Using logistic regression algorithms, Gu et al.27presented pioneer work on applying machine learning to the design of composites for Mode I fracture. Andrejiova et al.28conducted the failure analysis of rubber composites under dynamic impact loading while applying the logistic regression method. Compared with other machine learning methods, the logistic regression with simple expressions and interpretable parameters is suitable for the rapid prediction of engineering applications.
This study aims to explore the visual detectability of dents through the POD function of influence factors.Massive visual inspection data were collected, and machine learning models were applied for analysis. According to the definition of Airbus,the author used the method in MIL-HDBK-1823A to calculate the BVID threshold value under typical detection conditions. The threshold values were compared with Refs.12,14,15to verify the reliability of the test data.Then,based on the more than 20000 hit/miss data obtained by the experiment, a logistic regression model on the detectability of dents in visual inspection was fitted. A probability prediction formula was achieved, with an accuracy rate of nearly 85%.Finally, according to the predictive model, the detectability profiles under typical detection conditions were obtained,which characterized the detectability of the damage in detail.Its applicability and interpretability were better than the traditional BVID threshold.
2. Method
2.1. Logistic regression
The essence of this problem is a binary classification problem.Data with binomial distribution were collected through a visual inspection experiment. The detected flaw was recorded as 1, and the undetected flaw was recorded as 0, i.e. hit / miss data.
Ordinary linear regression hypothesizes that the model response varies constantly and is unbounded, but binary (hit/miss) data are neither - the observed outcomeyis bounded and discrete, having 0 or 1 as possible values. Generalized Linear Models(GLM)can solve this problem by‘‘linking”the binary response to the explanatory variables through the probability of either outcome, which varies continuously from 0 to 1. The transformed probability can then be modeled as an ordinary polynomial function, linear in the explanatory variables, and so is a generalized linear model.29
Logit is the most used link function, and the GLM using the logit transform can also be called the logistic regression model. The ratio of the probability of occurrence to nonoccurrence of an event isP(y|x) / (1-P(y|x)), referred to as odds.
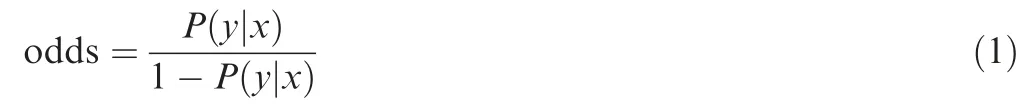
A linear function can be expressed by taking the natural logarithm of odds:

β0-βmare regression parameters,presenting the weight of X(see Section 4.2 for details). The probability can be solved in Eq. (3):

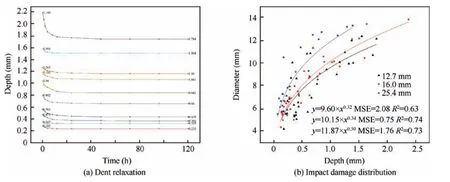
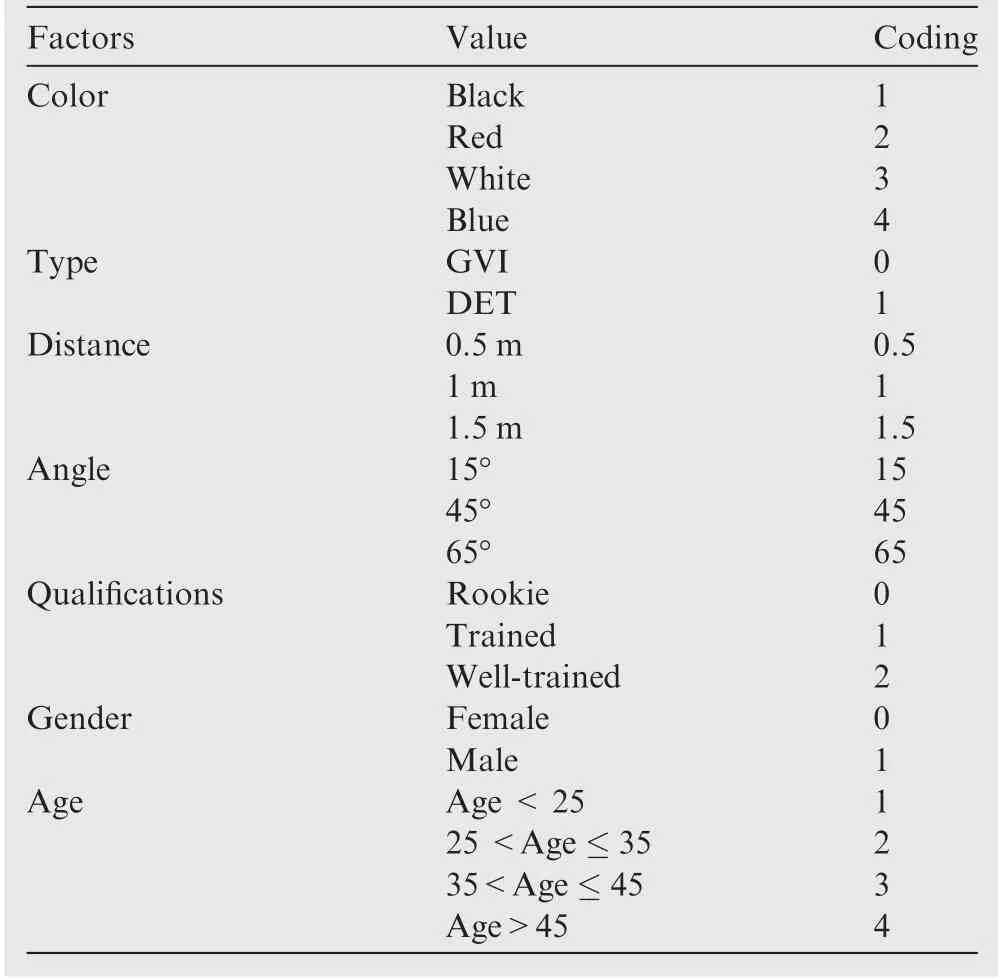
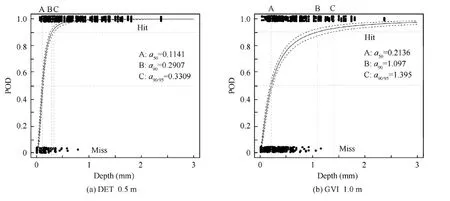
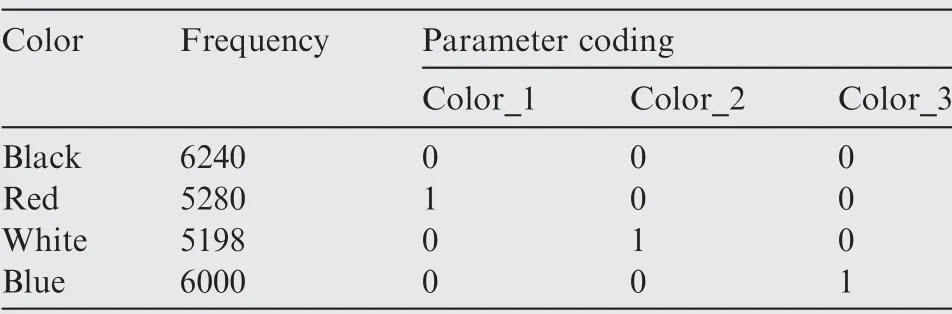
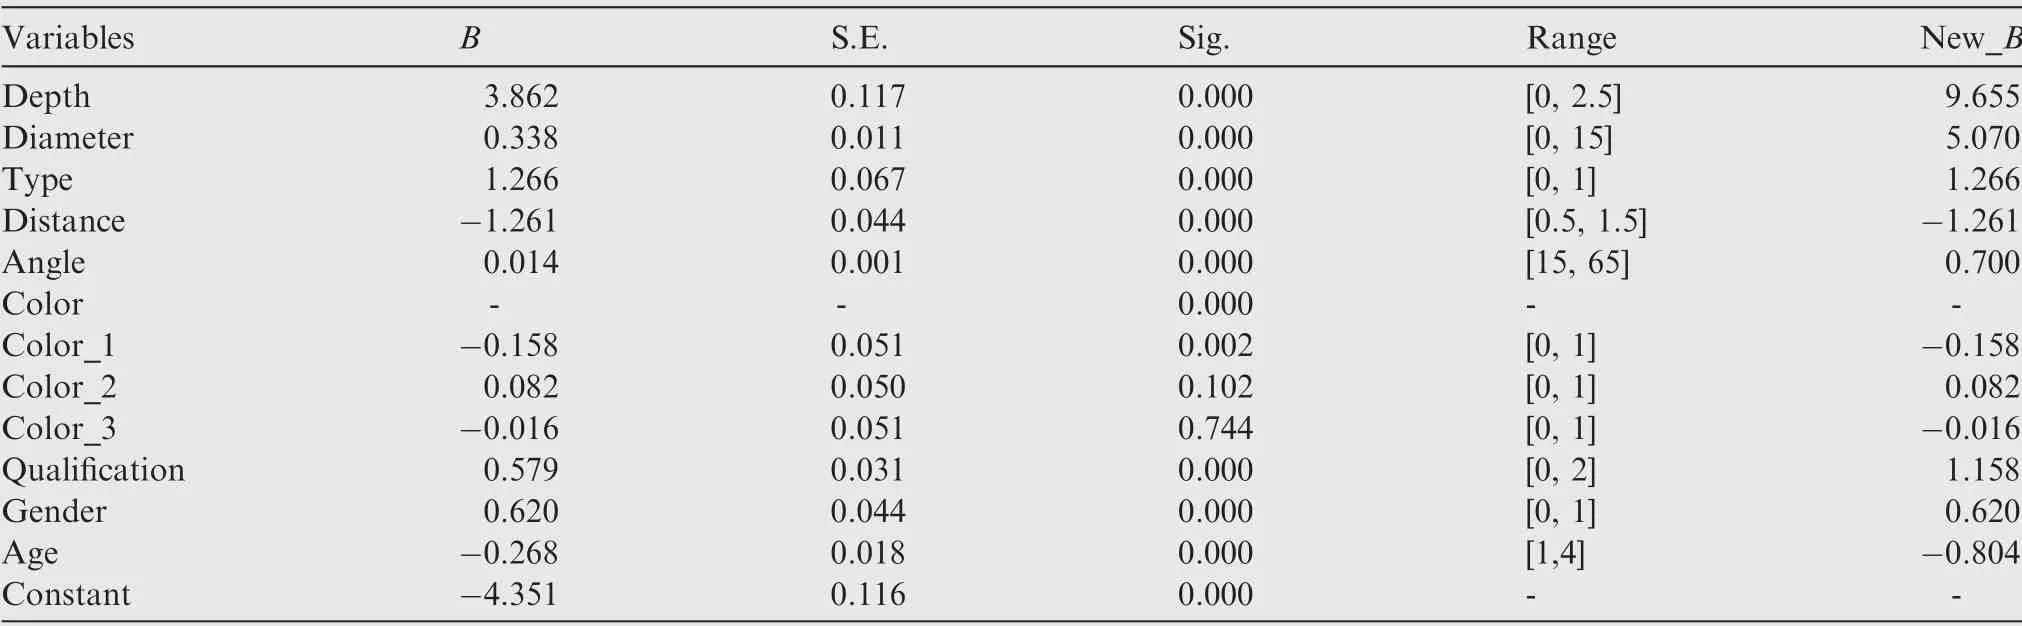
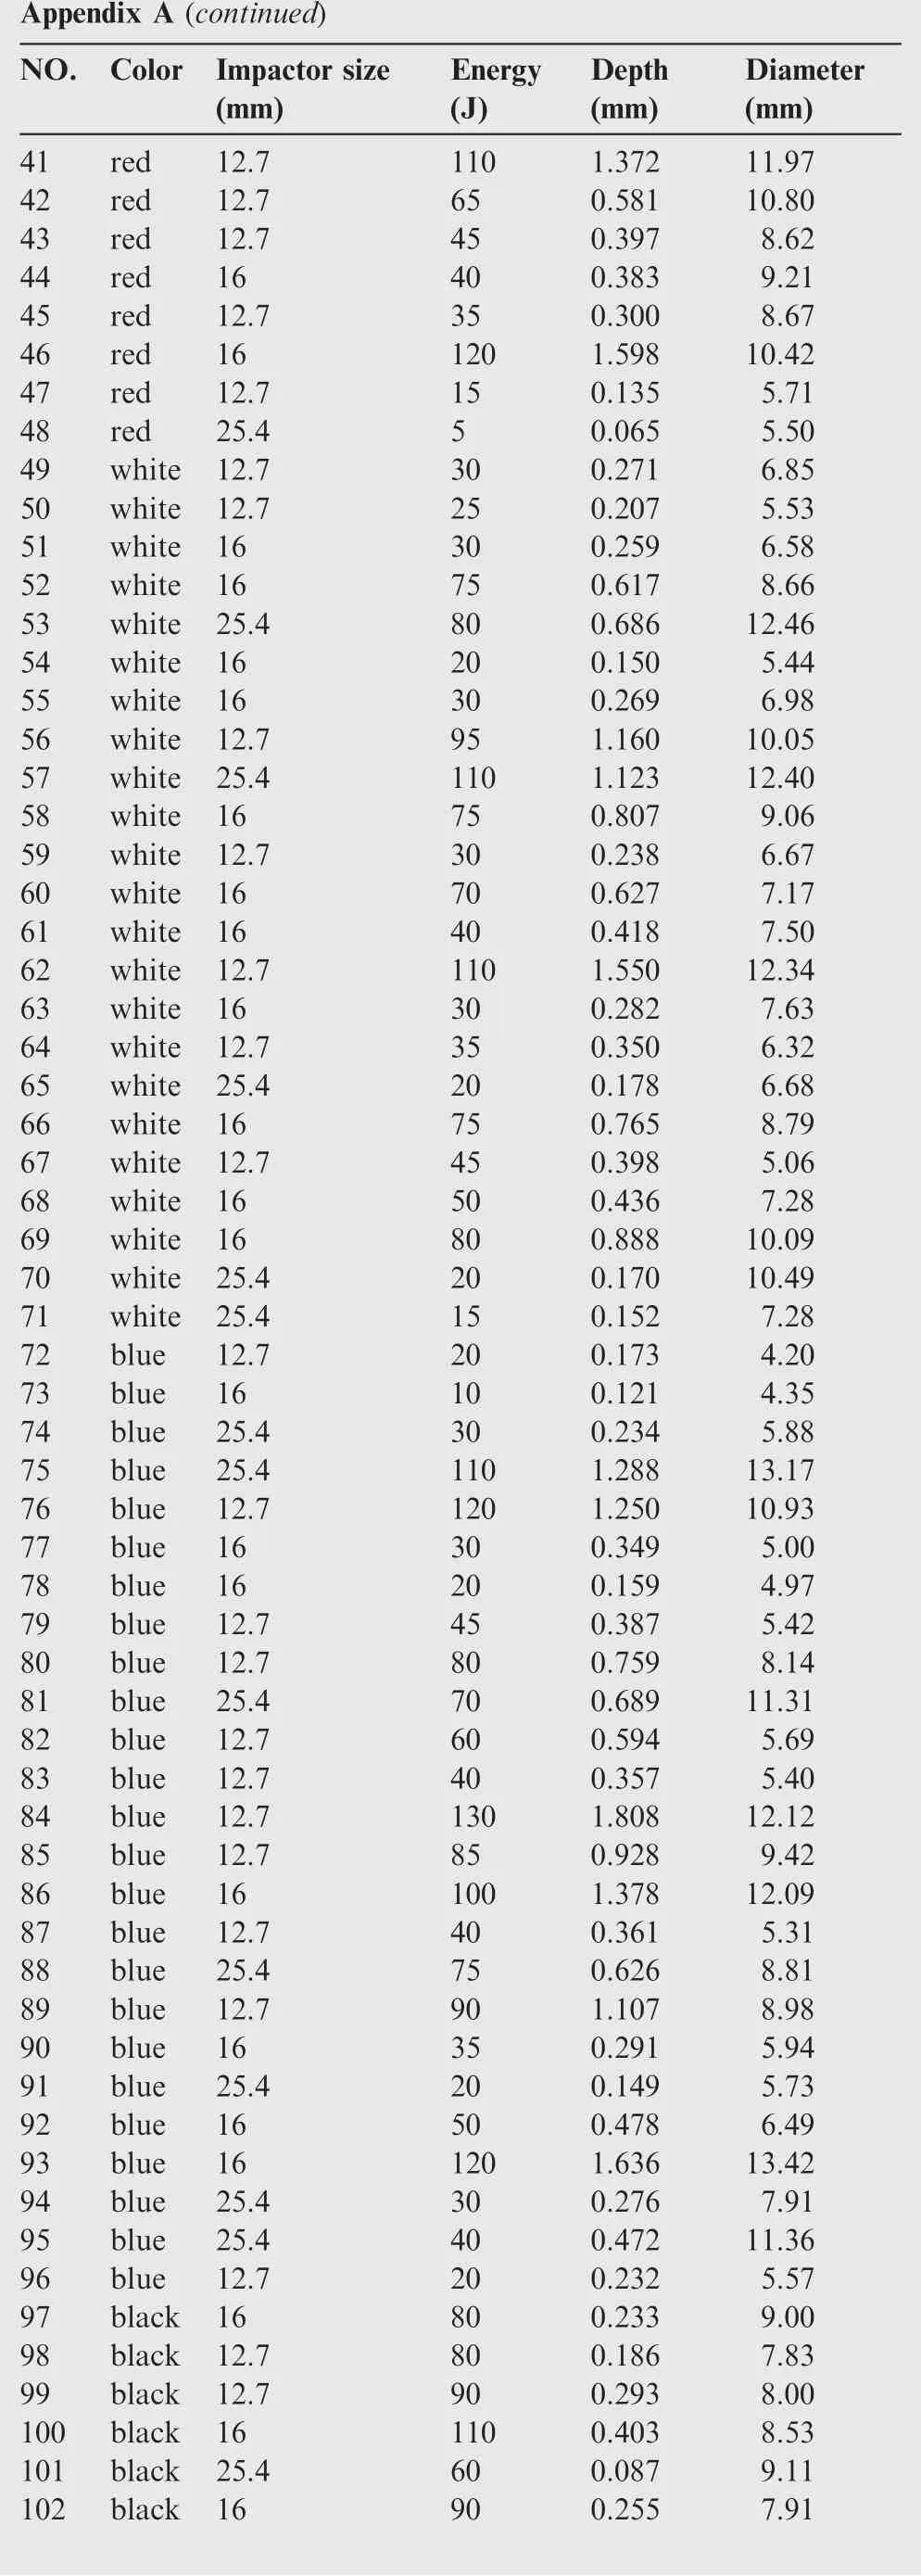
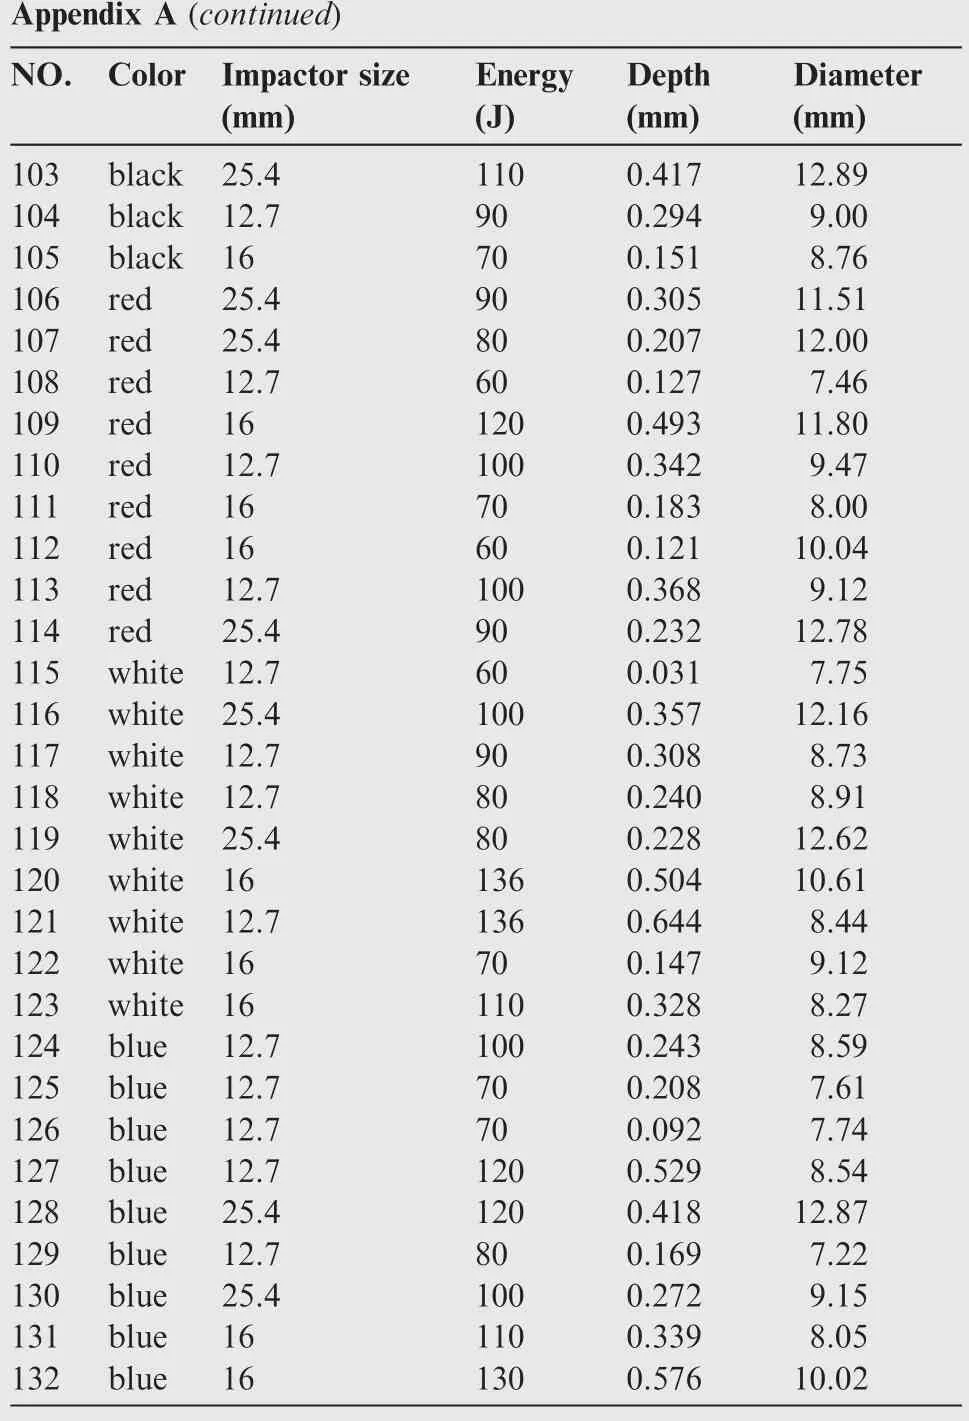
With binary data, the resulting error between observation and model prediction is decidedly non-normal (it’s binomial),and therefore treating it as Gaussian would produce inaccurate and unreliable parameter estimates even when the model is restricted to realistic values (0 In order to calculate values of the parameters β that can maximize the value of this likelihood function, the likelihood equation as follows should be solved: The likelihood Eqs. (5) and (6) are non-linear functions of β.This research used R language and statistical software SPSS to solve it by iterative calculation. MIL-HDBK-1823A is considered as the state-of-the-art guidance for conducting POD studies by the United States Air Force and other industries.29-31BVID is the minimum impact damage (depth of dents) evidently detectable by scheduled inspection.14It corresponds to a probability of detection of 90% with an interval of confidence of 95%. The log-likelihood ratio method in MIL-HDBK-1823A is to construct a confidence interval. As a consequence of the central limit theorem, the ratio of the logs of the new values to their maximum values, the loglikelihood ratio has an asymptotic chi-square density.29That provides a means for constructing likelihood ratio confidence bounds: move the POD model parameters away from their maximum values,but not too far, only until the criterion is reached. The mh1823R language package developed by Charles,32version number 5.4.5, is adopted in this study. The laminates used for visual inspection were made of CYCOM X850-35-12KIM+-190-ATL150 mm,and the nominal thickness of the cured single layer was 0.191 mm. See Table 1 for mechanical properties.The first group was 2 pieces of composite flat panels with the size of 600 mm×600 mm×4.58 mm.The second group was 2 pieces of composite stiffened panels with the size of 1300 mm×1000 mm×11.46 mm. The panels were provided by the sponsor, and the dimensions were the typical size of the composite wing structures. Three typical sizes of steel hemispherical impactors were 12.7 mm, 16 mm and 25.4 mm, and the impact energy cut-off was 136 J. According to ASTM D7136 standard,33the impact instrument was designed by authors. Hemispherical impactors are used to introduce impact damage, and impact energy can be set by adjusting the clump weight or the drop height which is measured by the height gauge, see Figs. 1 (a) and (b). A piezoelectric force sensor (Sinocera CL-YD-311) records the impact force (Fig. 1 (a)), and a velocity sensor (Panasonic EX-11A) measures the impact velocity (Fig. 1 (c)). Appendix A gives the impact energy and damage parameters of all dents. In terms of topography, the depth and diameter were used as damage metrics. It should be noted that, due to the relaxation of the impact damage,the dents would become shallower with time14,21. In Room Temperature and Dry (RTD), the depth of dents would be reduced by nearly 30%. In Elevated Temperature and Wet (ETW), the relaxation is more significant. In RTD, the depth of some dents was measured with a micrometer gauge (Syntek Corporation, Huzhou, China) for 5 days,the results show that the depth of dents will not change after 120 hours(even 72 hours),see Fig.2(a).The distribution of the final composite damage after relaxation in RTD is shown in Fig. 2 (b). The abscissa represents the depth with the range from 0 to 2.5 mm, and the ordinate represents the diameter with the range from 0 to 15 mm.When the impactor size and impact energy are known, the depth and diameter of dents are usually related. The relationship between depth and diameter approximates a power function. The Mean Squared Error (MSE) and the coefficient of determination (R2) are given in Fig. 2 (b). However, the impact source is often unknown in field testing. At this time, the depth and diameter of dents are independent; thus the independent assumption is used in the analysis of the visual inspection test. Table 1 Composites ply properties. Fig. 1 ASTM D7136 drop-weight impact instrument. Fig. 2 LVI results. Internal factors such as depth and diameter, panel color, and external factors such as detection type, detection distance,detection angle, and personnel qualifications were considered in the visual inspection test. The panel was spray-painted into four colors: black (no painted), red, white, and blue, referring to the main coloring of civil flight.16The detection types were General Visual Inspection(GVI)and Detailed visual detection(DET). GVI had a time limit with 0.36 m2/min, and DET had no time limit.Generally,DET and GVI have different requirements for the time limit,detection distance,and surface cleanliness, etc.15Based on the control variable method, the detection types are only defined by time limit here. For the detection environment, three types of detection distance14,15were 0.5 m, 1 m and 1.5 m; three angles of the detection angle:15°,45°,and 65°with the horizontal plane were set by the protractor (Syntek Corporation, Huzhou, China).16Inspectors’visual acuity should be tested over 0.8. Professional qualifications of inspectors were classified into three categories:Well-trained inspectors were the personnel with 5 or more years’ experience in composite materials; trained inspectors were those with less than 5 years’ experience; rookies were those with no specialty in the field.There is a total of 80 inspectors, including 21 well-trained inspectors, 33 trained inspectors, 26 rookie inspectors, and their age and gender details are shown in Figs.3(a)and(b).The above typical values were based on relevant standards and test data from Boeing,14Airbus,15and the European Aviation Authority.16To facilitate the analysis of the model,the categorical variables were coded as Table 2. It should be noted that the position of panels was adjusted so that glare did not occur16. Illumination in the site was between 200 Lux - 600 Lux measured by the illuminance meter (Smart Sensor AS823), and the yellow and black warning lines were laid out on the ground (Fig. 4(a)). After the test site layouts were prepared, the visual inspection test was performed according to the process,and then the observation results were recorded (Fig. 4 (b)).In order to encourage the personnel to mark the damage location, the author roughly divided the panel into grids.The inspectors will be told that there may be dents in each grid, and then they need to record the corresponding position on the test paper. The visual inspections of DET and GVI were conducted separately, and each inspector visually inspected the dents of all colors. For the reliability of the data, only well-trained inspectors are allowed to conduct GVI inspections, and all inspectors performed DET inspections. The environments are divided into 9 groups according to the detection distance(0.5 m, 1.0 m, 1.5 m) and detection angle (15°, 45°, 65°) to ensure that there are sufficient detections in each detection environment, see Figs. 3 (c) and (d). The visual inspection test gained 22718 available test data.Each of them contained 10 variables, i.e., 9 independent variables and 1 dependent variable:independent variables included depth,diameter,detection type,distance,angle,color,personnel qualification, gender, and age; the dependent variable was the result of visual inspection, hit/miss data. There were 6759 misses and 15959 hits, and the total accuracy of the visual inspection by the inspectors was 70.25%. Table 3 shows the data structure of visual inspection results. The database is expandable instead of closed. Further research can expand variables by adding more supplementary visual inspection data,such as illumination,damage location,cleanliness etc.,to extend the visual inspection database. The complete data can be obtained through the corresponding author’s email. Fig. 3 Inspections data details. Table 2 Visual inspection factors and coding. The traditional threshold calculation method is executed to verify the reliability of the test data. According to the data,dents within 1 mm depth will be significantly missed (the test value is 0).The smaller the depth of the dents,the higher probability the dents missed. Dents above 1 mm depth will be detected with high probability. The POD curves are shown on Fig.5,the essential features of the model are recorded on the curve,including the parameters for the POD model,a50,the size having 50%POD,a90,the size with 90%POD, anda90/95,the 95%confidence bound on thea90estimate.Based on the log-likelihood ratio criterion,the larger value of 95% confidence bound in the figure is BVID.Table 4 shows the comparison of the test results with the thresholds defined by Aerospatiale12, Boeing14and Airbus.15 When the detection distance was 0.5 m,the DET threshold obtained was 0.3309 mm within the range prescribed by Aerospatiale and Boeing, while a bit larger than the Airbus BVID threshold of 0.3 mm, with an error of 10.3%. The GVI threshold was 1.395 mm, which was slightly larger than the Airbus VID threshold of 1.3 mm, with an error of 7.3%.The results showed that the visual inspection test was basically reliable. Fig. 4 Visual inspections. Table 3 Data structure. Fig. 5 POD curves according to BVID definition. Table 4 Comparison of obtained results with results of other authors. Based on the data in Table 3,a multivariate logistic model was performed in this section. Before modeling, the type of independent variables was required to be considered. The socalled ‘‘dummy variables” were used to code for categorical variables,such as the panel colors.Each dummy variable only represented the difference between two levels, making the regression result more explainable. Table 5 shows the panel color coding. The initial accuracies of hit and miss prediction are 88.1%and 58.9% respectively, and the overall accuracy of the final model is 79.4%(Fig.6(a)).The test results show that the prediction accuracy of miss is low because the hit(15959)and miss(6759) are not balanced. In order to improve the accuracy of the model, the data needs to be augmented. It is assumed that the dents with depth less than 0.01 mm and the diameter less than 0.1 mm are not detectable(0).The reference value can be understood as the measurement error of the instrument (micrometer and vernier caliper). The result is shown in Fig. 6(a). It can be concluded that the model accuracy is more balanced when the extended data size is 10000. The overall accuracy can reach 85%. Forward: LR (Likelihood Ratio) method, a forward stepwise regression method based on maximum likelihood estimation,is used for variable screening to confirm the contribution of variables. In that method, the independent variables are selected in the model based on the score test results, and excluded based on the likelihood ratio test results. After 9 steps, the -2 log likelihood value of the model gradually becomes smaller, while the pseudoR2,34,35enhanced increasingly, indicating that the model improved following the inclusion of variables selection at each step.That also means that a model that considers all factors is better than a single factor model. Fig. 6 (b) shows the variables selected at each step. Table 6 presents the final parameter result gained by the model, from which the visual detection probability function(Eq. (7)) can be obtained. The second and third columns in the table are the coefficient (B) and standard error (S.E.).The value (Sig.)<0.05 means it has statistical significance.Color _1, color_2, and color_3 are dummy variables about the color of the panel.When all the values are 0,the calculated probability values represent the detection probability of the black panel;while color_1 is 1 and the other two are 0,the calculated probability signals the red panel’s detection probability, and so forth. It can be concluded from the four coefficients that the detection probability of white (0.082) is higher than black (0); blue (-0.016) is more significant than red (-0.158). Red is the color with the lowest probability of detection among the four colors. Table 5 Categorical variables coding. Fig. 6 Fitting results of logistic regression model. Table 6 Parameters of logistic regression model. When a set of values of X is given, the valuePunder this condition can be solved by the Eq. (7), which means that the probability of visual detection of the dent under the condition of X.A positive coefficient(B)indicates that an increase in the number of factors will improve the detection probability and vice versa. The absolute value of the coefficient shows the degree of importance a unit factor to the amount of change in detection probability. In order to eliminate the influence of different unit ranges on the interpretation of the coefficients,the author normalized the influencing factors and multiplied the coefficient (B) by the range of the real unit of the variable to generate a new coefficient(New_B).The new coefficient represents the exact influence level of different variables.Of all the internal factors,the depth is the top-priority factor(9.655),the diameter is the second(5.070),and the color is the last(-0.158,0.082, -0.016). Among all external factors, detection type(1.266), detection distance (-1.261), and personnel qualification (1.158) are the top three influencing factors, followed by personnel age (-0.804), detection angle (0.700), and gender(0.620). Since the parameters of the distance and the age of personnel are negative, the detection probability becomes smaller with the value of distance and the age of personnel increasing. Depth and diameter are critical internal factors for visual detectability. The results show that the depth is a more significant damage metric than the diameter in visual inspection,which also proves the rationality of the traditional damage tolerance theory using the depth as a damage measure.Detection distance, personnel qualification, and detection type are three essential external factors, which are illustrated in details in the 3D map below. Personnel age and sex, detection angle,and panel color had limited impacts on the detection probability, and they were not discussed at length in this article. In order to prove the effectiveness of the method horizontally, the results of four commonly used machine learning models are shown for comparison. The author uses Python to implement other machine learning methods such as KNN,naı¨ve Bayes,decision tree,and SVM algorithm,and then analyze the same data obtained by visual inspections. The prediction accuracy of each model is calculated, and the Receiver Operating Characteristic (ROC) curves are plotted as Fig. 7.It can be seen from the bar graph that KNN, Decision tree,SVM and Logistic models have higher accuracy and perform better than Naı¨ve Bayes. The Naı¨ve Bayes method has low accuracy and is not suitable for the problem. KNN and Decision tree are typical classification models, and their classification effect is usually good, but there is no explicit expression like logistic regression. SVM is a powerful non-linear model,but its calculation complexity is high, and the parameters are hard to explain. The area under ROC curves (AUC) represents the classification performance of the method. The closer the AUC value is to 1, the better the model classification effect. The AUC of logistic regression is 0.937,which is the best of the five models.The dotted line in the figure represents the random classification model (AUC=0.5). In summary, logistic regression is the most optimal model for visual inspection. The POD was used as a criterion to evaluate the visual detectability of impact damage. In order to visualize the influence results of factors, the scatter plots of POD are drawn in this section. TheYaxis represents the detection probability,and theXaxis represents the depth of dents. The effects of the environment on the detection probability are illustrated by the three aspects of qualifications, detection type, and detection distance as follows. Fig.8 describes the impact of personnel qualifications.Blue represents well-trained inspectors, green represents trained inspectors,and red represents rookie inspectors.The detection probabilities of blue and green are higher than red in each figure. It can be observed that under DET detection conditions,professionals (well-trained and trained) produced a higher probability of detection than non-professionals (rookies),hence more experience in the industry can be an advantage in visual inspection. Personnel’s training plays a vital role in improving the POD of dents. Fig. 7 Methods evaluation. Fig. 9 shows the effects of the detection type. To control a single variable, all the scatters plotted are professionals (welltrained and trained). Green represents DET, red represents GVI,and the green dots are almost above the red dots in each graph. In general, the POD under DET is higher than that under GVI. The POD of the dents improves as the detection time increases due to the added details gained. While this increase of POD comes at the cost of time consumption,a balance should be sought between POD and the detection time in line with the actual demand in the field by aircraft designers and operators. It can be seen from the Fig.8 and Fig.9 that with the shortening of the detection distance, the scatters move upward as a whole, which means that the reduction of the detection distance is helpful to the improvement of the detection probability. To better express the impact of the detection distance on the detection probability under the two detection types,Fig.10 is plotted.All the detection personnel are professionals.Blue represents a detection distance of 1.5 m, green represents a detection distance of 1.0 m, and red represents a detection distance of 0.5 m. As the distance decreases, the position of the point moves upward obviously. Under the same detection type, POD increases as the detection distance declines. Likewise, closer inspection in DET may cause more time costs. Fig. 8 Effects of qualifications. Fig. 9 Effects of detection type. Fig. 10 Effects of detection distance. The best detection condition is DET detection by professionals at 0.5 m (DET_0.5 m) irrespective of the cost. The detection conditions should be adjusted in field inspection to improve efficiency. For instance, the detection distance can be increased,and the detection time can be limited.The airline manager should pay attention to the impact of the changes in conditions on the detection probability. The 6 typical detectable contour curves of the dents (professionals) are shown in Fig. 11, which is more instructive in the decision. Fig. 11 depicts the detectability probability of different dents under typical detection conditions, and contour lines of the same detectability probability are shown. Because the classification point predicted by the model is 0.5, the contour with the detection probability of 0.5 (solid black line) is also the hit / miss boundary of the prediction result. The model judges the dents on the left side of the boundary as a miss,and those on the right side as hit. As the detection conditions optimize, the hit / miss boundary gradually moves to the lower-left corner and is no longer visible at DET_0.5 m,which means that almost all dents can be found in DET_0.5 m. IfP=0.5 is not a good classification point, other classification points can also be selected according to the sensitivity. The probability method is more flexible than the traditional method based on the threshold value. When the depth of dents is smaller (less than 0.5 mm), the diameter has a positive correlation effect on the detectability,i.e., with a constant depth, as the diameter became larger,the detectability improves (see Fig. 11(e)).The diameter is a sensitive factor for detectability. It should be considered in the range of small dents (depth less than 0.5 mm). Especially for thin-plate composite materials, the damage size will be small. That phenomenon may require additional attention by material structure designers. The POD of dents with a depth of 0.5 mm - 1 mm was 50% - 90%. Many institutions and scholars define the BVID in this range, and the depth plays a pivotal role in this range.When the depth of the dents was greater than 1 mm,the detection probability reached over 90%. Fig. 11 Typical POD contour curves. Compared with the traditional BVID threshold(Section 4.1), the advantages of POD contour curves(Fig. 11) show that the influence of the diameter is considered when assessing the detectability; POD has been expanded into a multivariate function of certain factors.This method quantitatively describes the detectability of damage, which is helpful for the damage tolerance design of new materials.The conclusions of this paper are applicable to most Carbon Fiber Reinforced Polymer(CFRP).For other composites,a large amount of data is still needed for verification.This method can be used as a reference. This paper investigated the detectability of impact damage in composite structures through visual inspection experiment and modeling analysis. The test results are reliable by data comparison, and the model fits well. The main conclusions of this article are as follows: (1) This paper extends the BVID threshold to a visually detectable probability. Based on the massive hit/miss data generated by visual inspection,a reliable evaluation logistic regression model for detectability was concluded in the paper, and its accuracy rate is nearly 85%.Related factors were quantitatively described such as depth, diameter, and external conditions. (2) The depth and diameter were the basis for evaluating the detectability,especially in GVI.When the depth was less than 0.5 mm, the diameter was a sensitive factor of detectability. The 6 typical detectability contour curves concluded can serve as a reference for the BVID in advanced composite structures. It is highlighted that the diameter parameter should be added to the BVID criterion. (3) Detection type, detection distance, and personnel qualifications were crucial external factors on the detectability. Detection angle and panel color were secondary factors that influenced the detectability of the dents.Overall, general factors should be controlled within a specific range in external field detection. The authors declare that they have no known competing financial interests or personal relationships that could have appeared to influence the work reported in this paper. Acknowledgement The work was supported by COMAC Beijing Aeronautical Science & Technology Research Institute. Appendix A.Impact damage summary sheet NO. Color Impactor size(mm)Diameter(mm)1black 12.7700.64310.84 2black 12.7100.1705.74 3black 16150.2335.40 4black 12.7700.6606.94 5black 25.4500.4427.15 6black 16150.1355.63 7black 16400.3016.91 8black 25.4900.78912.07 9black 161001.06110.13 10black 12.71101.3209.93 11black 161302.37513.81 12black 161201.50412.15 13black 25.4300.2237.11 14black 12.7150.1557.27 15black 12.71201.74410.68 16black 12.7550.4256.53 17black 12.7600.4356.17 18black 25.4150.1506.24 19black 25.4700.6119.28 20black 16200.1916.62 21black 25.4900.84112.71 22black 16951.02310.05 23black 12.71101.3969.99 24black 16951.1609.68 25black 16550.4407.15 26black 16200.1495.53 27red25.4500.3667.94 28red12.7400.32510.02 29red25.4800.7728.53 30red25.4300.2407.80 31red16200.1756.15 32red25.41001.39013.27 33red25.4150.1236.66 34red16300.2166.45 35red16100.1076.14 36red12.7400.3865.67 37red16750.6368.75 38red16500.5329.27 39red25.4100.0896.89 40red16750.87410.55 Energy(J)Depth(mm) Appendix A (continued)NO. Color Impactor size(mm)Diameter(mm)41red12.71101.37211.97 42red12.7650.58110.80 43red12.7450.3978.62 44red16400.3839.21 45red12.7350.3008.67 46red161201.59810.42 47red12.7150.1355.71 48red25.450.0655.50 49white 12.7300.2716.85 50white 12.7250.2075.53 51white 16300.2596.58 52white 16750.6178.66 53white 25.4800.68612.46 54white 16200.1505.44 55white 16300.2696.98 56white 12.7951.16010.05 57white 25.41101.12312.40 58white 16750.8079.06 59white 12.7300.2386.67 60white 16700.6277.17 61white 16400.4187.50 62white 12.71101.55012.34 63white 16300.2827.63 64white 12.7350.3506.32 65white 25.4200.1786.68 66white 16750.7658.79 67white 12.7450.3985.06 68white 16500.4367.28 69white 16800.88810.09 70white 25.4200.17010.49 71white 25.4150.1527.28 72blue12.7200.1734.20 73blue16100.1214.35 74blue25.4300.2345.88 75blue25.41101.28813.17 76blue12.71201.25010.93 77blue16300.3495.00 78blue16200.1594.97 79blue12.7450.3875.42 80blue12.7800.7598.14 81blue25.4700.68911.31 82blue12.7600.5945.69 83blue12.7400.3575.40 84blue12.71301.80812.12 85blue12.7850.9289.42 86blue161001.37812.09 87blue12.7400.3615.31 88blue25.4750.6268.81 89blue12.7901.1078.98 90blue16350.2915.94 91blue25.4200.1495.73 92blue16500.4786.49 93blue161201.63613.42 94blue25.4300.2767.91 95blue25.4400.47211.36 96blue12.7200.2325.57 97black 16800.2339.00 98black 12.7800.1867.83 99black 12.7900.2938.00 100 black 161100.4038.53 101 black 25.4600.0879.11 102 black 16900.2557.91 Energy(J)Depth(mm) Appendix A (continued)NO. Color Impactor size(mm)Diameter(mm)103 black 25.41100.41712.89 104 black 12.7900.2949.00 105 black 16700.1518.76 106 red25.4900.30511.51 107 red25.4800.20712.00 108 red12.7600.1277.46 109 red161200.49311.80 110 red12.71000.3429.47 111 red16700.1838.00 112 red16600.12110.04 113 red12.71000.3689.12 114 red25.4900.23212.78 115 white 12.7600.0317.75 116 white 25.41000.35712.16 117 white 12.7900.3088.73 118 white 12.7800.2408.91 119 white 25.4800.22812.62 120 white 161360.50410.61 121 white 12.71360.6448.44 122 white 16700.1479.12 123 white 161100.3288.27 124 blue12.71000.2438.59 125 blue12.7700.2087.61 126 blue12.7700.0927.74 127 blue12.71200.5298.54 128 blue25.41200.41812.87 129 blue12.7800.1697.22 130 blue25.41000.2729.15 131 blue161100.3398.05 132 blue161300.57610.02 Energy(J)Depth(mm)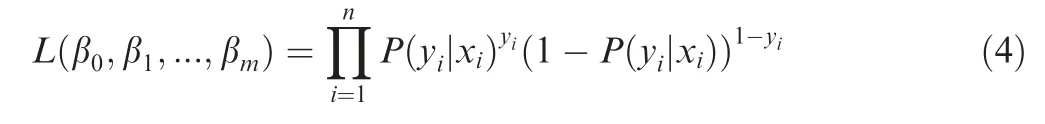

2.2. BVID threshold
3. Experimental
3.1. Low-velocity impact (LVI) experiment


3.2. Visual inspection

4. Results and discussion
4.1. Reliability analysis


4.2. Logistic regression model


4.3. Visual detectability evaluation


5. Conclusions
Declaration of Competing Interest

杂志排行

CHINESE JOURNAL OF AERONAUTICS的其它文章
- Tangling and instability effect analysis of initial in-plane/out-of-plane angles on electrodynamic tether deployment under gravity gradient
- Aerodynamic periodicity of transient aerodynamic forces of flexible plunging airfoils
- Effects of swirl brake axial arrangement on the leakage performance and rotor stability of labyrinth seals
- Experimental and computational investigation of hybrid formation flight for aerodynamic gain at transonic speed
- Tomography-like flow visualization of a hypersonic inward-turning inlet
- Hypersonic reentry trajectory planning by using hybrid fractional-order particle swarm optimization and gravitational search algorithm