Facilely synthesized N-doped graphene sheets and its ferromagnetic origin
2021-03-14YunpengWuDeyangYuYiFengLeiyunHanXilongLiuXudongZhaoXiaoyangLiu
Yunpeng Wu,Deyang Yu,Yi Feng,Leiyun Han,Xilong Liu,Xudong Zhao,Xiaoyang Liu
State Key Laboratory of Inorganic Synthesis and Preparative Chemistry,College of Chemistry,Jilin University,Changchun 130012,China
Keywords:Graphene Nitrogen doping Ferromagnetism Magnetic coupling interaction Defect
ABSTRACT Inducing ferromagnetism into graphene is vital today because it has a wide range of applications such as spintronics devices and magnetic memory devices.In this paper,we will report a new method to synthesize ferromagnetic graphene by nitrogen doping.X-ray photoelectron spectroscopy (XPS) and Raman spectroscopy were utilized to testify the N-doped material and further discuss the N-doped process.The superconducting quantum interference device (SQUID) was put in and used to analyze the magnetic properties of the N-doped graphene sheets.It shows that the material exhibits ferromagnetism at both 3 K and 300 K and the ferromagnetic saturation moment is 0.412 emu/g and 0.051 emu/g,respectively.The mechanism of the origin of the ferromagnetism in N-doped graphene sheets will also be discussed in this paper.It shows that,when the amount graphitic N reached the threshold,the origin of the ferromagnetism will change from defects induced by nitrogen atoms to the transition in energy band caused by graphitic N.
Nanomaterials with magnetism have always been discussed by scientists.In current technological applications,most magnetic materials are mainly based on the d and f elements [1–3].However,the d and f elements mostly are metallic elements which can be harmful to the environment.Therefore,people are in sore need of non-metallic magnetism materials which can be used in industrial manufactures.
Carbon-based materials and metal-free organic ferromagnets have entered the scientists’awareness since the discovery of C60[4].Many experiments regarding the ferromagnetism of carbonbased materials have been carried out,such as the ferromagnetism of highly oriented pyrolytic graphite (HOPG) materials [5,6],roomtemperature ferromagnetic carbon nanotube [7]and soft magnetic C60[4].
Graphene is one of the most important discoveries in carbonbased materials,which has many extraordinary properties such as large specific area,high electrical conductivities,and excellent thermal and mechanical properties due to its almost perfect two-dimensional system [8–10].However,the magnetic properties of graphene are not widely studied by scientists because it is nonmagnetic itself.Therefore,developing an effective method to synthesize ferromagnetic graphene with high magnetization is vital for applications in novel spintronic devices.Some of the research focuses on producing magnetism in graphene by creating edge defects.The defects give rise to strong Stoner ferromagnetism at the sublattice [11].The strong long-range coupling between local magnetic moments at the same sublattice can maintain room-temperature ferromagnetic ordering against thermal fluctuations [12].Yue designed plasma-enabled graphene with ultra-long defective edges and ultra-dense lattice vacancies.The designed graphene displays robust ferromagnetism with large saturation magnetization of up to 2 emu/g at 5 K and 1.2 emu/g at room temperature.This work identifies plasma-enabled graphene nanopetals as a promising candidate for graphene-based magnetic devices [13].Gao also designed defect-related ferromagnetism in ultrathin metal-free g-C3N4nanosheets.Results indicate that the saturation magnetization of the samples increase with the carbon defect concentration,revealing its carbon defect related ferromagnetism [14].However,the disadvantage of creating edge defects in graphene is that it is difficult to control the quantity of the edge defects.For this reason,we often cannot attain the desired satisfactory ferromagnetic material.The other strategy is to hydrogenate graphene so that we can obtain semi-hydrogenation graphene sheets which can exhibit ferromagnetism.This method was previously predicted in 2013 by Wong and Pumera [15].When the graphene is not completely hydrogenated,it has tunable band gap and displays ferromagnetism.The delocalizedπbonding network of graphene is broken by half-hydrogenation,and the electrons in the unhydrogenated carbon atoms will be unpaired which can make a magnetic sheet with structural integrity and magnetic homogeneity.Semi-hydrogenation is based on the band gap model and different from the method of creating edge defects to form zigzag edges,which is based on the local electric model[14,15].Much research have been put forward regarding the hydrogenation of graphene.Sun reported the controllable hydrogenation of graphene using high energy mechanic exfoliation method with acetic acid as hydrogenating agent.The results of magnetic measurement indicated the maximal magnetic moment of 0.274 A m2/kg at 2 K for semi-hydrogenation grapheme [16].However,the process of hydrogenating is so complicated such that we cannot apply this method to large scale industrial production [16].
In our view,the ideal method is doping with foreign atoms,such as N atoms,into graphene lattice.This method has been proven to be an effective way to tune the electronic properties of carbon nanotubes and widen their applications [17,18].Researches demonstrated that N doping is effective in inducing localized magnetic moments in graphene,which can create magnetic ordering in graphene and thus generate different kinds of magnetic properties [19,20].Similar to hydrogenation,by controlling the nitrogen content,we can also modify the ferromagnetism in the material.After nitrogen atom doping,there can be three categories of nitrogen configurations in graphene plane,including graphitic N,pyrrolic N and pyridinic N [21].Li reported the synthesis of Ndoped graphene with 6.02% doping concentration through a highthroughput hydrothermal method.The primary nitrogen configuration of the as-prepared N-doped graphene is pyrrolic N.At room temperature,the sample exhibits significant ferromagnetism with a high saturation magnetic moment (MS=0.37 emu/g at 4 K) and a narrow coercivity (181.4 Oe) among graphene materials [20].The ferromagnetism of the as-prepared N-doped graphene originates from the generation of a large amount of doping defects which can introduce the localized magnetic moments.Bło´nski also reported ferromagnetic graphene which depends strongly on both the nitrogen concentration and type of nitrogen-containing structural (graphitic N) generated in the host lattice [22].The material displayed a saturation magnetization reaching 1.09 emu/g at the Curie temperature of 69 K.The strong ferromagnetism of the Ndoped graphene in this work,was graphitic N,can significantly improve the electric features of graphene.The drawback of doping nitrogen atom is that it could inevitably induce some oxygen atoms which could overwhelm the effect of nitrogen itself.The oxygen atoms could dramatically decrease the ferromagnetism in the materials [21].
Regarding the N-doped graphene,the three categories of nitrogen configuration have different effects to graphene.However,there are few reports to distinguish the origin of its ferromagnetism.It is vital to know when defects induced by nitrogen atoms or the transition in energy band show the major function,how much ferromagnetism they will give,and how the ferromagnetic saturation moment and the coercive force varies.All the information will give us a thorough view to the ferromagnetism of graphene induced by nitrogen atoms.In this work,we will present a new route to prepare ferromagnetic N-doped graphene nanosheets from melamine and expandable graphite.The ferromagnetism in N-doped graphene can be easily controlled by modifying the nitrogen content and the type of nitrogen-containing structures in the material.The as-exfoliated N-doped graphene sheets showed ferromagnetism and the mechanism of the origin of the ferromagnetism of graphene sheets will be discussed in this paper.
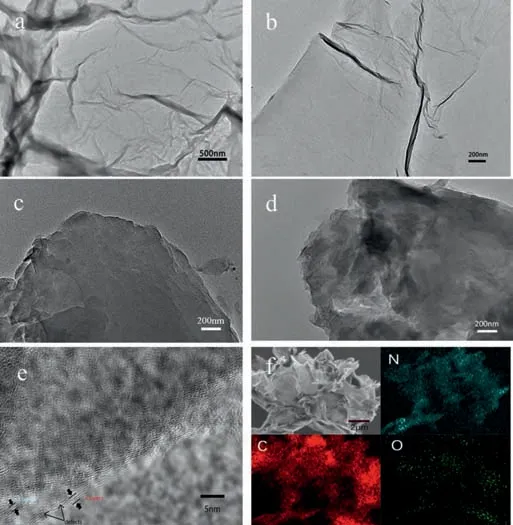
Fig.1.(a,b) Low-resolution TEM image of the sample 1–10.(c,d) Low-resolution TEM image of the sample 1–0.(e) High-resolution TEM image of the sample 1–10.(f) The sample 1–10 was characterized by EDS elemental mapping.
First,0.5 g expandable graphite and melamine were mixed in different mass ratios (1:0,1:1,1:3,1:5,1:10) and milled in the agate mortar for 15 min.The mixture was then heated at 900 °C(According to previous research [23],this temperature is optimal to expand the graphite) for 6 h in a N2atmosphere at a tube furnace (OTF-1200X-60,Kejing) and the black wormlike samples were be obtained.The N-doped graphene nanosheets were fabricated by ultrasonic exfoliation using ethanol as the medium.After the ultrasonic process,the black dispersion liquid was centrifuged at 1000 rpm for 5 min and the supernatant was retained.Finally,the supernatant was further centrifuged at 13,000 rpm for 10 min.The solid matter was dried in a vacuum drying oven at 60 °C for 12 h and the final sample can be obtained.The samples in different mass ratios of expandable graphite and melamine haves been defined as sample 1-0,sample 1-1,sample 1-3,sample 1-5,sample 1-10,respectively.
The morphology of the sample was characterized by fieldemission scanning electron microscopy (SEM,JEOL JSM 6700F) and transmission electron microscopy (TEM,FEI Tecnai G2 F20 S-Twin D573) with an acceleration voltage of 200 kV.The composition and structure of the materials were examined by powder X-ray diffraction (XRD,Rigaku D/Max 2550 V/PC,Japan Cu-Kαradiation,λ=0.15418 nm) and Raman microscopy (Renishaw inVia Confocal Raman spectrometer using a solid-state laser at 532 nm as the excitation source).The electron binding energies of various kinds of carbon and nitrogen were determined by X-ray photoelectron spectroscopy (XPS) on an ESCALAB250 apparatus.The ferromagnetic impurities were measured by Inductively-coupled plasma optical emission spectrometer (ICP,iCAP 7600 ICP-OES).The ferromagnetism of the N-doped graphene sheets was measured on a superconducting quantum interference device (SQUID,Quantum Design Inc.).
Figs.1a and b show the TEM image of as-prepared sample 1–10 which shows a wrinkle-decorated layer structure.It is noticeable that,from Fig.1b,the wrinkles can be clearly seen on the plane which is a distinctive character of few-layer graphene.However,the wrinkles are not shown in sample 1–0 and the sample does not show a few-layer structure which indicates that melamine plays a key role in intercalation-assisted exfoliation (Figs.1c and d).Highresolution TEM image of sample 1–10 was shown in Fig.1e which reveals that the sample had been exfoliated to few-layer structure.Fig.1f shows the SEM image and corresponding EDS elemental mapping which clearly shows the uniform distribution of C,N and O elements over the graphene sheets and demonstrate that the material is carbon-based with nitrogen atom doping.
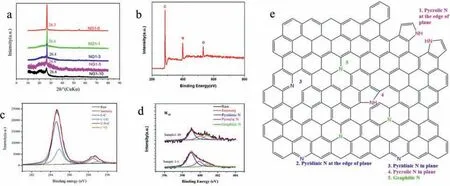
Fig.2.(a) XRD patterns of sample 1-0 and sample 1-10.(b) XPS survey spectrum of sample 1-10.(c) High-resolution C 1s spectrum of sample 1–10.(d) N 1s spectrum of sample 1–10 compared with sample 1–1.(e) Schematic representation of the bonding configurations for N atoms in graphene lattice.
In Fig.2a,the X-ray powder diffraction (XRD) patterns of the samples were shown in order to examine the structure of the materials.The distinct [002]peak at about 26.3° in the patterns of graphite-like carbon was also shown on the pattern of sample 1–0.On the other hand,the pattern of sample 1–10 shifts to 26.8°which suggests that the nitrogen atoms doped into the graphitic structure and the peak was broadened which indicated that the material has been exfoliated to few layers structure.Other samples also show the phenomenon of peak shift,but not as prominent as sample 1–10.In addition,the weak peak in sample 1–5 and sample 1–10 shown at around 21° attributed to the glass substrate background.
X-ray photoelectron spectroscopy (XPS) is a powerful tool to identify the elements’states.By analysis of binding energy (BE)values,we can confirm the nature of the binding between carbon and nitrogen.Fig.2b shows the XPS survey spectrum of the sample 1-10.The results show the sample 1-10 is carbon-based and the nitrogen content is about 7.71%.There are 1.41% oxygen atoms in the N-doped graphene which come from the surface adsorption and incomplete reduction of residual oxygen-containing structure on expanded graphite.Fig.2c shows the high-resolution C 1s spectrum of sample 1–10.After being Gaussian fitted,four distinct peaks locate at 284.7 eV,284.9 eV,288.6 eV and 289.0 eV,which were attributed to C-C,C-OH,C-N and C=O respectively.Fig.2d shows the comparison of the high-resolution N 1s spectrum between sample 1–1 and sample 1–10 and it reveals that there are mainly three kinds of nitrogen status including the graphitic N(401.1 eV),the pyrrolic N (400.5 eV) and the pyridinic N (398.8 eV)[20],which also correspond with the bonds between carbon and nitrogen in the C 1s spectrum.Pyridinic N refers to the bond between nitrogen atom and two carbon atoms at the defects or edges of the graphene lattice,whereas pyrrolic N represents the nitrogen atoms at the edge of a five-membered ring.Graphitic N is formed by substituting a carbon atom in a complete 2D honeycomb lattice[24].
What should be noticed is that before the reaction,when the content of melamine increased,the content of graphitic N increased in the final sample.To analyze the mechanism here,a schematic representation was depicted in Fig.2e.Five different kinds of bonding configurations for N atoms was shown on the picture including the pyrrolic N at the edge of the plane,pyridinic N at the edge of the plane,pyrrolic N in plane,pyridinic N in plane and the graphitic N.When melamine is heated over 525 °C,a retrogressive reaction ocurrs,and melamine can react into C3N4.With the temperature increasing to 800°C,the C3N4polymer could completely decompose into nitrogen-containing species (C2N2+,C3N2+,C3N3+) [25].The nitrogen-containing species served not only as the nitrogen source,but also as the intercalation agent.When the initial content of melamine is low,there could be less nitrogen-containing species from the melamine after heated.Therefore,the species was not able to insert to the interlayer of the expanded graphite.The N-doped reaction mostly happened at the edge of the plane which resulted in the low content of graphitic N.The dominant nitrogen bonding configuration is the pyridinic N at the edge of the plane which can form zigzag edges to introduce local magnetic moment.On the other hand,when the content of melamine is high,there could be abundant nitrogen-containing species inserted into the interlayers.Thus,the nitrogen doping reactions are able to happen in the plane which can result in high content of graphitic N in the material.In addition to graphitic N,there could also be few pyrrolic N and pyridinic N inside the plane which can cause vacancy defects in the graphene plane and introduce unpaired spin.Theπbonding network of graphene would be broken and greatly enhance the ferromagnetism [13,20].
Table S1 (Supporting information) shows the elemental analysis of the sample obtained from the XPS characterization of the survey spectra in different ratio.The results show that carbon is always the dominant element in the material.The more melamine in the raw material before the reaction,the more nitrogen content in the final sample.In addition,the oxygen content decreases with nitrogen content increase,which demonstrates that melamine is not only used as the nitrogen resource and intercalator,it also can reduce the oxygen-containing structure and drive oxygen away from the material.The reduction in oxygen content makes nitrogendoped graphene more likely to exhibit ferromagnetic characteristics because the absorption of oxygen makes graphene shows ptype semiconductor behavior [21].
To further study the material,Raman spectroscopy characterization was utilized to discuss the electronic and structural properties and characterize the crystalline quality of as-prepared samples.Fig.3a shows the Raman spectroscopy of D band (1350 cm-1)and G band (1585 cm-1) of all the samples.The G band refers to the first-order scattering ofE2gmode of graphite and is related to the in-plane vibration of sp2hybridized carbon-carbon bonds.The D band represents the amount of disorder.The 2D band is attributed to the second-order Raman spectrum and it allows qualitative identification of the thickness of the graphene [26].There are several changes of the three peaks.First of all,both the nitrogen doping and exfoliating process can dramatically enhance the D band.Doping nitrogen atom can induce the zigzag edge defects which can lead to the enhancement of D band.Ultrasonic exfoliating process could exfoliate the bulk graphite to few-layer structure which will also enhance the D band.Secondly,when the nitrogen content increased,the G band split into two peaks gradually which is also in accord with Deng’s work whose N-doped graphene derived from ammonia plasma treatment of pure grapheme [24].The G band splitting is caused by the disruptive effect of graphitic N to the graphene lattice and this phenomenon is prominent in sample 1–10 which confirms the previous discussion that samples with high nitrogen content have more graphitic N than samples with low nitrogen content.The G band shifted to lower frequency when the nitrogen content is high because of the n-type doping which can be clearly seen in Fig.3b.Noticeably,from sample 1–3 to sample 1–10,the declining trend turns out to be more obvious,which is also caused by the strong disrupting effect of graphitic N [23].The intensity ratio of D band to G band (ID/IG) is an indicator to measure the disorder degree of the graphene.Fig.3c shows theID/IGof the different samples.ID/IGincreases along with the content of melamine increase.TheID/IGof sample 1–10 is 1.21 which is higher than the bilayer graphene (0.47) and monolayer graphene (1.02) and this demonstrated that N-doped graphene increases the degree of disorder.From sample 1-3 to sample 1-5 to sample 1–5,it shows an apparent increasing trend which is caused by the strong disrupting effect of graphitic N.Fig.3d shows the measured 2D Raman band of the material in different ratios.There are 4 peaks after the Gaussian peak fitting,and are located at 2658 cm-1,2688 cm-1,2706 cm-1and 2721 cm-1,respectively which is in accord with the reports from Malard [27].The peaks at 2658 cm-1and 2706 cm-1belong to composition of graphene and the peaks at 2688 cm-1and 2721 cm-1belong to the composition of graphite.As the content of melamine in raw material increased,the intensity of 2658 cm-1and 2706 cm-1peaks increased,which indicate that the bulk expanded graphite had been exfoliated to few-layer structures.Furthermore,the peak at 2658 cm-1has a distinct red shift which demonstrated that the N-doped reactions happened.
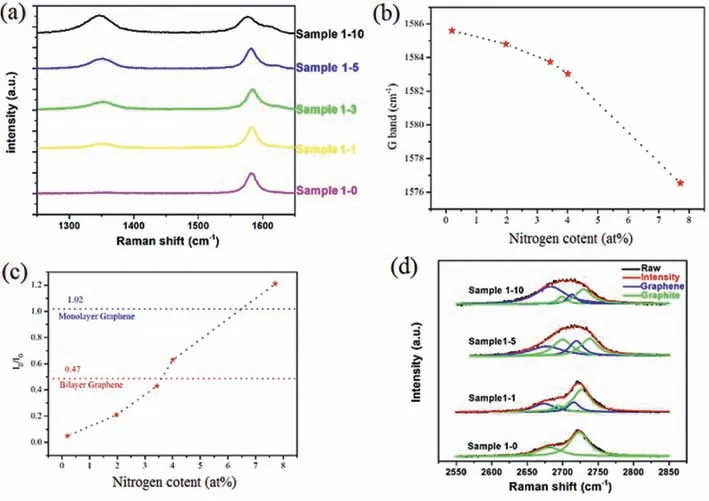
Fig.3.(a) Raman spectroscopy of D band and G band of the samples.(b) The parameters G band of samples.(c) The parameters ID/IG of samples.(d) The measured 2D Raman band of the material in different ratio.
To evaluate the sample in atomic scale,AFM was utilized to analyze the sample 1-10.The thickness of sample 1-10 was measured to be~2 nm with the AFM (Figs.S1a in Supporting information),which proves that the sample is few-layer structure.Furthermore,in Fig.S1b and c (Supporting information),the sample shows a relatively rough surface,and a large number of irregular ridges and wrinkles can be observed on the surface,which is obviously different from the normal smooth graphene surface.The roughness of the sample obtained with AFM is 0.257 nm.The irregular ridges and wrinkles inside of the N-doped graphene are caused by nitrogen-doping induced graphitic N.Other noteworthy points are more obvious ridges and wrinkles at the edge of the Ndoped graphene,which are due to the edge-defects produced by exfoliating.
Inductively-coupled plasma optical emission spectrometer (ICP)is utilized to carefully check the content of the ferromagnetic impurities in all our samples.As shown in Fig.4a,the ferromagnetic impurities are negligible (less than 1.9 ppm) and the contribution of magnetic impurities can be ignored.
The SQUID was employed to measure the magnetic properties of sample 1-0,sample 1-1,sample 1-3,sample 1-5,sample 1-10.Fig.4b shows the hysteresis loops measured at 3 K and the inset in Fig.4b is the zoom-in part of the hysteresis loops which shows the typical magnetic hysteresis and indicate the appearance of ferromagnetic states.The saturationMSof the sample 1-0,sample 1-1,sample 1-3,sample 1-5,sample 1-10 at room temperature are calculated to be 0.024 emu/g,0.073 emu/g,0.128 emu/g,0.250 emu/g,0.412 emu/g respectively which are shown in Fig.4c.As for sample 1-0,sample 1-1,sample 1-3,theMSincreased with the nitrogen content which was attributed to the amount of defects induced by nitrogen doping increases,and this result is consistent with theID/IGof the samples in different ratios.In sample 1–5,the sample shows a sharp rise of theMSbut with only a slight rise of nitrogen content which is shown in Fig.4d.The sample with high nitrogen content (sample 1–10) reveals an even higher saturation magnetization.As stated,there are two kinds of model of the ferromagnetism of graphene.The first one is based on the magnetic moments that induced by nitrogen-induced defects [28],while the second one is based on the energy band.According to Sofo,the dangling bond in graphene could be partially hydrogenated and form a hexagonal network,which can produce a controllable band gap and ferromagnetism.In this network,the itinerant electron magnetism and localized magnetic moments appear clearly because the valance electrons in p-states are more delocalized,so that they could have much more spatial extension which can promote long-range magnetic coupling interaction [29].According to our discussions above,when there is less melamine in raw material,the N-doped reaction mostly occured in the edge of the expanded graphite plane and there was less graphitic N in the N-doped graphene.The weak ferromagnetism originates from the irregular distribution of the zigzag edges caused by the doping atoms which agreed with the theoretical calculation by Li that the nitrogen doping can induce the magnetic moment to the material[30].The irregular distribution of the zigzag edges could form local magnetic moments,but in low proportion.On the other hand,when there is more melamine before the reaction,there could be more C3N4polymer decomposed into the nitrogen-containing species.Plenty of nitrogen-containing species will permeate into the layers and provide a unique way to produce vacancies and graphitic N,which is also s in the XPS result.The increase of graphitic N content will lead to a structural mutation [31].According to Zhang’s report,nitrogen-doping could effectively enhance the magnetic moments by producing vacancies in varying degrees (1–3μB),which is much higher than the magnetic moments from zigzag edges (<0.95μB) [32].Furthermore,the electronic saturated doping graphitic N atoms could also have a similar impact with hydrogenated graphene.When the certain amount of graphitic N reaches the threshold,these magnetic domains caused by graphitic N will be jointed and establish long-range magnetic ordering.The reason for sample 1–5 showing a sharp rise of theMSbut with slightly rise of nitrogen content is that the content of graphitic N and vacancies just reached the threshold which make the sample promote long-range magnetic coupling interaction.From Figs.4c and d,we can notice that,compared with the low nitrogen content samples,the sample with high nitrogen content need less coercive force to reach the saturation magnetism because the local magnetic domains caused by the nitrogen induced defects will be jointed.The extended p-p interactions that come from the magnetic coupling between 2p moments can be easily magnetized by the external magnetic fields.The results shown in our work are also consistent with previous work that the energy band model has more ferromagnetic effect on the graphene than the localization of carrier model which caused by the zigzag defects [33,34].In the meantime,the results also demonstrate previous reports which stated that the N-doped graphene with high graphitic N content shows much higher saturation magnetism (1.09 emu/g at 5 K) [22]than that with high pyrrolic N content (0.37 emu/g at 4 K) [20]and high pyridinic N content (0.28 emu/g at 10 K) [35].
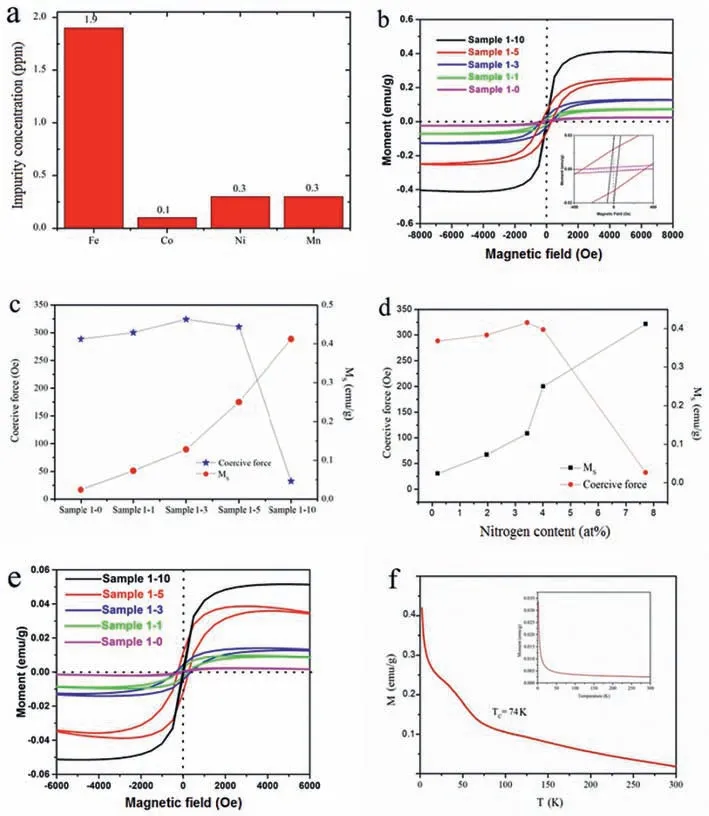
Fig.4.(a) Contents of the metal impurities (such as Co,Fe,Ni or Mn) measured via ICP-OES.(b) Magnetization measurements of sample 1-0,sample 1-1,sample 1-3,sample 1-5,sample 1-10 at low temperature (3 K).The insets are the zoom-in part of the hysteresis loops.(c,d) The saturation magnetic moment and coercive force for reaching the saturation magnetism of the sample 1-0,sample 1-1,sample 1-3,sample 1-5,sample 1-10 at room temperature.The x-axis represents samples and nitrogen content respectively.(e) Magnetization measurements of sample 1-0,sample 1-1,sample 1-3,sample 1-5,sample 1-10 at 300 K.(f) Magnetization-temperature (M-T) curve of sample for sample 1-10 under an external magnetic field of 500 Oe.
The hysteresis loops measured at 300 K is shown on Fig.4e which indicate that the N-doped graphene sheets also have ferromagnetism in room temperature.The observed ferromagnetic saturation moment in sample 1–10 is 0.051 emu/g.The magnetic measurements for the doped sample show a similar ferromagnetism enhancement with a higher saturation magnetic moment at 300 K.Noticeably,the ferromagnetic saturation moment did not show sharp rise from sample 1–5 to sample 1–10.
To evaluate the effect of temperature to the magnetism,the magnetization-temperature (M-T) curve is shown in Fig.4f.The result of the M-T curve shows that the Curie temperature (TC) of sample 1–10 is about 74 K under the applied fieldH=500 Oe.Interestingly,the M-T curve of sample 1–10 is different from that of sample 1–0 which shows dominant paramagnetic behavior (inset of Fig.4f).The slight ferromagnetism of sample 1–0 is from defects of the sample.For sample 1–10,there are two main contributions,i.e.,ferromagnetic and paramagnetic behaviors.In low temperature phase,the result shows a high magnetization which is accordance with Bło´nski’s work that the magnetically active motifs inside the graphene lattice evolved and leads to high ferromagnetism state [22].This phenomenon is similar to the percolation theory in statistics that only when the concentration of nitrogen reach the percolation threshold,the sample will promote long-range magnetic coupling interaction and shows a sharp rise of ferromagnetic behavior [36].On the other hand,the origin of ferromagnetism in high temperature phase is from defects and zigzag edges which are incapable of establishing the long-range magnetic ordering to form an integral magnetic domain.These results prove that the ferromagnetic behavior of sample 1–10 is induced by the nitrogen doping and also agree with Bło´nski’s work that when the concentration of nitrogen exceeds 5 at%,graphene shows a relatively high ferromagnetism at low temperature [22].
Compared with other previous works [20,22,28,35,37],the nitrogen doped graphene in this work shows an excellent performance in ferromagnetism which has relevantly high saturation magnetization in both room temperature and ultra-low temperature conditions.Furthermore,the preparation method in this work is simple,low cost and eco-friendly.Therefore,this work can provide following insights for future research of the ferromagnetic nitrogen doped graphene.
To summarize,N-doped graphene sheets were prepared,and the magnetic properties of the products were thoroughly characterized.The results showed that melamine served not only as the nitrogen source,but also has an intercalation impact to the expanded graphite.The N-doped graphene sheets show maximum ferromagnetism with the saturation magnetic moment at about 0.412 emu/g which is more than 16 folds higher than that of the exfoliated expanded graphite,making the N-doped graphene sheets an extraordinary candidate for the applications in many important electromagnetic devices.Experimentally,if the amount of graphitic N reaches the threshold value,the origin of the ferromagnetism will change from defects induced by nitrogen atoms to the transition in energy band caused by graphitic N.
Declaration of competing interest
The authors declare no conflict of interest.
Acknowledgment
This work was supported by National Natural Science Foundation of China (Nos.21271082 and 21371068).
Supplementary materials
Supplementary material associated with this article can be found,in the online version,at doi:10.1016/j.cclet.2021.04.054.
杂志排行
Chinese Chemical Letters的其它文章
- Long-wavelength (red to near-infrared) emissive carbon dots:Key factors for synthesis,fluorescence mechanism,and applications in biosensing and cancer theranostics
- Nanotechnology combining photoacoustic kinetics and chemical kinetics for thrombosis diagnosis and treatment
- The point-of-care-testing of nucleic acids by chip,cartridge and paper sensors
- Sodium bicarbonate,an inorganic salt and a potential active agent for cancer therapy
- New advances in gated materials of mesoporous silica for drug controlled release
- Current development in wearable glucose meters
