Theoretical analysis and numerical simulation of acoustic waves in gas hydrate-bearing sediments∗
2021-03-11LinLiu刘琳XiuMeiZhang张秀梅andXiuMingWang王秀明
Lin Liu(刘琳), Xiu-Mei Zhang(张秀梅),†, and Xiu-Ming Wang(王秀明)
1State Key Laboratory of Acoustics,Institute of Acoustics,Chinese Academy of Sciences,Beijing 100190,China
2University of Chinese Academy of Sciences,Beijing 100149,China
3Beijing Engineering Research Center of Sea Deep Drilling and Exploration,Institute of Acoustics,Chinese Academy of Sciences,Beijing 100190,China
Keywords: gas hydrate-bearing sediments, Carcione–Leclaire model, time-splitting staggered-grid finitedifference,slow-wave characteristics
1. Introduction
Acoustic wave propagation in porous media,such as gas bearing or oil bearing sediments encountered in petroleum exploration, a kind medium with a single fluid filled in the porous medium,has been studied extensively in the past three decades. Boit was the first one to tackle the problems of wave propagation in a single fluid filled porous medium.[1,2]He deducted the equations of wave propagation in biphasic porous media by using the Lagrange equation for the first time.Biot theory predicts that there are two types of P-wave (fast P-wave and slow P-wave) and one kind of S-wave in fluidsaturated porous media. His work provided a theoretical foundation for the acoustics of porous media. Plona[3]observed the slow P-wave propagating in porous media in the laboratory, which greatly promoted the further research of the Biot theory. In fact, there is more than one fluid in porous media. In order to be consistent with the actual situation, it is necessary to establish an acoustic model where porous media saturated with various fluids. The equivalent fluid theory is used to study wave propagation in two-fluid saturated porous media.[4,5]The improved parameters of liquid–liquid or gas–liquid mixing are used to replace the corresponding parameters in Biot theory. However, the inertial coupling between fluids and between fluid and solid is not considered in this model.Considering capillary pressure and inertial coupling between different phases, Santos et al.[6]established the wave theory of porous media saturated with two viscous immiscible fluids by using the Lagrange equation. The theory predicts that there are three compressional and one shear waves in two-fluid saturated porous media. Three-phase porous media are composed of a solid grain frame with a fluid and a solid coexist in pores such as frozen food media and natural gas hydratebearing sediments.Leclaire[7]proposed the percolation theory based on Biot theory and analyzed the acoustic wave propagation in frozen porous media such as frozen soil or permafrost.The theory predicts three compressional and two shear waves produce when acoustic wave propagates in frozen porous media. However,Leclaire assumed that there was no direct contact between solid grains and ice. On this basis, Carcione et al.[8]proposed Carcione–Leclaire model,considering there is direct contact between solid grains and ice.
Gas hydrates are globally widespread in continental margin sediments and permafrost regions. The amount of gas hydrates in gas hydrate-bearing sediments is enormous and the amount of carbon in gas hydrates is twice that in other fossil fuels. Thus, it is essential to study the characteristics of gas hydrate-bearing sediments for its exploration and development.[9–14]Gas hydrate-bearing sediments are multiphase porous media, composed of two solids (solid grain frame and gas hydrate) and a fluid (usually it is water).[15,16]The properties of natural gas hydrate are similar to ice. Based on Carcione–Leclaire model, the characteristics of waves in gas hydrate-bearing sediments are studied, and their applications on the inversion of the reservoir parameters are given,which indicates that the model has great academic value and practical application potential.[17–19]In the study of wave propagation in three-phase porous media, Carcione et al.[8]used the Fourier pseudospectral method to simulate the wave field in frozen porous media. However,the acoustic field calculated has numerical dispersion to some degree, which can not clearly show the propagation and interaction of each wave.The staggered-grid finite-difference algorithm with high precision,is widely used in wave field numerical simulation of elastic medium,viscoelastic medium and biphasic medium.[20–22]In previous work,researchers[23–25]simplified the gas hydratebearing sediments into a two-phase porous media and simulated wave propagation of three kinds of waves with the staggered-grid finite-difference algorithm. The results obtained are of high accuracy. However,they can not accurately describe the propagation of five waves in gas hydrate-bearing sediments due to the simplification.
The above works show that many researchers have carried out a lot of work, and have summarized many understandings on wave propagation in gas hydrate-bearing sediments.However,limited by the current calculation models and algorithms, the propagation characteristics of wave modes in gas hydrate-bearing sediments have not been clearly revealed. In this paper,the staggered-grid finite-difference algorithm is introduced to the further numerical simulation of the wave field in gas hydrate-bearing sediments based on Cacione–Leclaire model, where the time-splitting method[8,26]is used to solve the stiffness problem in the first-order velocity–stress equations. The splitting method divides the equation into a stiff part and a non-stiff part. The stiff part can be solved analytically,and the non-stiff part is solved using the staggered-grid finite-difference algorithm. The simulation results illustrate that the time-splitting staggered-grid finite-difference algorithm can simulate the wave propagation process with higherprecision and lower grid dispersion compared with those presented in Carcione’s work.[8]According to the snapshots and waveforms obtained, the energy distribution and propagation characteristics of the waves in gas hydrate-bearing sediments are analyzed in detail. Furthermore, the effects of the friction coefficient between solid grains and hydrate and the viscosity of pore fluid on wave propagation characteristics are discussed. The results show that the friction coefficient between solid grains and gas hydrate and the viscosity of fluid are the main factors determining the slow-wave attenuation. Finally,through the study of acoustic wave propagation in fluid–solid models, the reflection, transmission and energy conversion characteristics of different waves at the interface are given in this paper.
2. Theory of acoustic wave propagation in multiphase porous media
Gas hydrate-bearing sediments are multi-phase porous media composed of solid grains with solid particles and water coexist in pores. Several assumptions are made for the model:One is the components are respectively connected; the other is the wavelengths are supposed to be greater than the minimum length of homogenization. According to the Lagrange equation,the equations of momentum conservation can be deducted from Hamilton’s least-action principle.
In this section, according to Carcione–Leclaire threephase model theory,[8]based on Zhao’s work[26]for Biot’s poroelastic equations, combined with the stress–strain relations and the equations of momentum conservation, the first-order velocity–stress wave equations for two-dimensional(2D) wave propagation in gas hydrate-bearing sediments are derived firstly, then the time-splitting high-order staggeredgrid finite-difference algorithm is extended to simulate the wave field in gas hydrate-bearing sediments.
2.1. First-order velocity–stress equation
The stress–strain relations can be expressed as[8]


The time derivative of Eq.(1)can be written as


The equations of momentum conservation[8]can be expressed as


where

In this way, the following equations of momentum conservation are obtained,which are conducive to the establishing of the following numerical simulation method:

where γijand Πijare the elements in the matrix γ and Π.
Equations (2) and (5) constitute the first-order velocity–stress equations for 2D wave propagation in gas hydratebearing sediments based on Carcione–Leclaire theory.
2.2. Algorithm implementation
The eigenvalues of the propagation matrix of the equation of motion have negative real parts. Due to the friction coefficients, these eigenvalues are different greatly in magnitude.Generally,the existence of the large and small eigenvalues of the propagation matrix indicates that the equation system is stiff.[27]A partition method[8]is used to solve the problem of stiffness. We obtain the analytical solution from the stiff part as the initial value, and input it into the non-stiff part of the velocity–stress equations. The staggered-grid finite-difference method is used to solve these non-stiff equations.
The stiff part of the velocity-stress differential equations can be written in the matrix form[8]as

where
A11=b12(γ12−γ11)+b13(γ13−γ11),
A12=b12(γ11−γ12)+b23(γ13−γ12),
A13=b23(γ12−γ13)+b13(γ11−γ13),
A21=b12(γ22−γ12)+b13(γ23−γ12),
A22=b23(γ23−γ22)+b12(γ12−γ22),
A23=b23(γ22−γ23)+b13(γ12−γ23),
A31=b12(γ23−γ13)+b13(γ33−γ13),
A32=b12(γ13−γ23)+b23(γ33−γ23),
A33=b23(γ23−γ33)+b13(γ13−γ33).
In the following discussion, the treatment for a porous medium in Ref.[26]is used for our case. The analytical solution of Eq. (6) in the two-dimensional space is shown as follows:

where

ξ1and ξ2are eigenvalues of exp(St).
The non-stiff part of the velocity–stress differential equations can be written in a matrix form as

An intermediate vector is defined as the input for the staggered-grid finite-difference algorithm

The 2D staggered-grid finite-difference form of the non-stiff part can be written as(take the solid grain frame as an example)
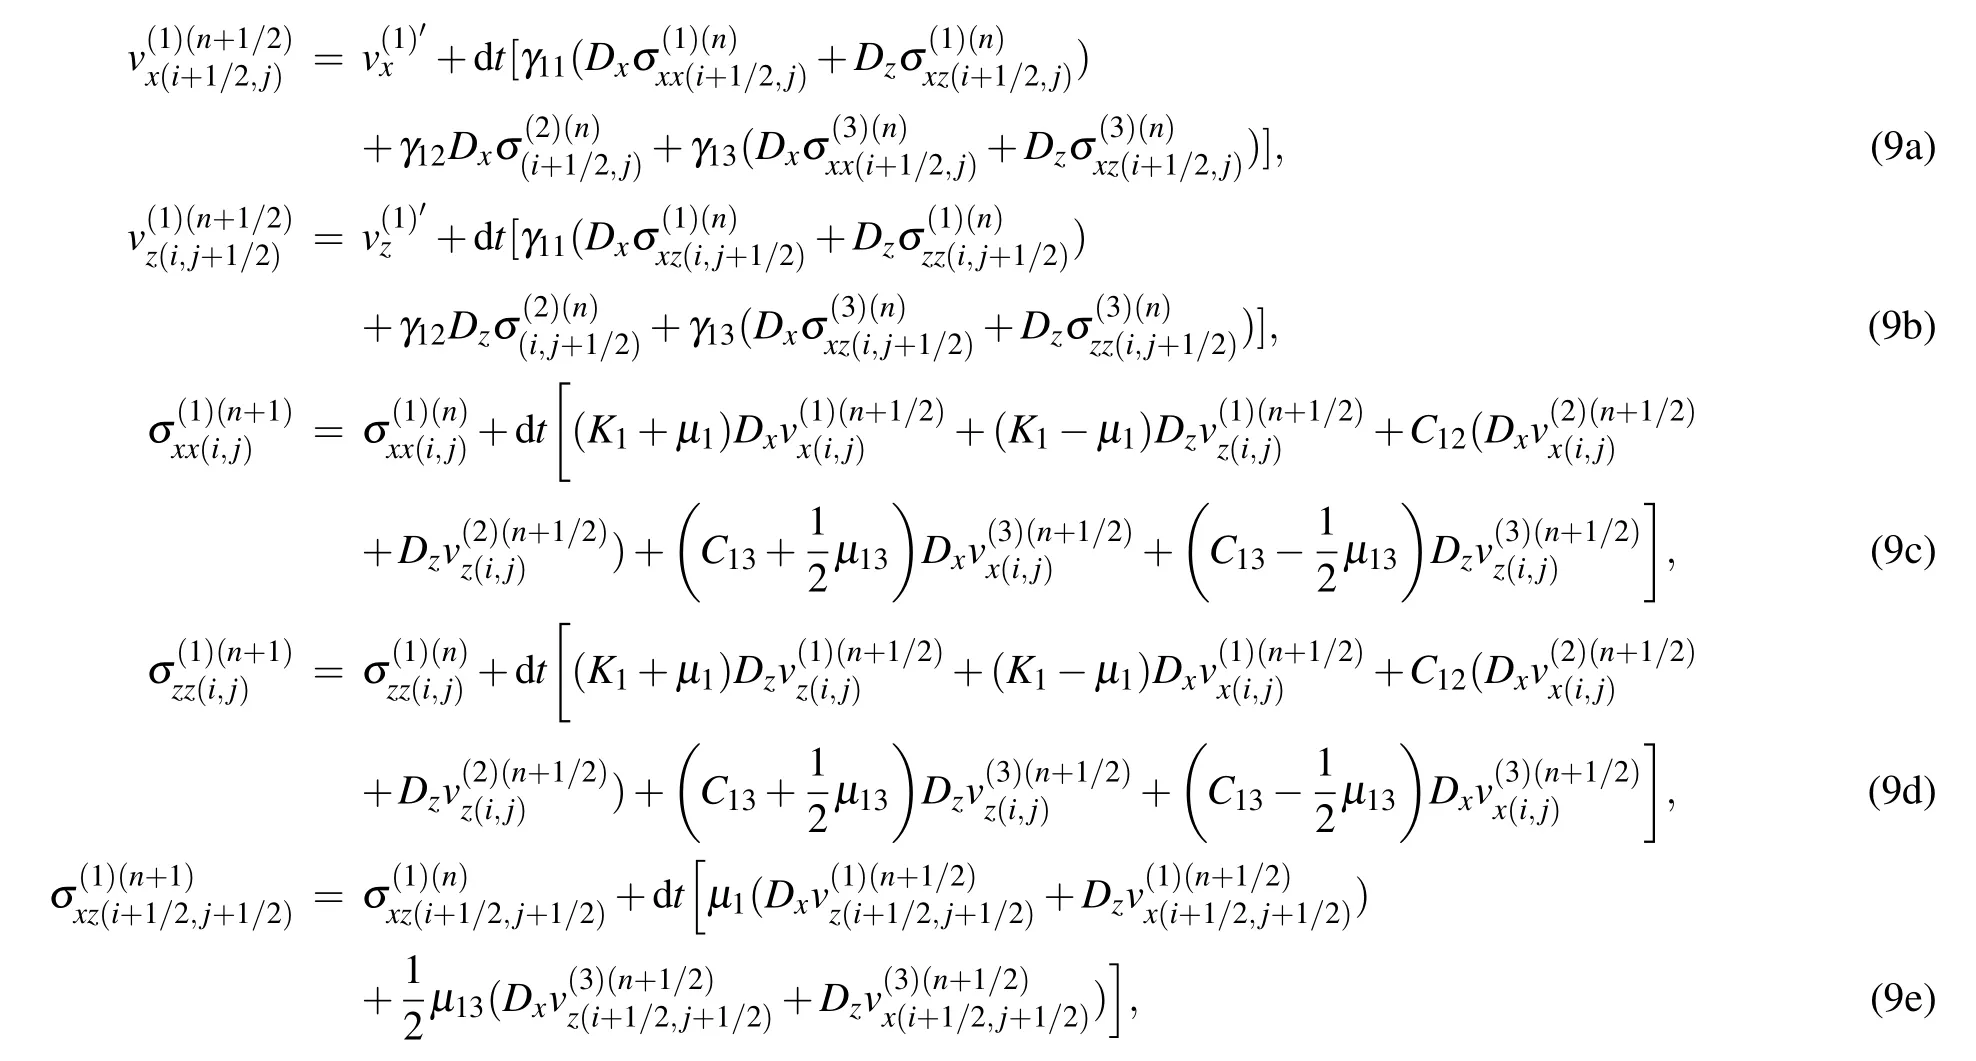


where L is the length of the difference operator. In this paper,L is taken as 4. The staggered-grid finite-difference method possesses an eighth-order accuracy in space. In the twodimensional (2D) case, the distribution of the field quantities and the medium physical parameters in the staggered-grid finite-difference method is shown in Fig.1.

Fig.1. Distribution of the field components and material parameters in the staggered-grid finite-difference algorithm.
3. Numerical simulation
In this section, the time-splitting high-order staggeredgrid finite-difference algorithm’s effectiveness and accuracy are verified and applied to the wave numerical simulation in gas hydrate-bearing sediments. The energy distribution and propagation characteristics of waves in gas hydrate-bearing sediments are analyzed, and the excitation mechanisms of waves are discussed. The effects of the friction coefficient between solid grains and gas hydrate and the fluid viscosity on wave propagation are studied. Finally, the acoustic wave propagation in a double-layer model is studied.The reflection,transmission, and energy conversion characteristics of different waves at the interface are provided.
3.1. Algorithm verification
The source used in the simulation is a Ricker wavelet that can be expressed as[24]

where f0is the dominant frequency.
The effectiveness of numerical simulation is verified by comparing the result with that of the Fourier pseudospectral method by Carcione et al.[8]In the comparison, the same model and medium parameters given in Carcione and Seriani’s work are employed except that the parameters of gas hydrate is replaced by ice, The absorbing boundary condition proposed by Collino et al.[28]is used to eliminate the influence of the artificial boundary. In the numerical simulation, the grid size of the model is 2500×2500, the space step in the x and z directions are both 2 m,and the time step is 0.4 ms. The source with the dominant frequency 12.5 Hz is located at the grid point(1250,1250),which is loaded on the stress components of each phase:


where φs,φw,and φiare the volume fractions of the solid grain,the pore fluid,and the ice,respectively.
As shown in Fig.2,the snapshots of the solid–grain frame vertical particle velocity component with the two algorithms are compared,it is clear that the time-splitting staggered-grid finite-difference algorithm can obtain a higher-precision simulation result with clearer waves. Moreover, there is no visible grid numerical dispersion. The result shows that the timesplitting staggered-grid finite-difference algorithm is more accurate in the numerical simulation of a three-phase porous media. We can use the algorithm to study the various excitation mechanisms and propagation characteristics of different waves in gas hydrate-bearing sediments.
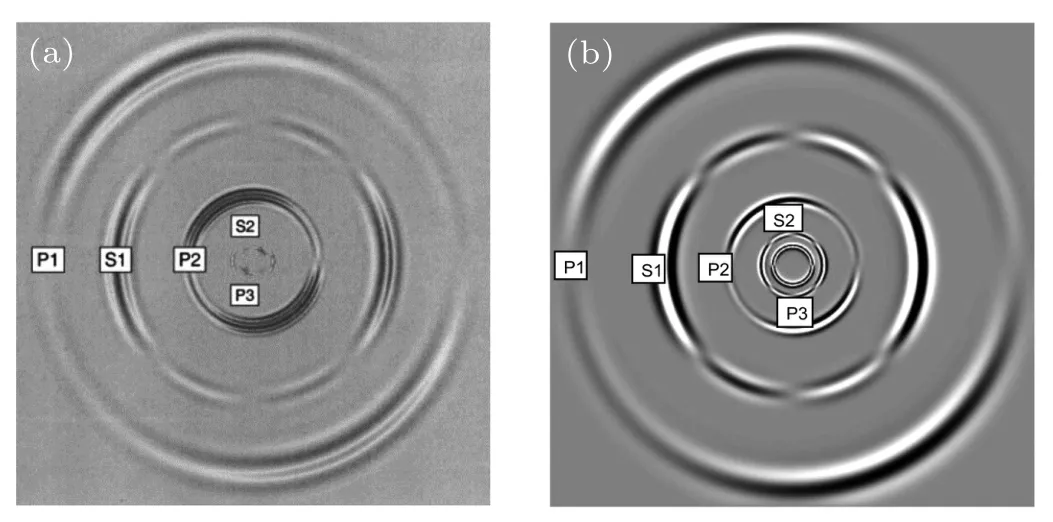
Fig.2. Snapshots of the solid grain frame vertical particle velocity component at 680 ms. (a)Carcione’s simulation result by using the pseudospectral method[8]. (b)Simulation result of the staggered-grid finite-difference.
3.2. Homogeneous model
We consider wave propagation in a homogeneous gas hydrate-bearing sediment model. In the two-dimensional plane,the increasing x direction is horizontal to the right,and the positive z direction is vertical downward. The mesh size of the model is 800×800,the time and space steps are the same as those used in Subsection 2.1, and the physical parameters of the homogeneous medium model are given in Table 1. The source is loaded on the horizontal velocity component of each phase. The dominant frequency of the Ricker wavelet at the grid point(400,400)is 20 Hz.

Table 1. Physical parameters of different phases.
3.2.1. Analysis of wave characteristics
Snapshots of the velocity components of the solid grain frame,the pore fluid and the gas hydrate at 280 ms are shown in Figs. 3(a)–3(f). In this case, five kinds of body waves can be clearly observed for each phase, the three compressional waves are labeled P1, P2, and P3, and the two shear waves are labeled S1 and S2. It can be seen that when acoustic wave propagates in gas hydrate-bearing sediments,the wave propagation mechanism is controlled by the interaction of the solid grains, the hydrate, and the pore fluid. Therefore, the generated five acoustic modes are more complex than those in the homogeneous elastic medium with P1 and S1 modes only,and it is desirable to study the features of five wave modes in various cases.

Fig.3. Snapshots of the horizontal particle velocity component of (a) solid grain frame, (b) pore fluid, (c) gas hydrate, and the vertical particle velocity component of(d)solid grain frame,(e)pore fluid,(f)gas hydrate at 280 ms.
Comparisons of normalized waveforms of the horizontal velocity component of different phases are performed to investigate the excitation mechanisms of the waves in hydratebearing sediments as indicated in Fig.5. The model used is consistent with that in Fig.3, and the receiver is set at the grid point(100,780). The structure of the model is shown in Fig.4. The different figures correspond to comparisons between waveforms(a)the solid–grain frame and pore fluid,(b)the solid–grain frame and gas hydrate, (c) the pore fluid and gas hydrate. It is clear that P1 and S1 are the usual modes as those in isotropic medium that propagate in the solid–grain frame primarily, while P2 and S2 are mainly concentrated in the gas hydrate,and the energy of P3 propagates mainly in the pore fluid.As for the phase of movement of these wave modes,P1 and S1 are all in phase in the three phases. The other wave modes, however, show different appearances. Figure 5(a) reveals the motions of P3 in the solid frame particle and pore fluid are of the opposite phase. Figure 5(b) shows P2 moves in opposite phase in the solid grain frame particle and gas hydrate,and S2 has the same characteristic as P2. Additionally,figure 5(c)reflects that the movements of the three slow waves in the gas hydrate and the pore fluid are in phase.
As indicated from Figs. 3 and 5, the excitation mechanisms of P1 and S1 are similar to that of fast P wave and S wave in fluid saturated porous media, the propagation characteristics of P2 and P3 are similar to the slow P wave. P2 is caused by the relative motion between solid–grains and gas hydrate, P3 is caused by the relative motion between solid–grains and pore fluid,and S2 is caused by the relative motion between solid grains and gas hydrate.
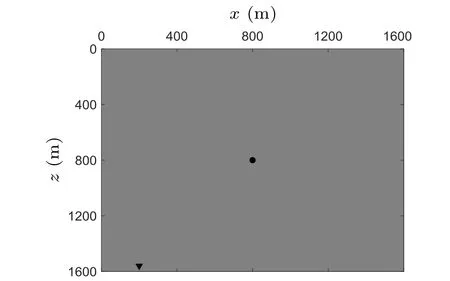
Fig.4. Sketch map of the homogeneous model. The source is denoted by a black spot. The receiver is represented by a black triangle.

Fig.5. Waveform comparisons of the horizontal particle velocity component between different phases(normalized). (a)Solid grain frame and pore fluid. (b)Solid grain frame and gas hydrate. (c)Pore fluid and gas hydrate.
3.2.2. Influence of the friction between solid grains and gas hydrate
Investigations from Geurin and Goldberg[29]pointed out that pore-scale friction between solid grains and gas hydrate could be responsible for the shear energy dissipation, and it is essential to study the influence of this friction on wave modes. By combing the expressions for the friction coefficient between solid grains and pore fluid b12,the friction coefficient between pore fluid and gas hydrate b23, and the drag coefficients calculated by Berryman and Wang,[30]Geurin and Goldberg[29]defined the friction coefficient between solid grains and gas hydrate,which can be expressed as


Fig.6. Snapshots of the horizontal particle velocity component when =2.2×10⁸ at 280 ms. (a)Solid grain frame. (b)Pore fluid. (c)Gas hydrate.

Fig.7. Waveforms of the horizontal velocity component of each phase when b13=0 and =2.2×10¹⁰. (a)Solid grain frame. (b)Pore fluid. (c)Gas hydrate.

As presented by others,[18,29]velocity and attenuation of wave modes generated in gas hydrate-bearing sediments are frequency dependent. In order to show the influence of b13on modes at the seismic frequency and the sonic log frequency,we also investigate the case with a higher dominant frequency of the source,where f0is 10 kHz. The waveform comparisons of the horizontal particle velocity of three phases are given in Fig.8 with the same source-receiver spacing as in Fig.7. For the cases of P1, S1, and P3, nonzero friction coefficient b13decreases their amplitude slightly in the solid–grain frame and pore fluid(Figs.8(a)and 8(b)),and increases their amplitude in the gas hydrate obviously (Fig.8(c)). For the cases of P2 and S2, it is clear that the friction coefficient b13makes P2 and S2 attenuate and the attenuation is smaller than that at low frequency in Fig.7. Therefore, the attenuation of P2 and S2 is more sensitive to b13at low frequency. Furthermore, The attenuation of P2 and S2 in different phases is obtained by calculation. b13attenuates P2 by 79.48 percent and attenuates S2 by 90.44 percent in the solid–grain frame (Fig.8(a)). In the pore fluid, the attenuation is 78.28 percent for P2 and 90.33 percent for S2(Fig.8(b)). The amplitude of P2 decreases by 42.97 percent while that of S2 reduces 73.48 percent in the gas hydrate(Fig.8(c)). By comparisons,it is obvious that the attenuation of P2 and S2 in the solid–grain frame and pore fluid is greater than that in the gas hydrate in the presence of b13.Moreover,the attenuation effect of b13on S2 is more obvious than that on P2.

Fig.8. Waveforms of the horizontal velocity component of each phase when =0 and =2.2×10¹⁰ in high frequency. (a)Solid grain frame. (b)Porefluid. (c)Gas hydrate.
Thus, the amplitude of P2 and S2 is obvious when the friction between solid grains and hydrate is negligible. Moreover,in high frequency range,the attenuation of P2 and S2 is less sensitive to b13than in low frequency range.
3.2.3. Influence of the fluid viscosity
In fact, most pore fluids are viscous. The fluid viscosity affects slow-wave propagation in gas hydrate-bearing sediments. The influence of fluid viscosity on waves is analyzed.Referring to the previous literature,[8,29]the viscosity of pore fluid has the value of 1.8×10⁻³Pa·s. Snapshots of the horizontal particle velocity component of the solid–grain frame,pore fluid and gas hydrate are shown in Figs. 9(a)–9(c). The model used is consistent with that in Fig.3. According to the excitation mechanisms, P3 is caused by the relative motion between solid grains and pore fluid. When the pore fluid is viscous,P3 attenuate. Therefore,P3 can not be observed normally in real reservoirs for most situations. The wave energy in the pore fluid becomes the same as that in the solid–grain frame when P3 attenuate completely(Figs.9(a)and 9(b)).

Fig.9. Snapshots of the horizontal particle velocity component when the fluid viscosity ηw=1.8×10⁻³ Pa·s at 280 ms. (a)Solid grain frame. (b)Pore fluid.(c)Gas hydrate.

Fig.10. The horizontal velocity component of each phase when ηw=0 and ηw=1.8×10⁻³ Pa·s. (a)Solid grain frame. (b)Pore fluid. (c)Gas hydrate.
Figures 10(a)–10(c) show waveform comparisons of the horizontal particle velocity of each phase in cases ηw=0 and ηw=1.8×10⁻³Pa·s. The structure of the model is the same as Fig.4. For the cases of P1 and S1,the nonzero fluid viscosity ηwmakes the wave energy in the fluid degenerates to that in the solid grain frame,resulting in an increase of their amplitude in the pore fluid(Fig.10(b)). For the cases of P2,S2,and P3,nonzero ηwattenuates the amplitude of P3 completely but decreases the velocity of P2 slightly. We have also calculated cases with other viscosity values and frequencies, the results are the same as those given in the paper. Hence,figures 9 and 10 reflect that the amplitude of P3 is significant when the pore fluid is non-viscous.
Because of the existence of the friction coefficient b13and the fluid viscosity ηw,it is difficult to observe three slow waves generally in a seismic frequency range, but they carry out a part of energy in practice. Therefore, the influence of slow waves should be considered when processing actual seismic data.
3.3. Horizontal layered medium model
Seismic surveys are commonly used to identify the locations of gas hydrate in marine sediments, however, energy conversions among different modes on the fluid–solid (gashydrate formation) interface are not clear, which hinder the applications of seismic information in the exploration and production of gas-hydrate reservoir. Thus, it is essential to analyze the reflection, transmission, and conversion at the interfaces.[31,32]As a result,wave propagation in a fluid–solid layer model is studied. The mesh has 800×800 grid points,the source is placed at the grid (400, 350) with a dominant frequency 20 Hz. The time and space steps are the same as those mentioned in Subsection 2.1. The structure of the model is shown in Fig.11,where the upper half-space is filled with water (gas-hydrate formation), and the lower half-space is gas-hydrate formation (water). The physical parameters of the model are shown in Table 1. Moreover, the average method is used to calculate the parameters of the fluid–solid interface.[33,34]
Figures 12(a)–12(c)show snapshots of the horizontal particle velocity component of the solid–grain frame, pore fluid and gas hydrate at 400 ms,respectively. The upper half-space is filled with water,and the lower half-space is gas-hydrate formation.The boundary between the upper and lower half-space is denoted by a white line. When the direct P wave(P)excited in the fluid propagates to the interface, reflected, transmitted and various converted waves are produced,including reflected P (RP), transmitted P1 (TP1), transmitted S1 converted by P(TPS1), transmitted P2 converted by P(TPP2), and transmitted S2 converted by P(TPS2),transmitted P3 converted by P(TPP3),transmitted P2 converted by RP(TRPP2),transmitted S2 converted by RP (TRPS2), and transmitted P3 converted by RP (TRPP3). Moreover, when the P wave propagates to the interface, the incident angle is 0. The incident angle of P increases with the increase of time. When the incident angle is equal to the critical angle of the P wave, transmitted P1 propagates along the interface. It produces P head wave(TP1P head wave) in the upper half-space and S1 head wave in the lower half-space(TP1S1 head wave)with lower velocity. Similarly, critically transmitted S1 also produces a head wave(TS1P head wave)in the upper half-space. Furthermore,the transmitted and converted P2 and S2 waves are clearer in the gas hydrate,while the transmitted and converted P3 waves are more obvious in the pore fluid,which indicates that waves formed by transmission and conversion at the interface have different energy in different media.

Fig.11. Sketch map of the fluid-solid model. The source is denoted by a black spot.

Fig.12. Snapshots of the horizontal particle velocity component at 400 ms. (a)Solid grain frame. (b)Pore fluid. (c)Gas hydrate.
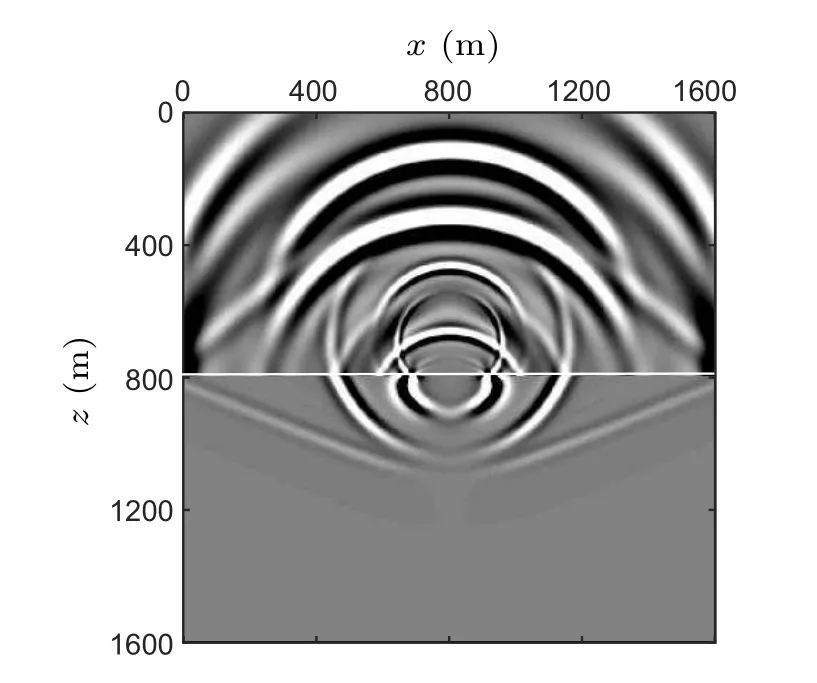
Fig.13. Snapshots of the solid grain frame horizontal particle velocity component at 320 ms.
Figure 13 reflects snapshot of the horizontal particle velocity component of the solid grain frame at 320 ms. The upper half-space gas-hydrate formation,and the lower half-space is is filled with water. Various direct and reflected waves exist in gas-hydrate formation. Besides,when the waves propagate to the interface, the unconventional compressional waves are converted into conventional compressional wave on the interface.
Therefore, fluid–solid models based on Carcione–Leclaire theory have complicated wave field information. The incident wave can produce a variety of reflected, transmitted and converted waves at the interface. The analysis on the interactions of these waves has important values for the applications of seismic in marine area and borehole acoustic during the identification and evaluation of gas hydrate.
4. Conclusion and perspectives
In this paper, based on Carcione–Leclaire three-phase model,the time-splitting staggered-grid finite-difference algorithm is proposed for wave simulation in gas hydrate-bearing sediments. The acoustic wave propagation mechanisms in gas hydrate-bearing sediments are investigated. The findings are the followings:
(i) The numerical algorithm has been proposed and it can be used effectively in solving the stiffness problem in the velocity–stress equations and greatly suppress the grid dispersion. The simulations can clearly show the propagation process of three compressional waves and two shear waves in gas hydrate-bearing sediments, proving that the algorithm is highly-precise for wave field numerical simulation than the Fourier pseudospectral method.
(ii)The analysis of different modes of wave propagation in hydrate-bearing sediments shows that P1 and S1 are equivalent to the conventional compressional and shear waves as are shown in isotropic elastic medium, while P2, S2, and P3,are three slow waves,similar to the slow-wave in Biot theory.P2 and S2 are caused by the relative motion between solid grains and gas hydrate, while P3, by the relative motion between solid grains and pore fluid. Besides, P1 and S1 propagate in the solid–grain frame primarily, P2 and S2 propagate mainly in the gas hydrate, while P3 propagate mainly in the fluid.
(iii) The friction coefficient b13and fluid viscosity ηwhave a certain influence on the propagation of slow waves.The amplitude of P2 and S2 is obvious when the friction between solid grains and gas hydrate is negligible,and the attenuation of P2 and S2 is more sensitive to b13at low frequency. Moreover,the amplitude of P3 is significant when the pore fluid is non-viscous. The wave diffusions of P2 and S2 are influenced by the friction coefficient b13while the diffusion of P3 is controlled by the fluid viscosity ηw. Thus,it is difficult to observe slow waves in seismic frequency band in actual situations.
(iv) By using the double-layer models, it is shown that reflected, transmitted and converted waves are generated at the interface, forming very rich wave fields. Besides, the energy distribution of various waves is different in each phase.The study of various waves in double-layer models is of great significance to the analysis of the characteristics of waves in gas hydrate-bearing sediments. This proposed work can enrich our understanding of the physical process of wave propagation in multi-phased media such as the gas hydrate-bearing sediments.
猜你喜欢
杂志排行
Chinese Physics B的其它文章
- Novel traveling wave solutions and stability analysis of perturbed Kaup–Newell Schr¨odinger dynamical model and its applications∗
- A local refinement purely meshless scheme for time fractional nonlinear Schr¨odinger equation in irregular geometry region∗
- Coherent-driving-assisted quantum speedup in Markovian channels∗
- Quantifying entanglement in terms of an operational way∗
- Tunable ponderomotive squeezing in an optomechanical system with two coupled resonators∗
- State transfer on two-fold Cayley trees via quantum walks∗
