Distribution of Value-added Income of Collective Construction Land Entering the Market Based on the Subject Input Contribution and TOPSIS
2021-02-18ChenguangYUANLingchaoWANG
Chenguang YUAN, Lingchao WANG
Institute of Geography, Henan Academy of Sciences, Zhengzhou 450052, China
Abstract In order to promote the revitalization and development of rural areas and protect the property rights of farmers, it is necessary to explore the reasonable distribution ratio of land value-added income in collective operating construction land. Under the existing land value-added income distribution model, the land value-added income obtained by the government is much greater than that of village collectives, and it is difficult for village collectives and farmers to enjoy greater benefits. This distribution model is not conducive to protecting the property rights of farmers. The results show that there was a positive correlation between land value-added income and land level, that is, the higher the land level was, the higher the value-added income and its ratio to the market transaction price were. According to calculation, the reasonable distribution ratio of the value-added income of collective operating construction land entering the market among the government, village collectives and farmers was 28.6%, 51.1%, and 20.3% respectively. The actual land value-added income obtained by farmers was greatly improved compared with the current situation. In actual operation, this distribution mode has universal applicability. The reform of entering the market in the future also needs to raise the standards for entering the market, explore diversified interest protection channels, and strengthen the construction of rural collective management system.
Key words Collective operating construction land, Land value-added income, Subject input contribution, TOPSIS
1 Introduction
From January 2020, theLand
Management
Law
stipulates that collective operating construction land can fully and directly enter into the market, and rural collective operating construction land is allowed to be leased and sold like state-owned land. The implementation of this policy has brought many opportunities and challenges. For instance, while farmers collectively increase their income, the government has also broadened the way of increasing fiscal revenue instead of increasing fiscal revenue only through levying taxes. However, in the process of entering the market, how to distribute the land value-added income has also become a major difficulty. In particular, the lack of land development rights has led to the unreasonable distribution of land value-added income between village collectives and the government in the process of entering the market; the value-added income obtained by village collectives is often low, and it is difficult to protect its own rights and interests. In the process of entering the market, a reasonable distribution mechanism of land value-added income is of great significance to the development of the economy and society and the protection of farmers’ land property rights. The distribution of land value-added income is the focus of promoting the overall development of urban and rural areas. How to distribute the income, how to define the distribution subject, and how to establish a reasonable distribution mechanism of the income is worth studying.2 Research methods and data sources
2.1 Research methods
2.1.1
Calculation model of land value-added income. The land value-added income generated by collective operating construction land entering the market refers to the net income generated by deducting development, construction, and other costs of rural collectively-owned land entering the market from the final transaction price. According to the transfer price and cost of entering the market, the cost method can be adopted to construct a model to calculate the land value-added income of collective operating construction land entering the market. The formulas are as follows:V
=P
-C
(1)
C
=P
+P
+P
+P
+P
(2)
P
=P
+P
(3)
P
=(P
+P
)×S
+P
×[(1+S
)05-1](4)
P
=(P
+P
+P
)×N
(5)
whereV
is land value-added income, yuan/m;P
is land transaction price, yuan/m;C
is the cost of entering the market, yuan/m; in the composition of the cost of entering the market,P
is land acquisition fee, yuan/m, which represents the government’s compensation fee for village collectives, including land compensation fee (P
) and young crop compensation fee (P
);P
is land development fee, yuan/m, which is determined according to the degree of regional development;P
is investment interest, yuan/m;P
is investment profit, yuan/m;P
is related tax, yuan/m;S
is the one-year fixed asset loan interest rate announced by the People’s Bank of China, %;N
is investment profit rate, %.2.1.2
Distribution model of subject input contribution. Land value-added income is caused by continuous investment, transformation, and optimization of land. According to the reason for contribution distribution, under the action of market mechanism, the subject of land value-added income distribution who has made contributions in the process of land development and utilization and caused land value-added income should participate in the distribution of land value-added income, and the greater the contribution is, the more land value-added income should be obtained. According to the above analysis, a reasonable distribution ratio of land value-added income between the government and village collectives is determined according to the contribution of each interest distribution body to land input. The formula is as follows: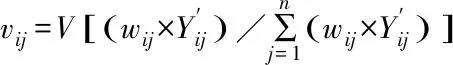
(6)

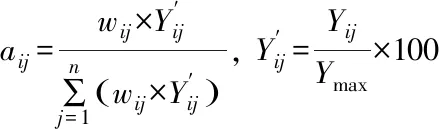
(7)
wherea
is the distribution ratio of land value-added income that thej
distribution subject should get in thei
-level land market;Y
is the land input of thej
distribution subject in thei
-level land market; that is, the higher the importance of the contribution of each distribution subject is, the greater the deserved land value-added income is; the more the distribution subject invests in the land, the greater the deserved land value-added income is.2.1.3
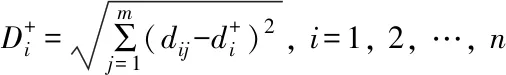
TOPSIS model. The TOPSIS model is a method for comprehensive evaluation based on the closeness of the evaluation index and the idealized index. In this study, the TOPSIS model is used to determine the reasonable distribution ratio of land value-added income within village collectives. The specific steps are as follows:(i) The first step is to establish an evaluation matrix, construct an evaluation index system based on the evaluation object, and standardize the evaluation matrix.

(8)

(9)
(iv) The fourth step is to determine the proximity of the evaluation object. According to the distance of the evaluation index close to the best evaluation and far away from the worst evaluation,T
is determined. The range ofT
is, and the larger the value is, the more important it is.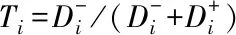
(10)
3 Case analysis
3.1 Sample selection
In this study, Changyuan City, Henan Province was used as the research area. Based on field investigation, it is found that the collective industrial land in Changyuan City has certain particularities. Land value-added income is small, and there are fewer samples of collective housing plots, so it is chosen as the research area. Therefore, the commercial land traded in the form of listed transfer among the collective operating construction land in Changyuan City was selected as the research object to verify the rationality of the estimation model and the reasonable distribution model of land value-added income. The benchmark land price of commercial land in the collective operating construction land of Changyuan City was divided into six levels. After investigation, the geographic location, market transaction price, and market development and construction cost of each sampling point were obtained. Some sampling points with incomplete data and leasing transaction were removed through analysis. Finally, 50 sampling points of commercial land were chosen as the research object from the collective operating construction land of Changyuan City.3.2 Data source and processing
In the analysis and calculation of relevant indicators, the data of 50 sampling points of commercial land are the data of commercial land entering the market from January 1, 2017 to January 1, 2021, and all the samples were traded through listing and transfer, and the transaction price of all sampling points entering the market was corrected to the price on December 31, 2020 for calculation. In the study, the level of the expropriated area in Changyuan City was superimposed with the standard land price level of commercial land, and the calculation was carried out through ArcGIS software. When land development cost was calculated, the benchmark land price of commercial land was calculated according to the standard of the first- and second-level land development degree ("five connections and one leveling") and land development degree from level 3 to 6 ("three connections and one leveling"). In this study, statistical data related to population, output value,etc.
come from the website of Statistics Bureau of Henan Province (http://www.ha.stats.gov.cn) and the statistical yearbooks of Changyuan City.3.3 Calculation results of land value-added income
The 50 sampling points of commercial land traded in the form of listed transfer among the collective operating construction land in Changyuan City were as a case for analysis. The benchmark land price of the commercial land was divided into six levels. The transaction price of commercial land of different levels was different, and the generated land value-added income was also different. After field investigation, there was no first-class land sampling point among the 50 sampling points of commercial land in Changyuan City. This is because the benchmark land price and development and construction cost of the first-level commercial land in Changyuan City were high, and it has entered the land market in the form of expropriation and transfer. Each sampling point was analyzed through ArcGIS software to obtain the spatial location and transaction price of each sampling point. According to the calculation model of land value-added income in Section1
.1
, the land value-added income of each sampling point was obtained. The average of the land value-added income of all sampling points in each level of land was as the final land value-added income of that level of land, and finally the land value-added income of each level of land in the 50 sampling points of commercial land in Changyuan City and its proportion in the market transaction price (Table 1).It can be seen from Table 1 that the land value-added income had a positive correlation with the land grade. Among the 50 sampling points of commercial land, the land value-added income of the second-level land was 488.53 yuan/m, accounting for 79.05% of the market transaction price; the land appreciation income of the sixth-level land was 183.87 yuan/m, accounting for 62.75% of the market transaction price. The above results show that the higher the level of land was, the higher the corresponding land value-added income and the ratio of land value-added income to the market transaction price were.
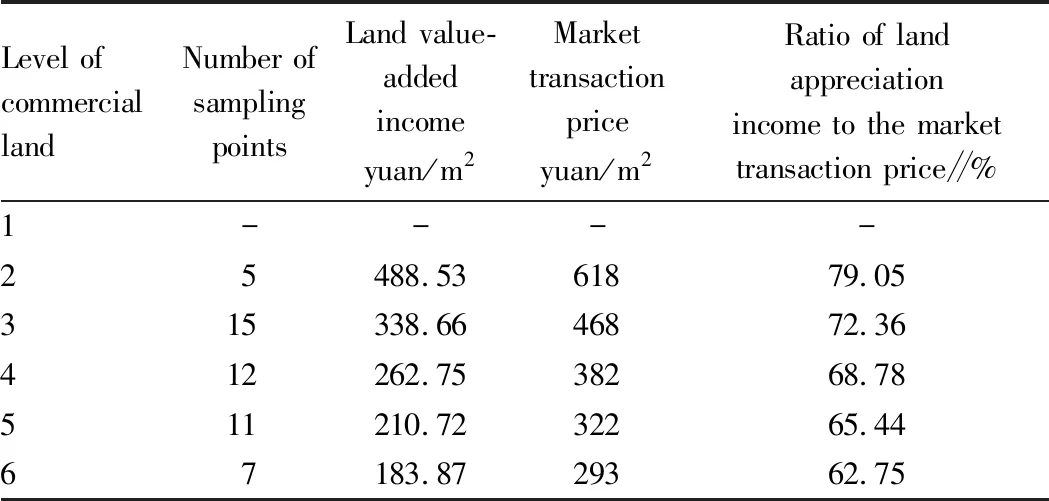
Table 1 Calculation results of the land value-added income of all levels of land in the 50 sampling points of commercial land in Changyuan City
3.4 Determination of the reasonable distribution ratio of land value-added income between the government and village collectives
From the reasonable distribution model of land value-added income in Section2
.2
, it can be seen that the reasonable proportion of land value-added income received by the government was 28.6%, while that of village collectives was 71.4%. It can be seen from Table 1 that the land value-added income of village collectives calculated according to the reasonable distribution model of land value-added income in Section2
.1
.2
was greater than the actual income obtained by village collectives, and the land value-added income obtained by village collectives also rose as the land level increased. Land acquisition price is the comprehensive land acquisition compensation standard obtained by village collectives. It can be seen from Table 2 that the land value-added income of village collectives calculated by the model was greater than the land acquisition compensation standard for the corresponding level of land, showing that the calculated land value-added income that village collectives should obtain under the conditions of entering the market increased significantly. In summary, under this distribution model, the land value-added income received by village collectives greatly increased, while the land value-added income received by the government decreased.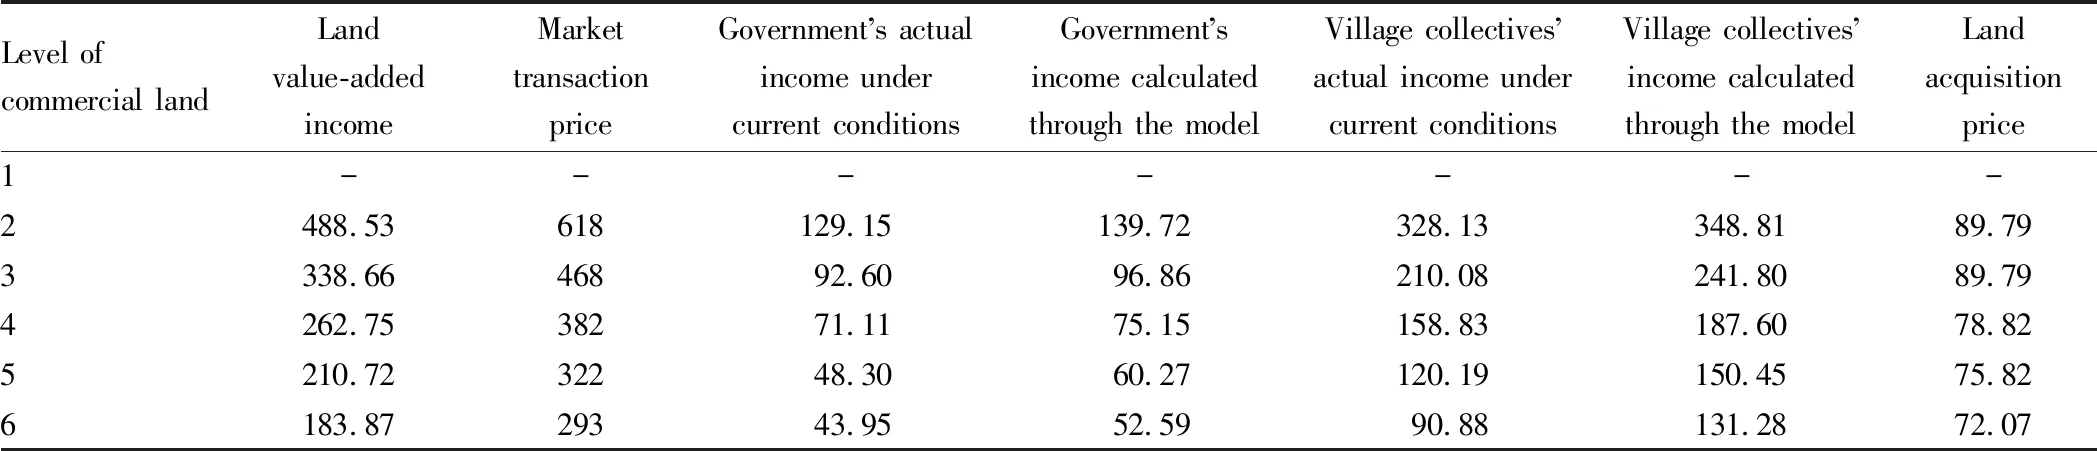
Table 2 Land value-added income distributed by the government and village collectives among the 50 sampling points of commercial land in Changyuan City yuan/m2
3.5 Determination of the reasonable distribution ratio of land value-added income within village collectives
The operating construction land of village collectives in Changyuan City was allocated according to three forms: provident fund, public welfare fund, and currency allocation. In order to obtain a reasonable ratio between collective retention and currency distribution, a questionnaire was used to deeply understand the views of members of the Zhanqi Village collective economic organization on income distribution. This questionnaire was completed in the form of household interviews, and the content was reliable. The 506 households in Changyuan City belong to 9 rural cooperatives. Taking into account factors such as gender, age, and affiliated cooperatives, 23 valid questionnaires (accounting for 4.5% of the total) were selected for further analysis. Among them, the main interviewees were all villagers in Changyuan City (including 2 members of the village committee) and had a certain understanding of collective operating construction land entering the market; there were 11 male interviewees, accounting for 47.8%; most young people went out to work, so most of the interviewees were 45 years old and above, accounting for about 65.2%.The evaluation matrixD
was determined according to the interviewees’ evaluation of the collective income utilization method (scoring 0-5 ), that is, the evaluation ofi
utilization methods byj
interviewees was recorded asX
, and the matrix was standardized to obtain the standardization matrix for the evaluation of internal income distribution. To obtain the final distribution ratio, the importance of the three indicators was normalized. Through calculation, it can be obtained that the ratio of collective retention and currency distribution was 51.1% and 20.3% respectively. That is, the reasonable distribution ratio of land value-added income among the government, village collectives and farmers was 28.6%, 51.1%, and 20.3% respectively.4 Conclusions
In this study, by using the subject input contribution method and TOPSIS method, from the perspective of land property rights and the factors affecting the price of collective operating construction land, reasonable estimation and distribution models of land value-added income were established, and the rationality of the two models was verified through a case. The conclusions are obtained as follows.
(i) There was a positive correlation between land value-added income and land grade. The higher the land grade was, the higher the land value-added income and its ratio to the market transaction price were.
(ii) For the collective operating construction land entering the market, the ratio of land value-added income obtained by the government was 28.6%, and that of village collectives was 51.1%, and that of farmers was 20.3%, which is much higher than the actual land value-added income obtained by village collectives under the existing distribution system. Moreover, the land value-added income of each level of land obtained by village collectives was greater than the land acquisition compensation standard for the same level of land, which effectively protects farmers’ land property rights.
杂志排行
Asian Agricultural Research的其它文章
- Research and Application Progress of Silk Fibroin Membranes
- Application Potential of Quinoa as Forage
- The Agriculture-Tourism Integration to Promote the Rural Revitalization: Taking Tea Industry-Agriculture-Tourism in Lishui City as an Example
- Delimitation of Grain Production Functional Zones: An Empirical Analysis of Fangzi District in Weifang City
- Research on the Curriculum Construction by Promoting Teaching Using Competition Based on Bloom’s Taxonomy of Educational Objectives
- Effects of Fermented Nano Chinese Herbal Medicines Replacing Antibiotics on Production Performance and Carcass Quality of Growing-Finishing Pigs