A video camera recording method for measuring terminal velocity of seed dispersal by wind
2021-01-11MinghuLiuZhimingXinZhiSuYingmingZhaoXinleLiZhiminLiuMarianoConyWeiLiangXuanpingQinJianqiangQianXueCuiQuanlaiZhou
Minghu Liu · Zhiming Xin · Zhi Su · Yingming Zhao · Xinle Li · Zhimin Liu ·Mariano A. Cony · Wei Liang · Xuanping Qin · Jianqiang Qian · Xue Cui ·Quanlai Zhou
Abstract An accurate and convenient method is essential for measuring the terminal velocity of seeds dispersed by wind. Systematic and random errors produced by existing methods lower the accuracy and convenience in determining seed terminal velocity. In this study, a video camera was used to record the falling process of forty-one species of wind-borne seed with eight appendage structures and seven aerodynamic behaviors in a settling tower at a speed of 50 frames per second (fps). The videos were analyzed by Quick Time Player to determine seed acceleration height,acceleration time, and terminal velocity. The results showed that acceleration height and time, terminal velocity, and the difference between terminal velocity and descent velocity(DTD) increased with wing loading. Compared with dropping methods, the camera recording method eliminated the effect of acceleration and corrected seed terminal velocity.Based on wing loading, release heights were determined for accurate measurement of terminal velocity of different seeds. This method, due to its inexpensive equipment, high accuracy, easy observation and operation, can be applied to measure the terminal velocity of wind dispersed seeds,and provides a promising method in exploring the dispersal process of seeds.
Keywords Acceleration height · Acceleration time ·Settling tower · Aerodynamic behavior · Appendage structures
Introduction
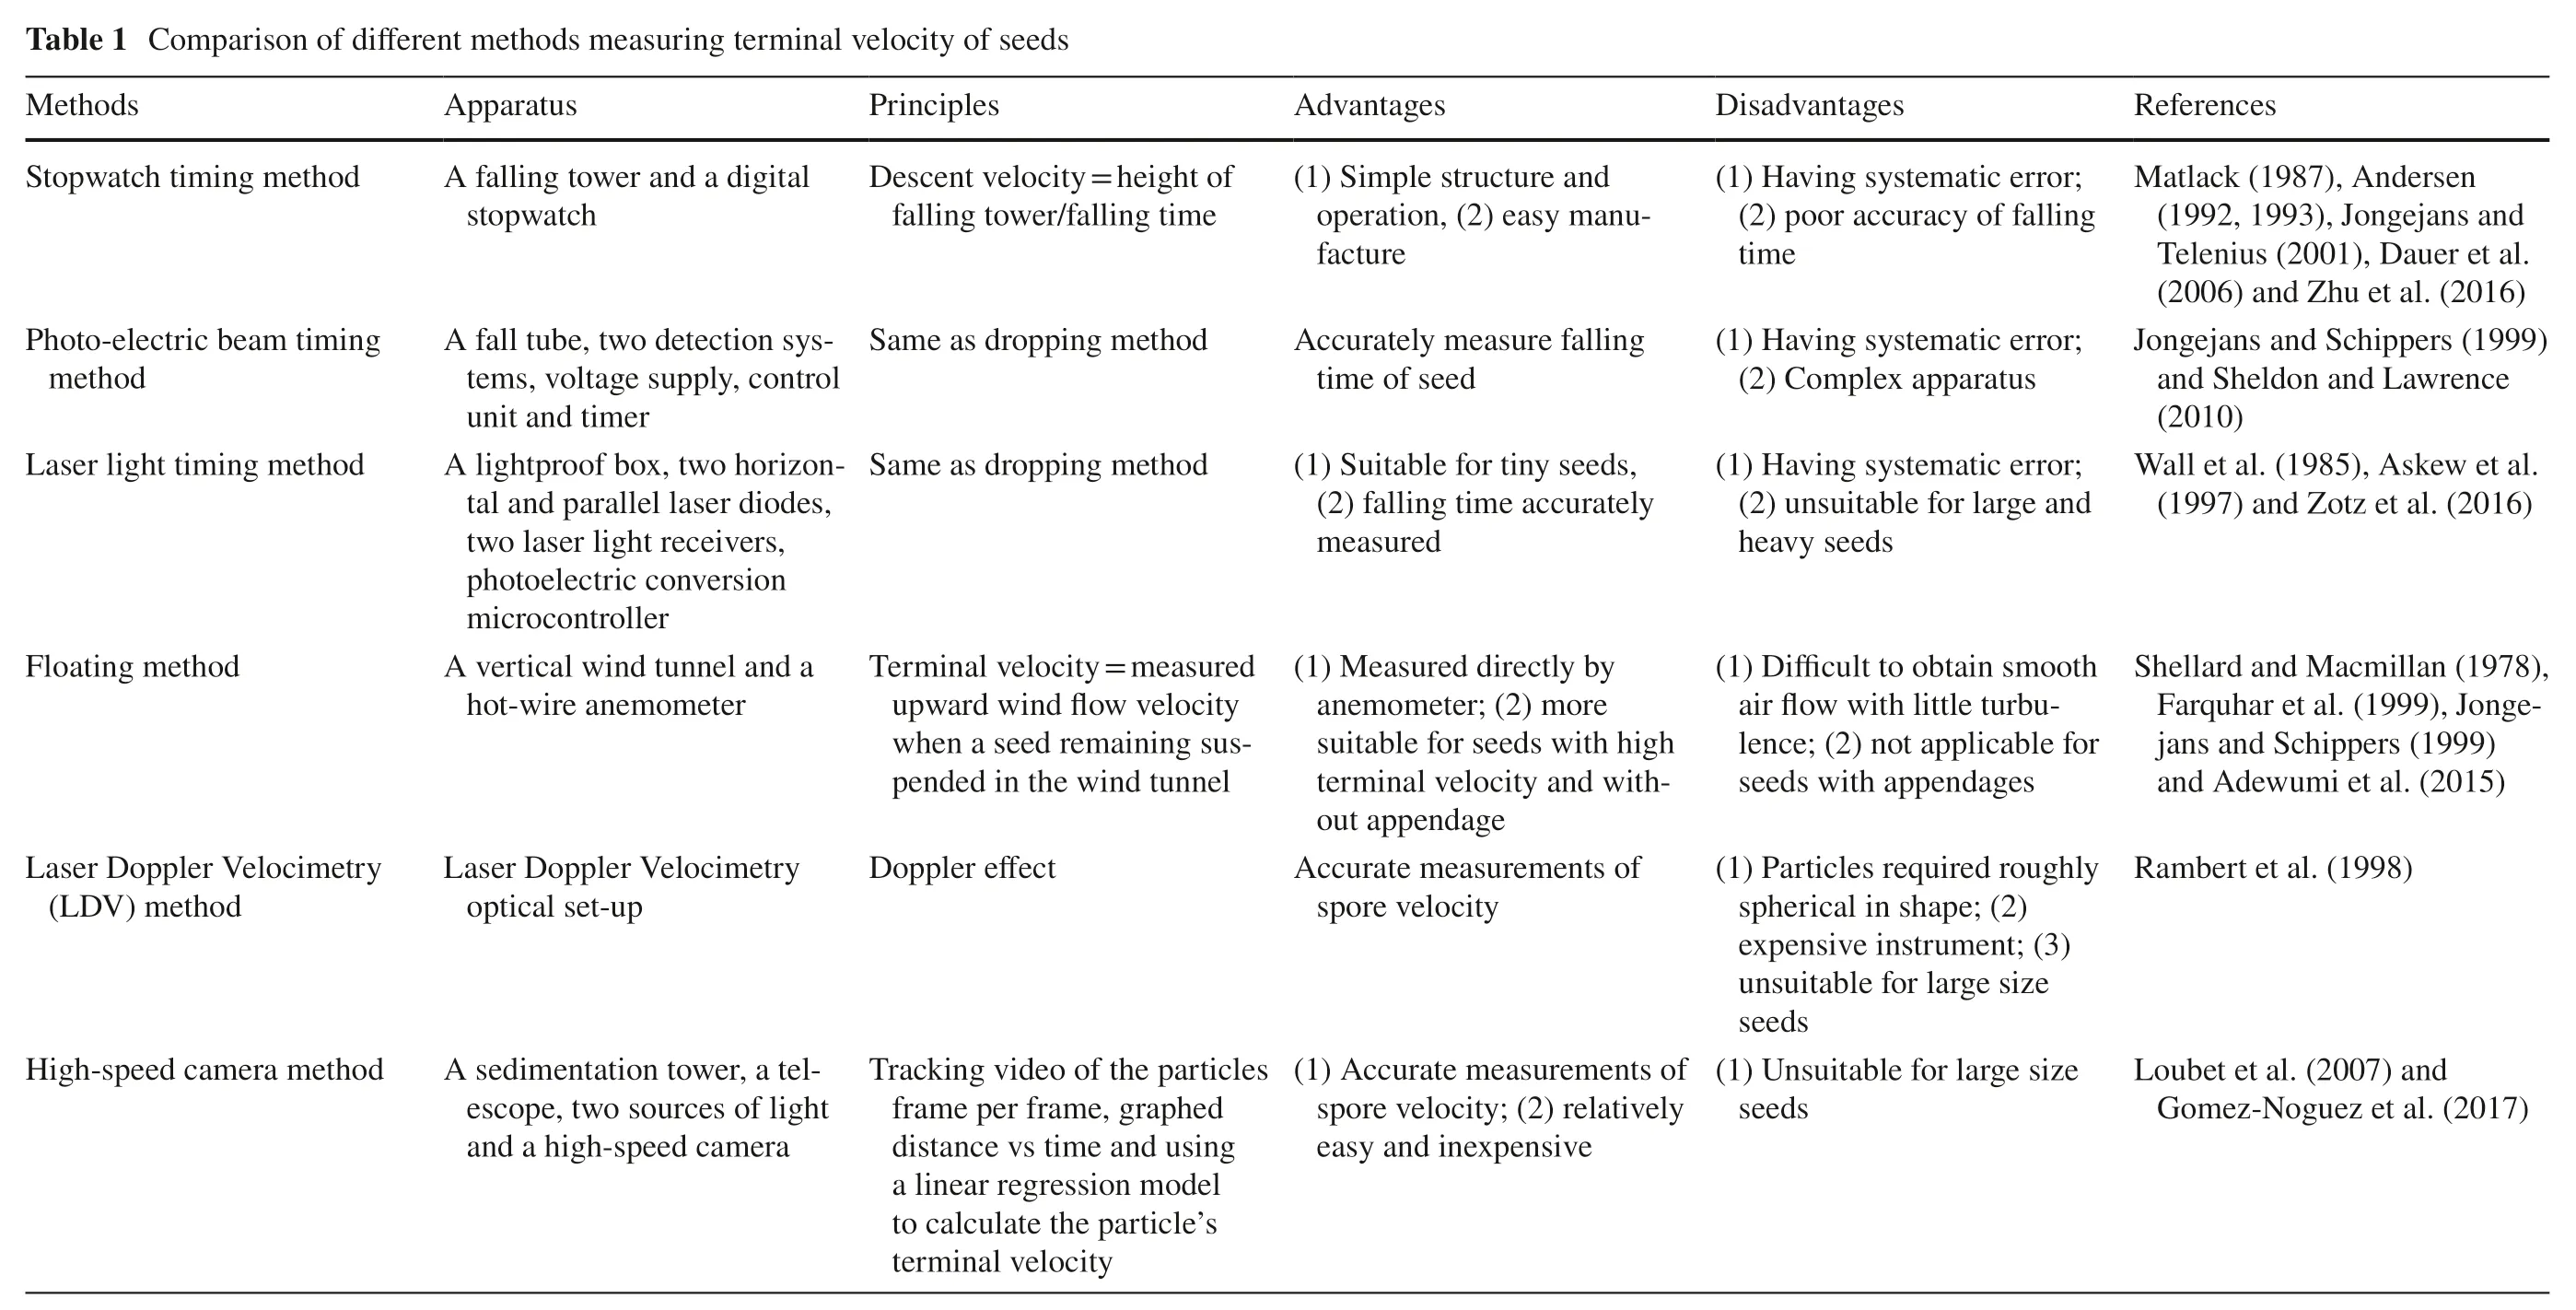
Seed terminal velocity (settling velocity) is def ined as a steady and maximum speed when air resistance exerted on the seed is equal to its pull of gravity during free fall in motionless air (Adewumi et al. 2015). It is an important aerodynamic indicator to evaluate primary, secondary, and long distance dispersal by wind (Andersen 1992, 1993;Bullock and Clarke 2000; Adewumi et al. 2015; Zhu et al.2016; Zhou et al. 2019). Present methods for measuring the terminal velocity of seeds include the dropping and floating methods, laser Doppler radar technology and the high-speed camera method.
n de rs en(1 9 9 2, 1 9 9 3), J o n g e j a n s a n d er et al.et al.78),acmillan ( 19 rence)017)skew), Jon au aw), A hu et al. ( 2016)99))Zotz et al. ( 2016)on and L), A ge-Telenius ( 2001), D ippers ( 1999 ch) and Z References(2006Schippers ( 19 and S Jongejans and(2010)held) and(1997 ellard and M Wall et al. ( 1985 jans and S dewumi et al. ( 2015)d Aert et al. ( 1998 ubet et al. ( 20 Sh Ramb 0 7) an d G o m e z-N o g u e z e t a l. (2 Farquhar et al. ( 1999 an Lo ing systematic error;Matlack ( 1987 ing systematic error;plex apparatus ghly ing systematic error;tages btain smooth-ith little turbu Disadvan ith appendages av av(2) poor accuracy of falling time om l ow w av heavy seeds s w s(1) H(1) H(2) C(2) unsuitable for large and iffi cult to o air f lence; (2) not applicable for seedarticles required rou(1) D unsu(1) P i ta bl e fo rla rg e si ze s e e d s s ph er ic al in sh ap e; (2)e x p e n s i v e i n s t r u m e n t; (3)nsuitable for large size(1) U(1) H seed-easure falling with rements of rements of p le st ru ct ur e an d o p e r a t i o n, (2) e a s y m a n u easu easu inal velocity and im Advantages facture Accurately m u it ab le fo r ti ny se ed s,(2) f a l l i n g t i m e a c c u r a t e l y time of seed and inexpensive measured e as ur ed di re ct ly by a n e m o m e t e r; (2) m o r e s u i t a b l e f o r s e e d s w i t h h i g h-term(1) S out appendage(1) M Accurate m(1) S spore velocity ccurate m(1) A spore velocity; (2) relatively easy ht of er/falling time t velocity = heig articles ethod ethod aining susd tunnel odel inal velocity = measured al velocity of seeds ing m o la se r li gh t re ce iv er s,p h o t o e l e c t r i c c o n v e r s i o n m i c r o c o n t r o l l e r S am e as dr op pi ng ml ow velocity when a seed rem video of the p in e and using falling tow Principles upward pended in the w wind f ear regression m Doppler effect Trackinge p late the particle’s er frame, graphed distance vs tim Same as dropp a lin fram inal velocity Term term horizo to calcu Descen in etection systerm a digital f lig er, a telht meter elocim era ind tunnel and a easuring eed cam timer Apparatus etry tower and n-ethods m htproof box unit and oppler Vp tems, voltage supply, control stopwatch, two h-sp entation tow iff erent m A lig A vertical w A fall tube, two d tal and parallel laser diodes,Laser D hot-wire anemo im A sed optical set-u pe, two sources o tw esco ethod of d and a hig etry ethod ing ethod inarison Comp g m A falling g m in elocim oppler V method era m Table 1 s Method Stopwatch tim Photo-electric beam tim ht tim ethod method Laser lig Floating Laser D) mDV(L-speed cam High
Using the dropping method, (including stopwatch timing,photoelectric beam timing and laser light timing), descent velocity is calculated by dividing seed falling distance by falling time (Table 1). The stopwatch timing method cannot measure falling time accurately due to variations in reaction time of observers (Zhu et al. 2016). Therefore, new apparatus were developed to correct the reaction time of observers using a photoelectric beam, photo sensor and laser light as timers (Table 1). However, the descent velocity is not the terminal velocity because acceleration is not excluded from the falling process (Green 1980).
The floating method can determine terminal velocity by directly measuring an upward wind flow in a wind tunnel using an anemometer when the seed remains suspended in the testing section of the tunnel (Jongejans and Schippers 1999). However, there are three disadvantages with this method: (1) a wind tunnel requires specialized knowledge to construct; (2) an air stream without large turbulence is not easily obtained; and, (3) it is not applicable for seeds with appendages (wings, bristles, pappuses, and plumes). Consequently, it is more suitable for seeds with high terminal velocity and without appendages (Table 1).
The Laser Doppler Velocimetry (LDV) technique has been used to measure the terminal velocity of single spores and spore clusters in still air (Rambert et al. 1998). Nevertheless, few studies have been conducted with Laser Doppler technology to measure the terminal velocity of seeds.However, the method is not widely used due to its high cost and inconvenience in the field (Rambert et al. 1998).
In recent years with the development of digital imaging technology, high-speed cameras have been used to record descent modes of free-falling conifer seeds (Stevenson et al.2015), falling trajectories of maple seeds (Varshney et al.2012), terminal velocity of fern spores and pollen (Loubet et al. 2007; Gomez-Noguez et al. 2017) (Table 1). However,an accurate and convenient method available based on highspeed camera characteristics to measure terminal velocity of wind-borne seeds has not been available.
Plants with wind-borne seeds have developed different morphological adaptations for seed dispersal (Andersen 1993). They produce diversified seeds with different aerodynamic behaviors such as tumbler, floater, undulator, helicopter, rolling autogyro and autogyro (Augspurger 1986). Previous studies have found that the terminal velocity of seeds is largely influenced by morphology and aerodynamic behavior (Matlack 1987; Andersen 1993; Zotz et al. 2016; Tabassum and Bonser 2017). Therefore, an appropriate method is needed for measuring the terminal velocity of seeds with large variations in morphology and aerodynamic behavior.
In this study, based on the dropping method, a camera recording method was developed to determine the terminal velocity of wind dispersed seeds with different aerodynamic traits and aerodynamic behaviors. The objectives were to: (1) assess if the new method eliminates the effect of acceleration on terminal velocity; and, (2) determine advantages of the new method.

Table 2 Aerodynamic behavior and structures of morphology of wind-dispersed seeds
Materials and methods
Seed collection
Wind-borne seeds of 41 species in 11 families, including trees, shrubs and herbs, were collected in Inner Mongolia(101° 07′-120° 55′ E, 42° 05′-50° 27′ N), north China.Seed mass spanned from 0.002 mg (Populus euphratica)to 291.9 mg (Acer nikoense). Seed length varied from 3.1 mm (Metaplexis japonica) to 61.7 mm (Galinsoga parviflora). Five types of appendages (balloon, cotton,wings, hairs and plume) and five types of fruit (achene,utricle, caryopsis, samara, and silicle) represent most wind-borne seed types in this area (Table 3). Twenty intact seeds from natural populations were collected for each species from five individual plants after seed maturity in July and August, 2016. A total of 820 seeds were air- dried and stored.
Aerodynamic type
Based on seed morphology and aerodynamics in still air(Augspurger 1986; Matlack 1987; Stevenson et al. 2015),the species were divided into seven categories (Table 2).
Wing loading of seed
Wing loading is an important indicator for comparing seeds of different weights and sizes (Augspurger 1986;Matlack 1987; Andersen 1993) and was calculated as the ratio of seed mass to projected area (Augspurger 1986;Matlack 1987; Howlett 1995; Greene and Johnson 1997)

where Lwis wing loading (mg cm −2 ), mass the seed weight(mg), and Spthe projected area (cm2).
Twenty intact seeds of each species were randomly selected for measurement. Each heavy seed (> 10 mg) was weighed with an electronic balance (0.1 mg accuracy) to calculate the average seed mass. For light seeds (< 10 mg),100 seeds were weighted to obtain the average for twenty repeats. The projected area was measured according to the shape and falling state of seeds. For example, for achenes with spherical, cylindrical pappus or hairs (in the families Asteraceae, Asclepiadaceae and Gramineae),their projected area was calculated from a vertical direction according to the falling position by the following formula:

where Spis the projected area of pappus (mm 2) and r is the radius of pappus projected area whose value is calculated as a half of average width and height (Burrows 1973).
Seed with complex-shaped wings were scanned with a digital scanner and analyzed using an image analysis system WinSEEDLE (Regent Instruments Inc., Quebec,Canada) (Zhu et al. 2016) to measure their projected area.However, the projected area of Aceraceae is not of a single wing because it falls spinning like an autogyro; the projected area is that of the wing swept (Green 1980), so the wing loading of Aceraceae was calculated as follows:

where Lwis wing loading (mg cm−2), mass the seed weight(mg), Spthe area the wing swept as spinning (cm2), and r is the length of the wing (cm).
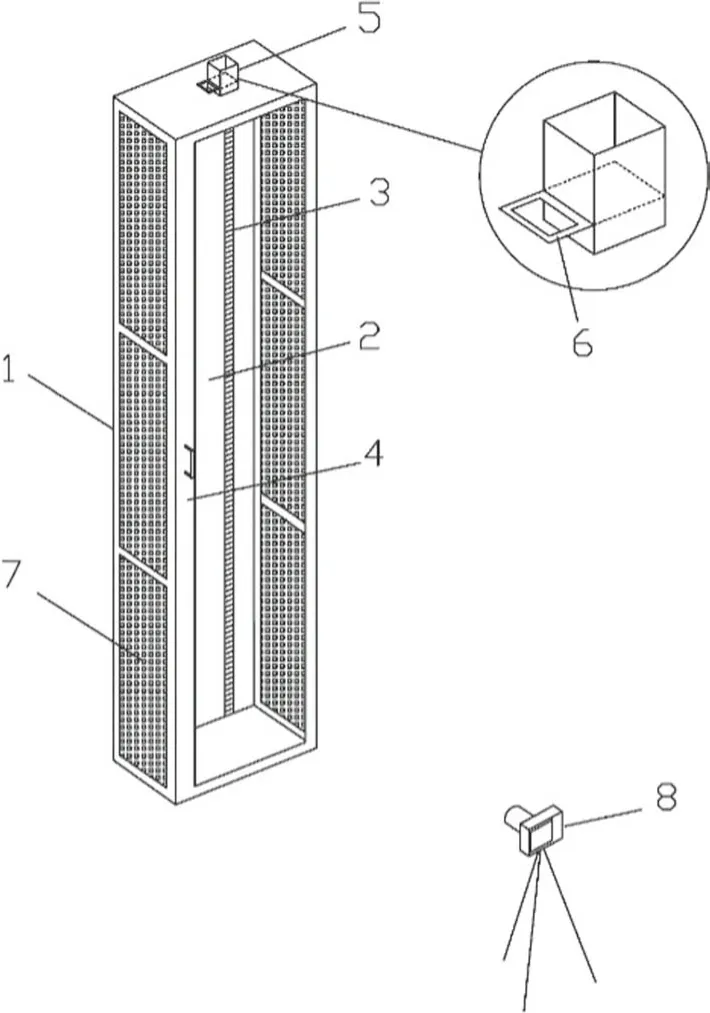
Fig. 1 Apparatus for measuring terminal velocity of seed using the camera recording method; (1) settling tower; (2) background; (3)scale; (4) front door; (5) seed releaser; (6) pull-push plate; (7) light sources; (8) video camera
Apparatus to measure terminal velocity
The apparatus included a settling tower (250 cm high) and a camera (Fig. 1) with a back side a black background. A scale (1-mm accuracy) was pasted on the background for calibrating seed position. Glass shields and LED lights were installed outside the settling tower to increase sharpness of the camera images. A glass door was made in front of the settling tower for recording seed movement and a seed releaser was fixed on the top 250 cm above ground to decrease horizontal and vertical differences in seed falling positions. One seed was put on a pull-push plate in the releaser and when the plate was pulled out, the seed was released. A camera (GC-P100AC, JVC Japan) was placed 200 cm from the backboard to record the seed falling process. The recording speed of the camera was 50 frames per second (fps).
Calibration of observation
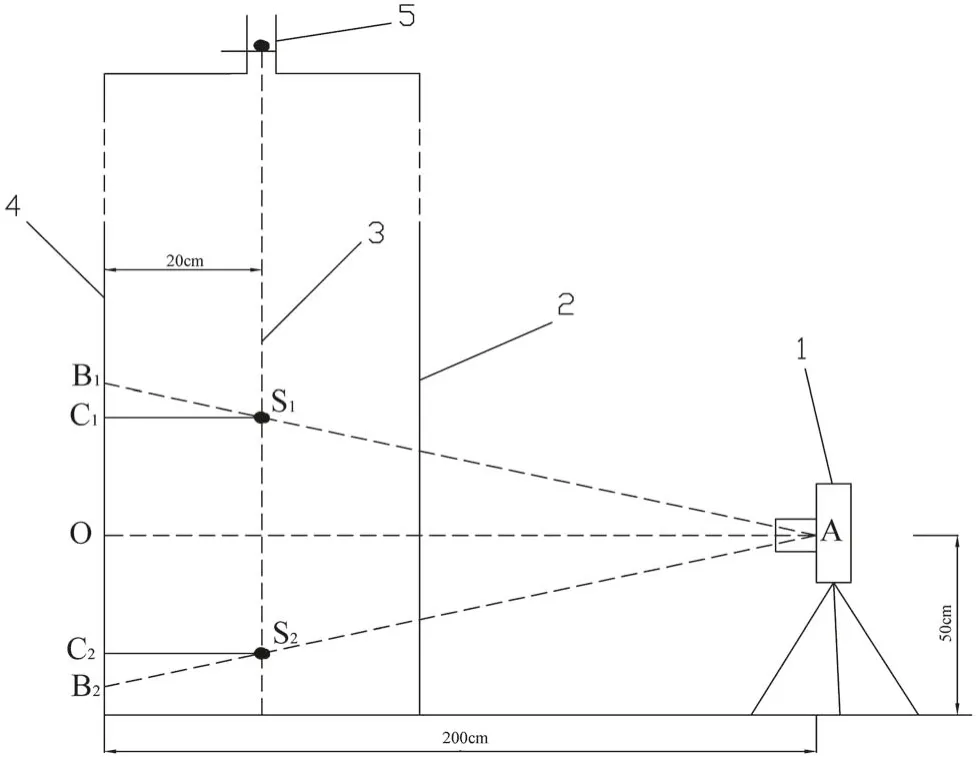
Fig. 2 Relationship between observed position by camera and projected position (actual position) on scale; (1) camera, (2) settling tower, (3) seed falling trajectory, (4) scale, (5) seed releaser, (A) focus of camera, (O) projected point of A on scale, (S1, S2, B1, B2,and C1 ,C2) seed falling positions, observed positions and projected positions when a seed falling above and below the camera, respectively
Because of the angle of view, seed positions observed by the camera in three-dimensional space are not positions of seeds projected against a two-dimensional scale (Fig.2). When a falling seed is above the camera, the observed position is B1.However, the projected position of the seed is C1.Similarly,when the falling seed is below the camera, the observed position and projected position of the seed are B2and C2,respectively. As a result, the observed falling distance B1B2is larger than the actual distance C1C2.If B1B2is used as the falling distance, the actual falling velocity would be overestimated. Therefore, the observed position should be calibrated to decrease the measuring error. In this study, the distance between the focus of the camera and its projected position OA was 200 cm. The distance between the seed and its projected position S1C1or S2C2was 20 cm. The scale value of point O was 200 cm. When a falling seed is above the camera, the projected position is calculated as follows.

When the falling seed is below the camera, the projected position is calculated as follows.

Using the above equations, a calibration table was made for observed and projected positions when a seed is falling above the camera (175-200 cm), and when a seed is falling below the camera (200-225 cm, Table 3).

Table 3 Calibration for observed and projected positions in cm
Measurement of acceleration height and terminal velocity
In general, if a seed is released, it first demonstrates an accelerated motion. During acceleration, air resistance exertedon the seed is less than its gravity, and the velocity of the seed is increasing up to terminal velocity. Acceleration is def ined as the height of a seed as a falling distance before it reaches to its terminal velocity, and acceleration time as the number of frames multiplied by 0.02 s per frame. When the seed reaches terminal velocity, the seed displays a uniform motion. At this point, the drag force from air resistance is equal to its gravity. The release height minus acceleration height is used for measuring the terminal velocity (Fig. 3).

Fig. 3 Motion states of a seed in a release height; there are two motion stages: the accelerated motion (air resistance < gravity) and uniform motion (air resistance = gravity). At the first stage, the seed falls at an accelerated velocity, the velocity < terminal velocity. At the second stage, the seed falls at a uniform velocity, i.e., terminal velocity
Each seed was released from the seed releaser at the top of the settling tower (250 cm). The video camera recorded the falling process of twenty seeds of each species at a speed of 50 fps. The videos were played frame by frame using Quick Time Player (Apple Macintosh, version 7.79.80.95,2016). Observed positions were read from the video and calibrated according to equations above. The falling distance in each frame (1/50 s) was calculated. When falling distances were equal in two consecutive frames, the seed had reached its terminal velocity. The height from this point to the release point is the acceleration height.
When the seed fell at a uniform velocity, the vertical falling distance within 10 frames (0.2 s) was measured by the scale. After calibration, the terminal velocities were calculated as a ratio of the falling distance to time (0.2 s):

where V t is the terminal velocity (m s −1 ), P 1 is the starting position calibrated on the scale, and P 2 is the ending position calibrated on the scale after 10 frames.
Measurement of descent velocity
In order to make a comparison with the dropping method,descent velocity was also measured using the camera recording method. We captured the process of seed falling from the releaser to the ground and recorded the falling time.According to the video, the descent velocity was calculated as follows:

where V t1 is the descent velocity, H is the release height,and t is the falling time (the number of frames multiplied by 0.02 s per frame).
Results
Aerodynamic characteristics
There was a large variation in wing loading (0.02-85.41 mg cm −2 ), acceleration height,(0.14-91.5 cm), acceleration time (0.04-0.46 s), and terminal velocity (0.06-4.07 m s −1) among different seed types (Table 4). According to wing loading, the seeds may be classified into two groups: (1) wing loading is 0.02 to 4.64 mg cm −2 , acceleration height 0.14 to 9.8 cm, acceleration time 0.04-0.2 s and terminal velocity 0.14-1.14 m s −1 with appendages of cotton, pappus, plumes or long hair,and aerodynamic behavior in still air of floater, helicopter and helix; (2) wing loading is 5.82 to 85.4 mg cm −2 ,acceleration height 17.9 and 91.5 cm, acceleration time 0.16-0.46 s, and terminal velocity 0.74-4.07 m s −1 , with appendages of wings, pappus, hairs and bristles, and aerodynamic behavior of helicopter, rolling autogyro, tumbler,autogyro and unclassified (Table 4).
Relationship between wing loading and acceleration height, acceleration time and terminal velocity
Using video analysis, there were three motion stages of Acer ginnala and Acer nikoense: vertical free-fall, rapid rotation and deceleration, and falling with constant speed like an autogyro. Therefore, the two species had greater acceleration heights and acceleration times, but lower terminal velocities. The relationship between wing loading and acceleration height, acceleration time and terminal velocity is significantly different from those of other seeds(p< 0.001, as statistical outliers, Table 4). When the data of the two species were excluded, the regressions of acceleration height (Fig. 4 A, acceleration height = 5.13 [wing loading] 0.47 , R 2 = 0.83, n = 780,p< 0.001), acceleration time (Fig. 4 B, acceleration time = 0.14 [wing loading] 0.15 ,R 2 = 0.70, n = 780,p< 0.001) and terminal velocity(Fig. 4 C, terminal velocity = 0.51[wing loading] 0.46 ,R 2 = 0.88, n = 780,p< 0.001) on wing loading were significant power function.
Comparison of terminal velocity and descent velocity
For most seeds, the difference between terminal velocity and descent velocity (DTD) was positive. However, for Acer ginnala and Acer nikoense, terminal velocities were less than settling velocities (Table 1). Therefore, the DTD of the two species was removed as statistical outliers. Linear regression of DTD (Fig. 5, DTD = − 0.0093 + 0.0164[wing loading], R 2 = 0.85, N = 780,p< 0.001) on wing loading is significant. The positive slope of the regression indicates that the DTD increased with wing loading. When wing loading was 0.02 to 4.64 mg cm −2 , the DTD ranged from 0 to 0.05 m s −1 (0-4.4% of terminal velocity). The descent velocity is approximately equal to the terminal velocity. When wing loading was 5.82 to 85.4 mg cm −2 ,the difference ranged from 0.04 to 1.37 m s −1 (4.4-33.7%of terminal velocity). Therefore, descent velocitiesshould not be regarded as terminal velocities due to large deviations.

Table 4 Morphological and aerodynamic traits of selected seeds (mean ± SD)

Table 4 (continued)
Discussion
Eliminating systemic error
Some previous studies have demonstrated that seeds with low wing loading or porous pappi attain terminal velocity immediately when released, and systematic error caused by acceleration is negligible (Burrows 1973; Andersen 1992).However, this assumption is not valid for seeds with high wing loading or low porosity pappi because the seeds take more time to attain terminal velocity (Table 2). Therefore,systematic errors might lead to the underestimation of terminal velocity for most seeds (the velocity in the acceleration stage < terminal velocity), or overestimation for some winged seeds, i.e., some Acer species, the velocity in the acceleration stage > terminal velocity. The camera recording method can eliminate miscalculations by removing the acceleration height and acceleration time in accelerated motion stage.
Determination of seed release height
Previous studies showed that various release heights from 76 to 1580 cm have been used (Matlack 1987; Andersen 1992;Jongejans and Schippers 1999; Dauer et al. 2006; Zhu et al.2016) to determine approximate terminal velocity by the dropping method. The accuracy of calculating the descent velocity is influenced both by release height and by acceleration height. Our results show that the release height can be estimated based on acceleration height (Table 2, Fig. 3). For seeds with wing loading < 5 mg cm −2 , acceleration heights are less than 10 cm. Thus, a release height of 100-150 cm is sufficient for determining terminal velocity at heights of 90-140 cm. These seeds with appendages of cotton, pappus, plume or long hairs, behave as floaters, helicopters and helixes in still air. For seeds with wing loading > 5 mg cm −2 ,their acceleration height is from 20 to 100 cm. Thus, a release height of 200-50 cm is enough for determining terminal velocity at heights of 100-230 cm using this method.These seeds, with appendage structures of wings or bristles,behave as helicopters, rolling autogyros, tumblers, and autogyros in still air and generally fall in a vertical line.
Accuracy of measurement
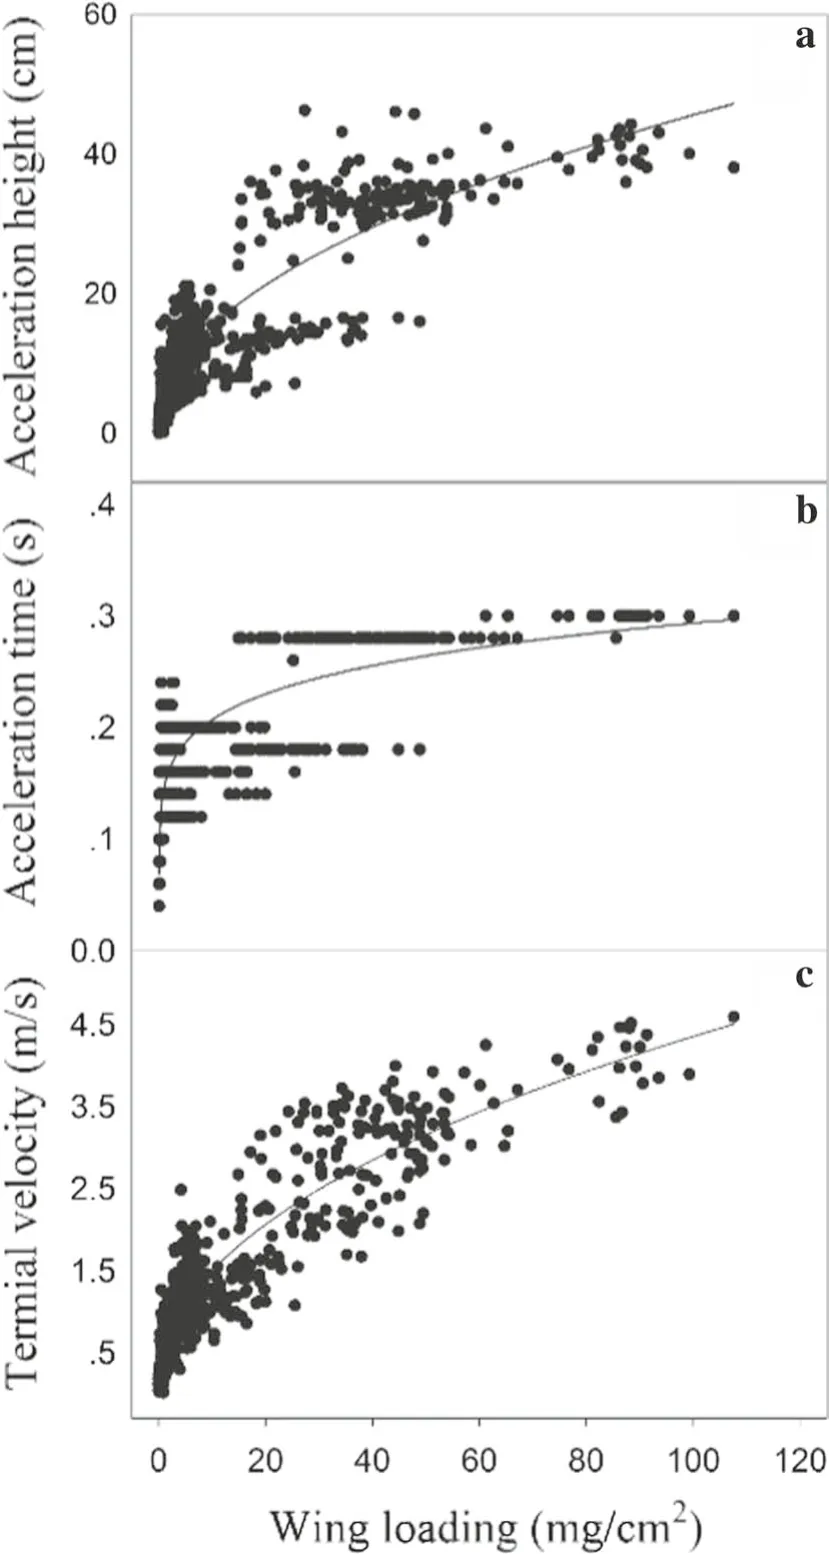
Fig. 4 Relationships between wing loading and acceleration height(a), acceleration time (b) and terminal velocity (c) for all seeds
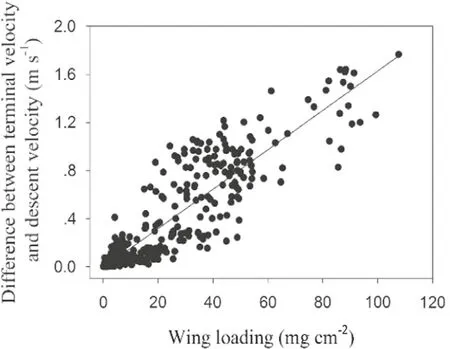
Fig. 5 Relationships between wing loading and difference between terminal velocity and descent velocity
The accuracy of terminal velocity measurement is largely dependent on timing precision. In order to increase the accuracy of terminal velocity measurements, researchers have successively used electric stopwatches (Andersen 1992;Jongejans and Schippers 1999; Zhu et al. 2016), photoelectric beams (Jongejans and Schippers 1999; Sheldon and Lawrence 2010) and laser light to measure falling time. The results of this study show that a time span of 0.02 s at a shooting speed of 50 fps is sufficient for determining acceleration height and terminal velocity for wind borne seeds.For seeds with terminal velocities of 0.06 m s −1 (the lowest in this study, Table 2), the acceleration height may be determined against the scale (mm) because the falling distance is 1.2 mm per frame. In general, the terminal velocity is less than 4.5 m s −1 for most wind-borne seeds (Table 2). If the terminal velocity is 4.5 m s −1 , the greatest falling distance is 9 cm in a frame and the falling distance less than 90 cm within 10 frames (0.1 s). Therefore, a release height of 200 cm (acceleration height < 100 cm) is sufficient for measuring terminal velocities at a shooting speed of 50 fps.Therefore, the accuracy of the method is suitable for measuring terminal velocity of most wind dispersed seeds.
Conclusions
Compared with previous methods, the camera recording method has several advantages. Firstly, the high speed video camera effectively enhances the accuracy and the convenience of measuring seed dispersal. Secondly, the method is suitable for measuring terminal velocity of seeds with different morphologies, different aerodynamic types and motion behaviors by regulating recording speed, lens focus and intensity of LED light. Thirdly, this method is oflow cost and easy to operate. Lastly, installation of the apparatus does not need special professional skills.
AcknowledgementsWe would like to thank Zhigang Wang, Junliang Gao, Fengmei Luo, Batu Gegen, Jingbo Zhang, Lu Hai, Yaru Huang,Cheng Ge, Na Duan and Ruibing Duan for their assistances in seed collection and seed measurements.
杂志排行
Journal of Forestry Research的其它文章
- A commentary review on the use of normalized difference vegetation index (NDVI) in the era of popular remote sensing
- Reconciliation of research on forest carbon sequestration and water conservation
- A theory to link relationships of stand volume, density, mean diameter and height in forestry data
- A new model for predicting the total tree height for stems cut-to-length by harvesters in Pinus radiata plantations
- Comparative performances of new and existing indices of crown asymmetry: an evaluation using tall trees of Eucalyptus pilularis(Smith)
- Tree mortality and biomass loss in drought-affected forests of East Texas, USA
