Epicardial Adipose Tissue in Patients with Obstructive Sleep Apnea:A Systematic Review and Meta-analysis
2020-12-16BinLiuYingruiLiJianlinDuQiangSheandSongbaiDengMDPhD
Bin Liu ,Yingrui Li ,Jianlin Du ,Qiang She and Songbai Deng,MD,PhD
1 Department of Cardiology,The Second Aff iliated Hospital of Chongqing Medical University,Chongqing 400010,China
Abstract
Keywords:Epicardial adipose tissue; epicardial fat; obstructive sleep apnea; apnea syndrome
Introduction
Obstructive sleep apnea (OSA) syndrome is a respiratory disorder characterized by repetitive episodes of upper airway obstruction caused by partial or complete collapse of the upper airway [1].Diagnosis of sleep apnea is established in symptomatic patients experiencing respiratory events [2].A population-based study showed that approximately 3%- 7% of adult men and 2%- 5% of adult women experience symptomatic OSA [3].OSA results in decreased oxygen saturation,fragmented sleep,and daytime sleepiness,which impair quality of life.OSA has become a serious health problem because of its association with sudden death and an increased risk of cardiovascular disease.It has been reported that OSA is associated with arterial hypertension,arrhythmia,coronary heart disease,and stroke [4- 6].In patients with OSA,activation of sympathetic inf lammation,oxidative stress,and metabolism dysfunction are the main reasons for the increased risk of cardiovascular diseases [7].Upper airway anatomical stenosis,functional collapse of the upper airway,obesity,hormonal imbalance,and smoking are the causes of sleep apnea syndrome [8].There is growing evidence showing an association between OSA and epicardial adipose tissue (EAT) [9- 11].
Human EAT,located between the myocardium and the epicardium,covers more than three- quarters of the surface of the human heart and constitutes nearly 20% of the weight of the heart [12].It is a kind of visceral fat and ref lects visceral fat deposition rather than general obesity,so it is considered an active metabolic and secretory tissue [13,14].EAT surrounds the coronary arteries and secretes numerous cytokines,including adipocytokines,interleukins,and chemokines,which could be either protective or harmful depending on the local microenvironment.An increase in EAT may cause secretion of more proinf lammatory factors associated with metabolic syndrome and cardiovascular diseases,such as nonalcoholic fatty liver disease,dyslipidemia,atrial f ibrillation,and coronary artery disease [15].Human EAT can be accurately measured by imaging methods,including computed tomography (CT) and magnetic resonance imaging (MRI) for measuring EAT volume (EAT-v) and echocardiography for measuring EAT thickness(EAT-t).Both EAT-t and EAT-v have been reported to be associated with OSA [9,11,16].
Although several studies have been performed to investigate the relationship between OSA and EAT,the number of patients in each individual study is relatively small.Therefore,studies with large sample sizes are needed to further assess the relationship between EAT and OSA.In this study,we aimed to extend prior work and explore the relationship between EAT and OSA comprehensively by performing a meta-analysis.
Methods
Search Strategy
We followed the protocols specif ied in the Preferred Reporting Items for Systematic Reviews and Meta-analyses (PRISMA) statement to conduct our study.A comprehensive PubMed,EMBASE,Web of Science,Cochrane Library,and Wanfang(http://www.wanfangdata.com.cn/index.html)search for articles assessing the association between EAT and OSA was performed.To retrieve all the relevant literature with regard to this topic,the search was performed with the following expression:[(‘ epicardial adipose tissue’) OR (‘ epicardial fat’)] AND [(‘ sleep apnea’) OR (‘ sleep hypopnea’)OR (‘ apnea syndrome’)].The search was restricted to articles published until May 20,2020.
Eligibility Criteria
Only full-text articles published in journals were considered for this meta-analysis.Observational case-control studies,cross-sectional studies,and cohort studies reporting the association between EAT and OSA were considered eligible.The following criteria were applied:
1.Inclusion of adult participants (> 18 years old).
2.Quantif ication of EAT-t by echocardiography or quantif ication of EAT-v by CT or MRI.
3.Apnea-hypopnea index (AHI; the number of apnea or hypopnea events per hour of sleep) of 5 or greater was one of the criteria for the diagnosis of OSA.
Studies were excluded if they were conducted in special populations:patients with human immunodef iciency virus infection,autoimmune diseases,or carcinoma,and pregnant women.Abstracts,case reports,and studies without enough information on EAT and OSA were excluded.If the same samples were used in multiple publications,the most detailed report and/or the study with the largest sample was included.
Data Extraction and Quality Assessment
Potentially relevant articles were evaluated by two independent reviewers (Bin Liu and Yingrui Li)using a standardized form.Any disagreement was discussed by all authors and subsequently resolved.If the data were presented as diagrams not numbers,Engauge Digitizer was applied for data extraction[17].The methodological quality of all studies was assessed with the Newcastle-Ottawa scale.Data,including the sample size and mean difference ±standard deviation in EAT,were extracted from each study.
Statistical Analysis
We conducted the meta-analysis using STATA version 12.Pooled standardized mean differences(SMDs) with 95% conf idence intervals (CIs) were calculated with a f ixed-effects model or a randomeffects model according to the heterogeneity among the studies.A formula was used when the mean value and standard deviation were needed instead of the median and range [18].TheI2index was used to evaluate heterogeneity among studies.The risk of publication bias was determined by the symmetry of the funnel plot.The signif icance of the pooled SMD was rated by theZtest.All statistical tests were twotailed,and the type 1 error rate was set at 5%.
Results
Characteristics of the Studies Included
This study followed the protocols specif ied in the PRISMA statement.One hundred and fourteen records were found through the search of the PubMed,EMBASE,Web of Science,Cochrane Library,and Wanfang databases of clinical studies,and ten articles met the criteria and were included in the study after further exclusion of studies [9- 11,16,19- 24].The characteristics of the studies included are presented in Table1.Of the studies included,eight studies reported on the relationship between EAT-t and OSA,and two studies described the relationship between EAT-v and OSA.There were 950 participants in total,including 863 participants in whom EAT-t was measured and 87 in whom EAT-v was measured.The Newcastle-Ottawa scale was used to evaluate the article quality; the scores are shown in Table1.A f lowchart of the study selection is shown in Figure1.
Comparison of EAT between all OSA Patients and Controls
We f irst compared EAT-t of OSA patients and controls,and we found that the OSA patients had a signif icantly greater EAT-t (SMD 0.88,95% CI 0.72-1.05,P = 0.000,Figure2A).A sensitivity analysis was performed by our excluding individual studies one at a time,and no single study had an impact on the overall effect,which demonstrated that the analysis was statistically stable.We further assessed the association of EAT-v with OSA,and we found that there was no signif icant difference in EAT-v between the OSA patients and the controls (SMD 2.46,95% CI - 0.36 to 5.29,P = 0.088; Figure2B).
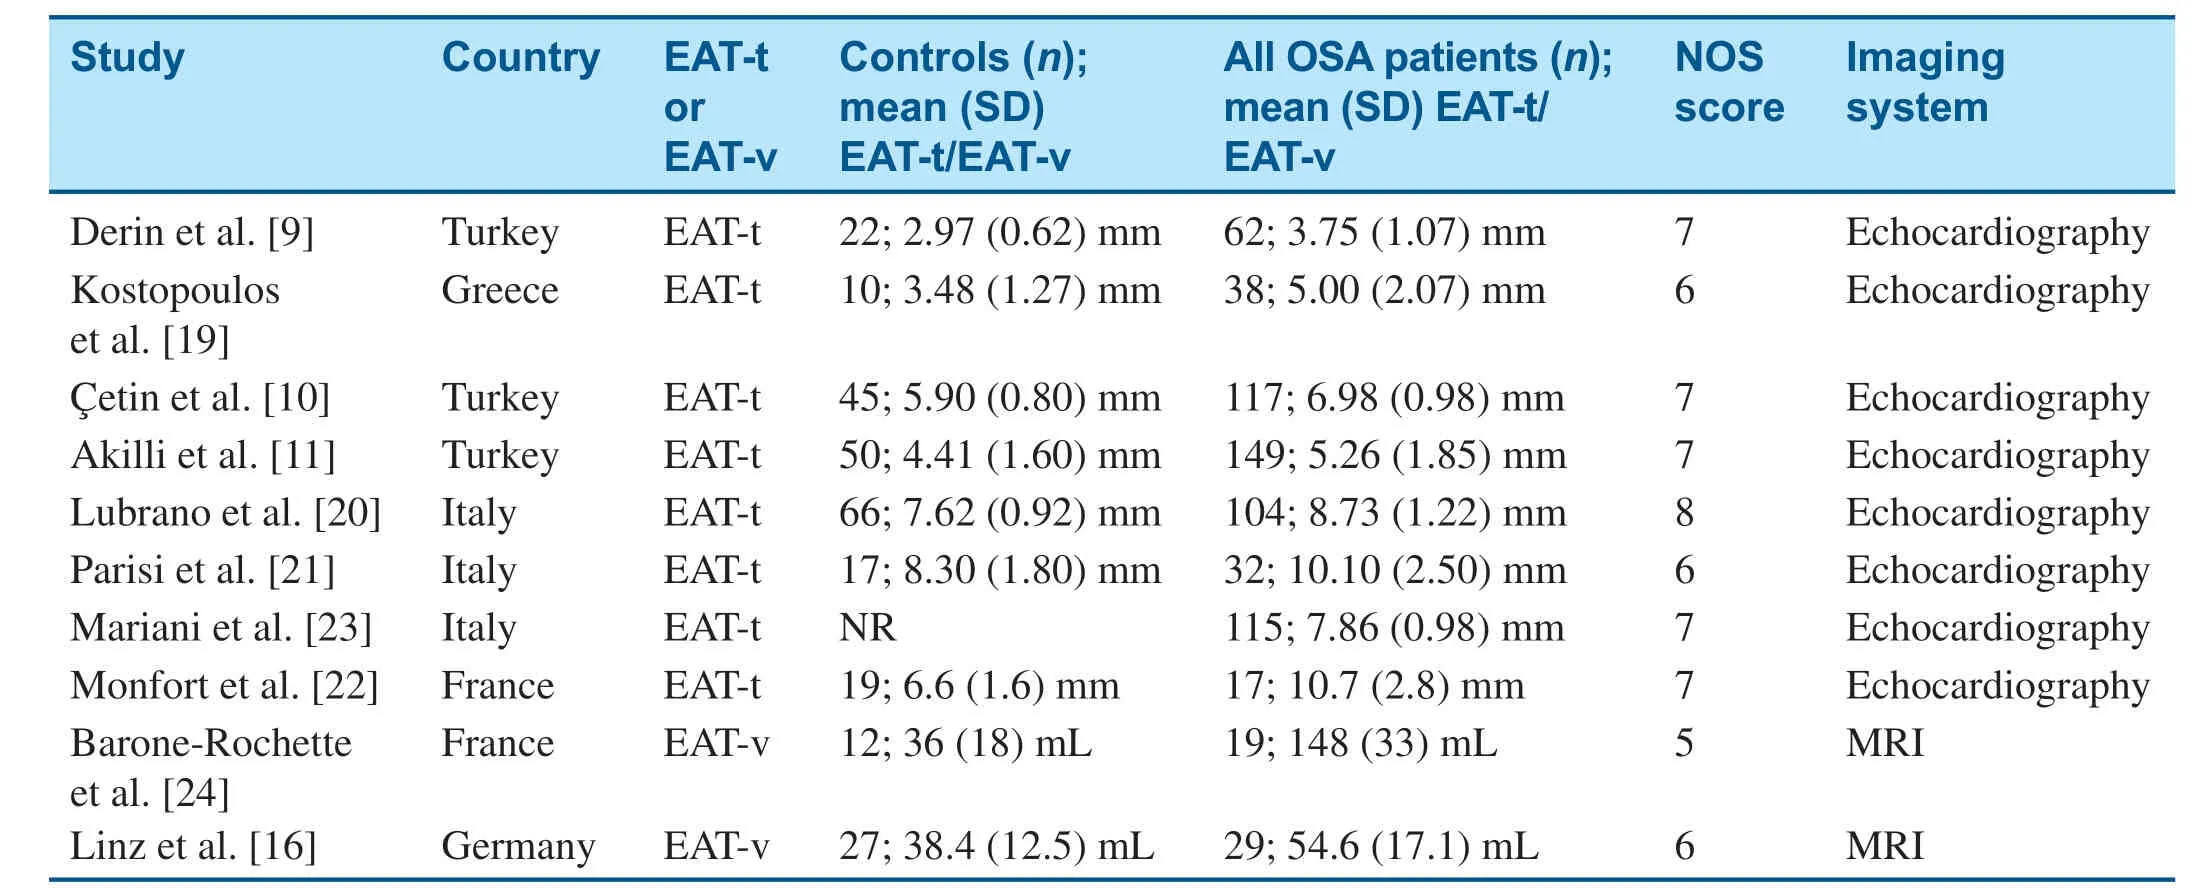
Table1 Characteristics of the Studies Included.
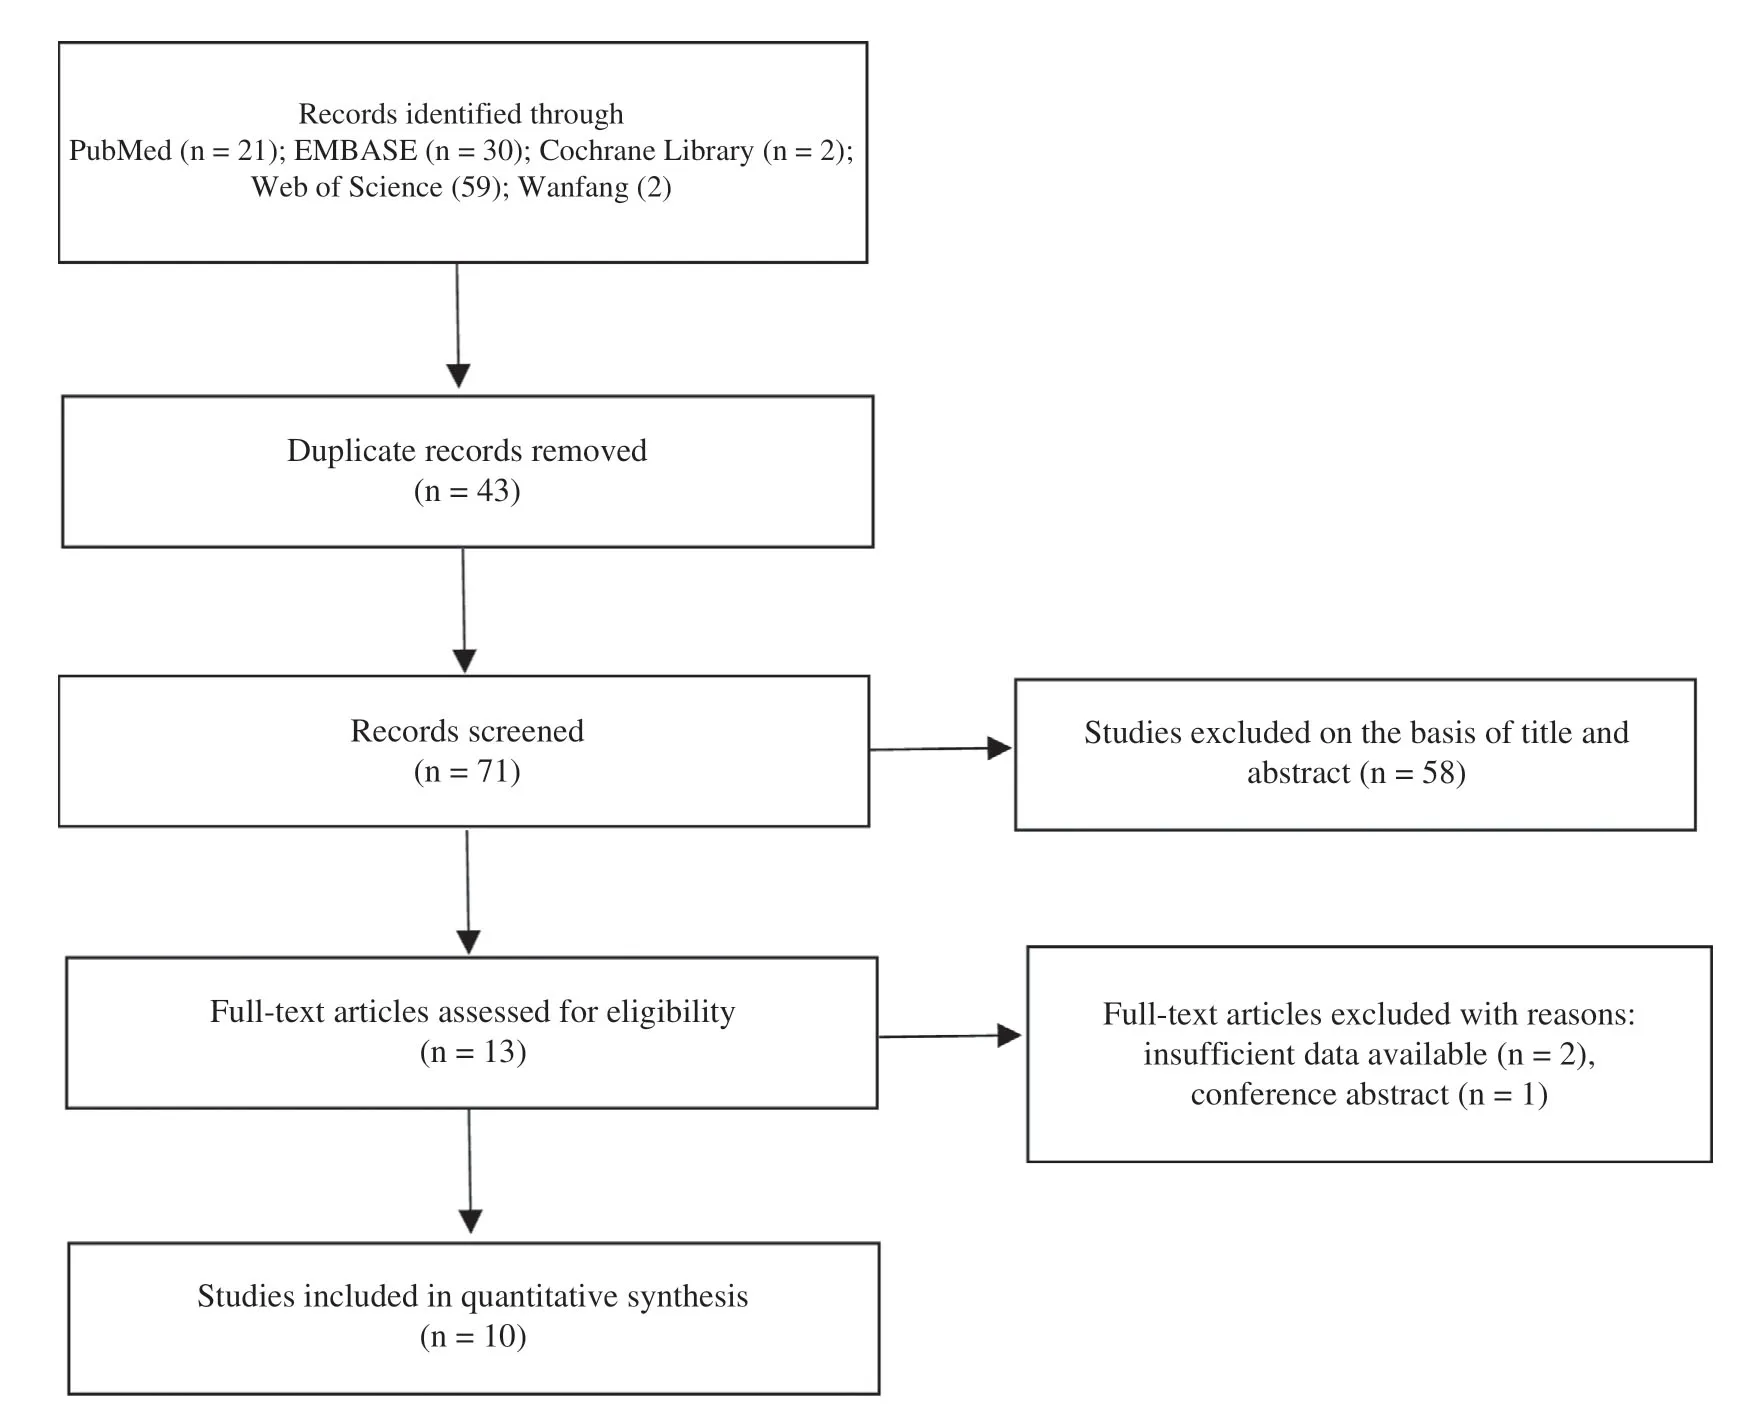
Figure1 Flowchart for Study Selection.
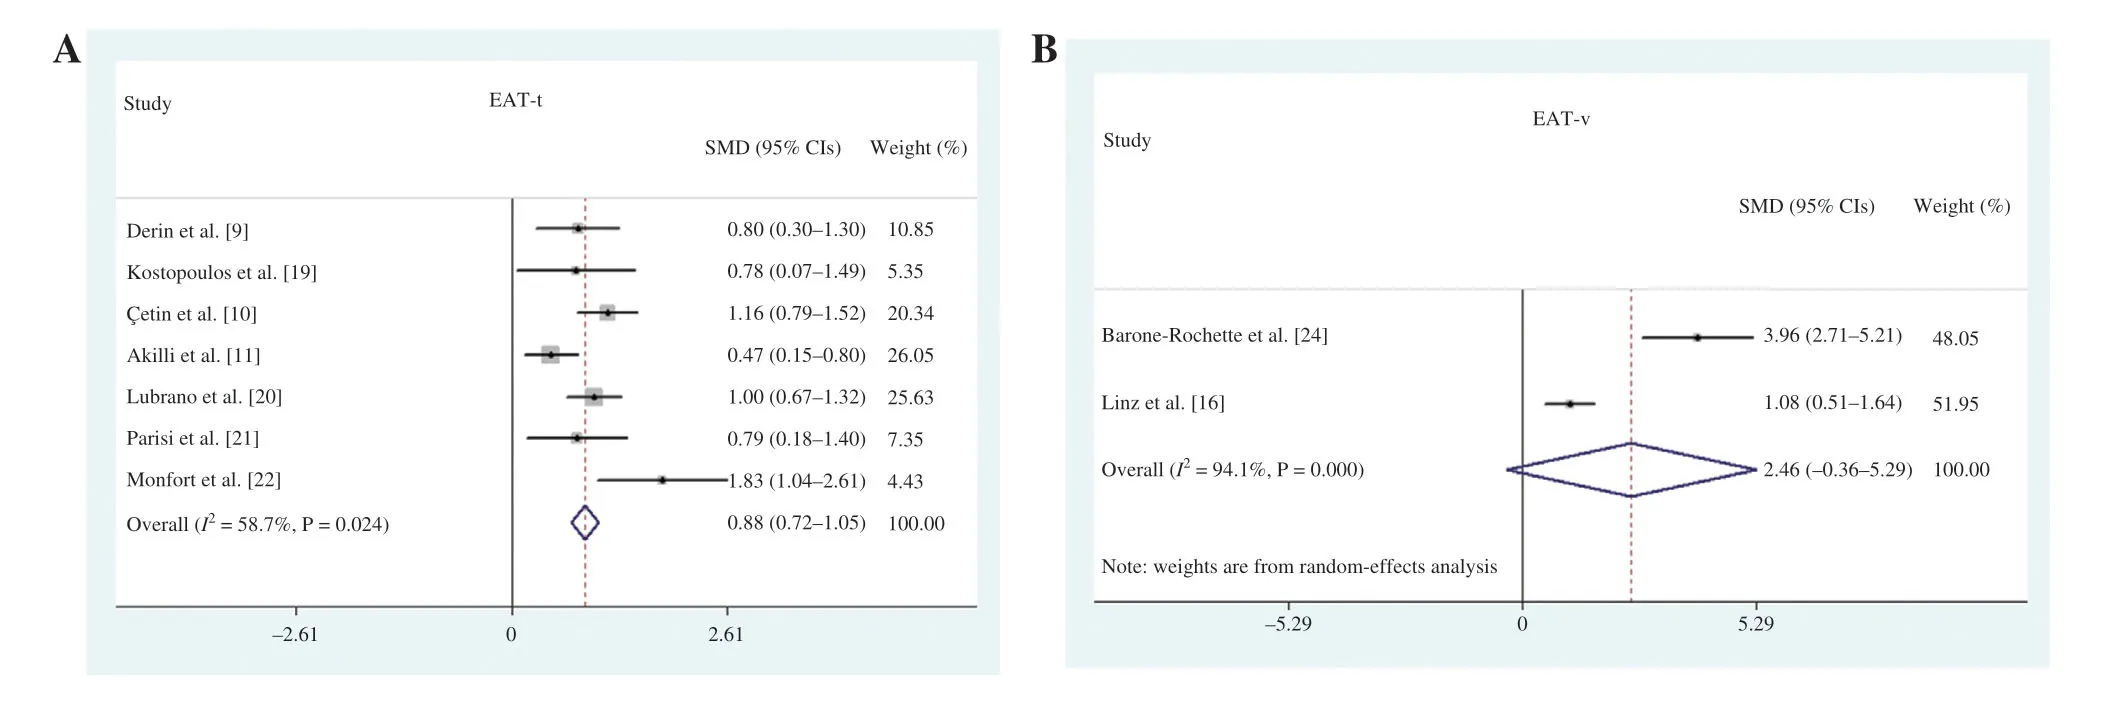
Figure2 (A) Meta-Analysis Comparing Epicardial Adipose Tissue Thickness (EAT-t) between Obstructive Sleep Apnea(OSA) Patients and Controls.(B) Meta-Analysis Comparing Epicardial Adipose Tissue Volume (EAT-v) between OSA Patients and Controls.
Comparison of EAT-t between OSA Patients and Controls with Similar BMIs
It was reported that increases in EAT and the occurrence of OSA were both associated with BMI.We f irst compared EAT-t of OSA patients and controls with signif icantly different BMIs,and we found that EAT-t was increased in the OSA patients compared with the controls (SMD 0.32,95% CI 0.18- 0.47,P = 0.005; Figure3A).Then we compared EAT-t of OSA patients and controls with similar BMIs.We found that the OSA patients also had greater EAT-t than the controls (SMD 1.04,95% CI 0.80-1.28,P = 0.000; Figure3B).

Figure3 (A) Meta-Analysis Comparing Epicardial Adipose Tissue Thickness (EAT-t) between Obstructive Sleep Apnea(OSA) Patients and Controls with Signif icantly Different BMIs.(B) Meta-Analysis Comparing EAT-t between OSA Patients and Controls with Similar BMIs.
Comparison of EAT-t between OAS Subtypes and Controls and among OSA Subtypes
Five studies reporting the subtype of OSA were included,and the OSA group was divided into three subgroups according to the AHI:(1) mild OSA,5 ≤ AHI < 15; (2) moderate OSA,15 ≤ AHI < 30; and(3) severe OSA,AHI ≥ 30.A statistically signif icant difference in EAT-t was observed when we compared patients with mild OSA,moderate OSA,and severe OSA with controls (AHI < 5) (SMD 0.37,95% CI 0.10- 0.63,P = 0.007 for mild OSA; SMD 0.69,95% CI 0.42- 0.97,P = 0.000 for moderate OSA; SMD 0.92,95% CI 0.42- 1.42,P = 0.000 for severe OSA) for mild,moderate and severe OSA,respectively (Figure4A).Additionally,we compared EAT-t of the mild,moderate,and severe OSA subgroups,and we found signif icant differences in EAT-t among the three subgroups (SMD 0.53,95% CI 0.02- 1.03,P = 0.041 for mild OSA; SMD 0.83,95% CI 0.21- 1.46,P = 0.009 for moderate OSA; SMD 0.33,95% CI 0.03- 0.63,P = 0.031 for severe OSA; Figure4B).
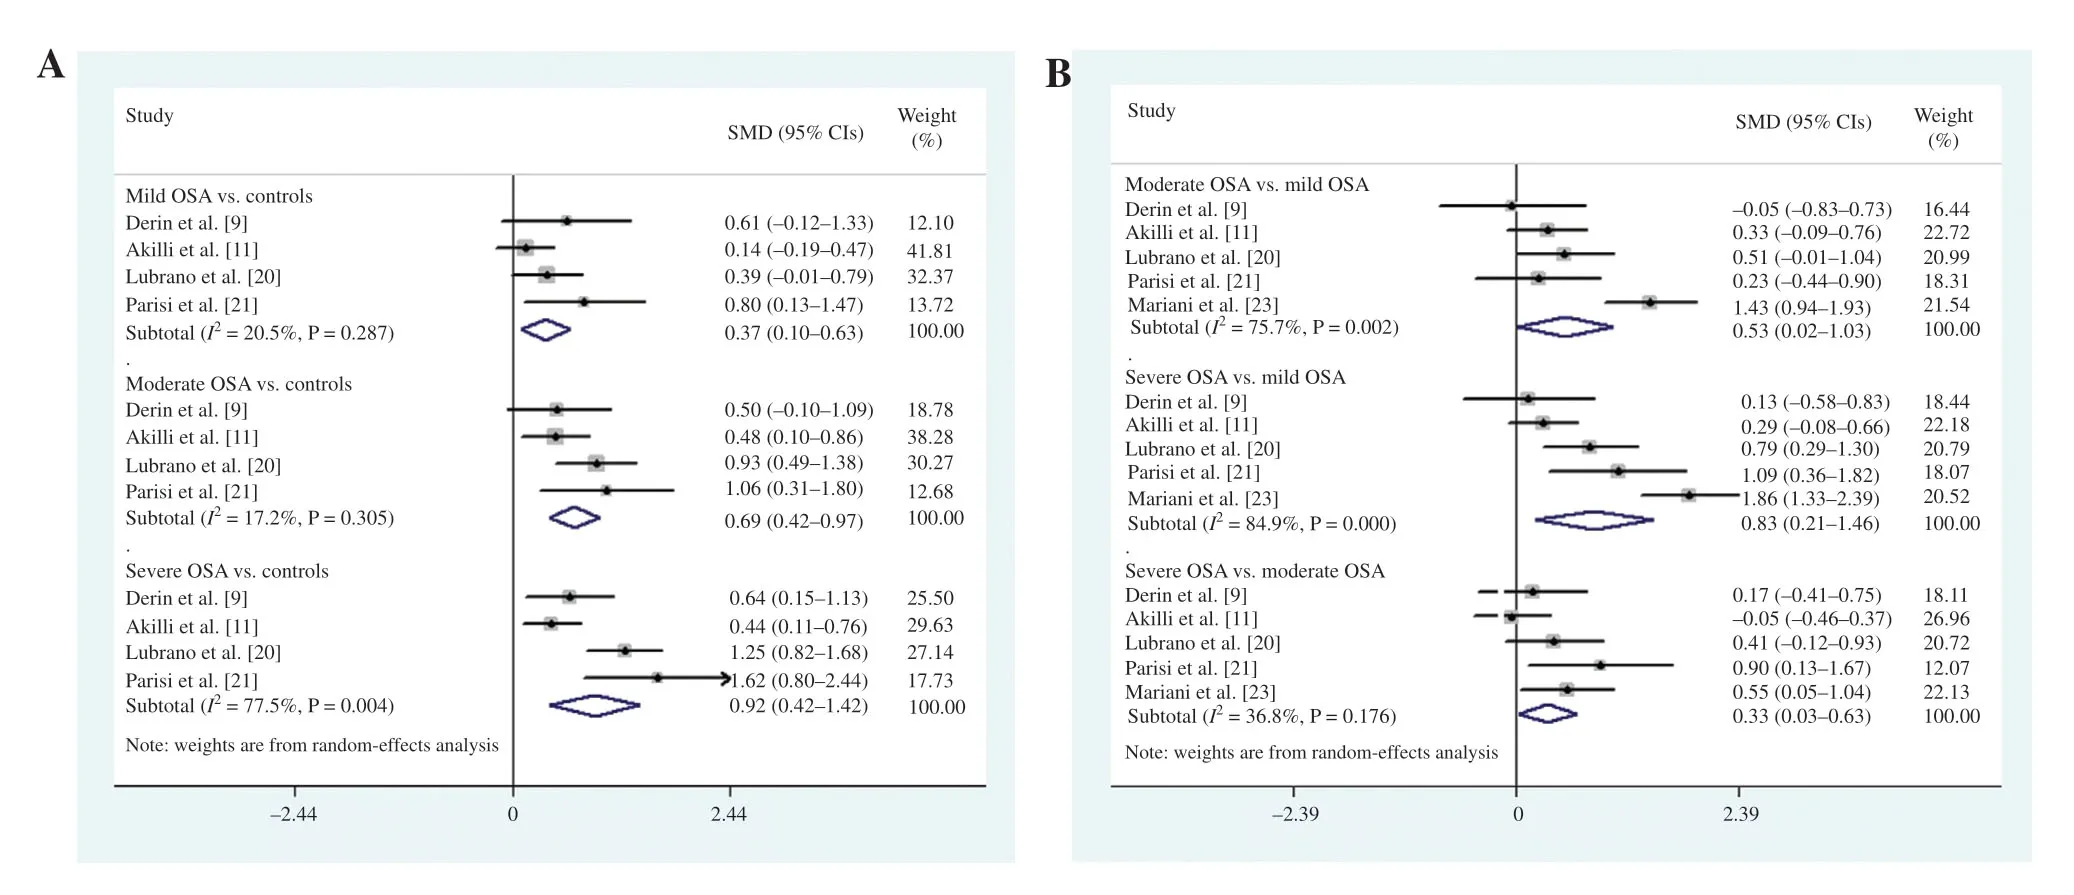
Figure4 (A) Meta-Analysis Comparing Epicardial Adipose Tissue Thickness (EAT-t) in the Mild,Moderate,and Severe Obstructive Sleep Apnea (OSA) Subgroups with that in the Controls.(B) Meta-analysis Comparing EAT-t among the Mild,Moderate,and Severe OSA Subgroups.
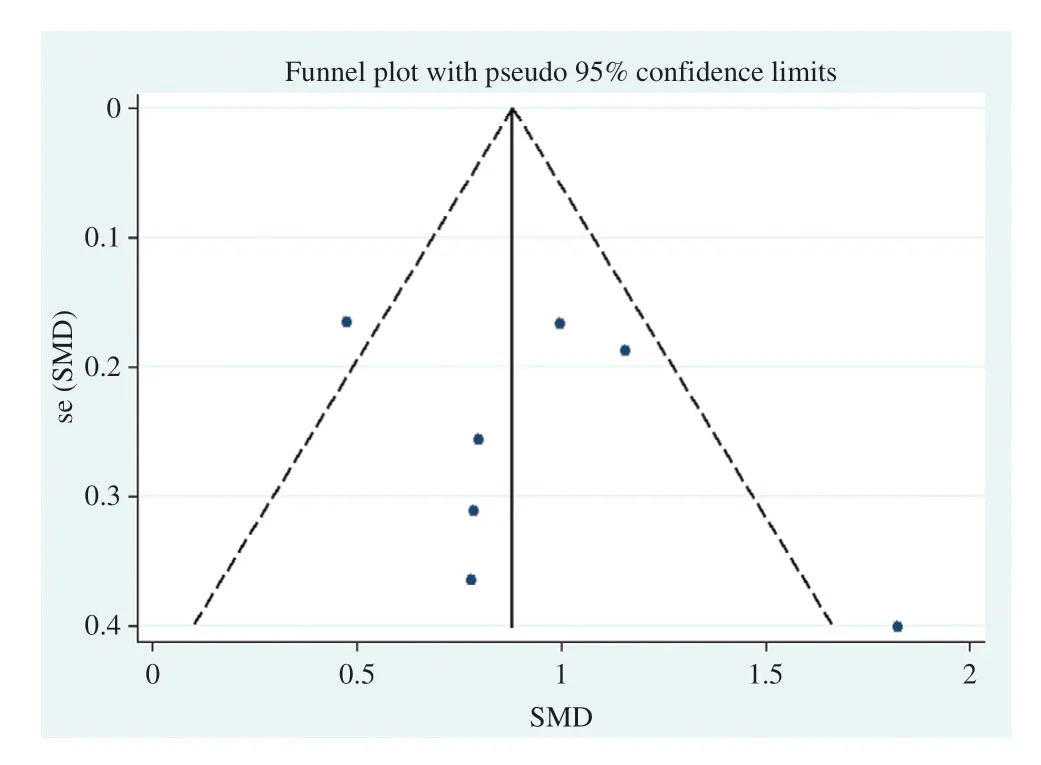
Figure5 Funnel Plot of Studies Included in the Bias Analysis for the Relationship between Epicardial Adipose Tissue Thickness and Obstructive Sleep Apnea.
Publication Bias Assessment
Publication bias in the studies included may affect the results of the meta-analysis.Therefore,we assessed potential publication bias for EAT-t among the studies included with the symmetry of funnel plots.The results showed no obvious bias on visual inspection(Figure 5).We did not assess the publication bias for EAT-v because of the limited number of studies.
Discussion
This meta-analysis demonstrated that OSA patients had greater EAT-t than controls.Furthermore,we also found signif icant differences in EAT-t between OSA patients and controls with similar BMIs.However,we did not f ind a difference in EAT-v between OSA patients and controls.All the subgroups of OSA patients had greater EAT-t than the controls.In addition,there were signif icant differences in EAT-t among the OSA subgroups,which indicated that EAT-t was associated with the severity of OSA.
OSA is the most common respiratory tract disease in clinical practice; the prevalence ranges from 2%to 4% in adults [9].Recurrent episodes of nocturnal hypoxia and hypercapnia caused by OSA lead to complications such as hypertension,coronary heart disease,heart failure,stroke,and even sudden death [25,26].Management of OSA is diff icult and requires a multidisciplinary approach,and the result is not satisfactory.There is growing evidence showing that an increase in EAT is associated with the occurrence of OSA.Derin et al.[9] found that EAT was signif icantly thicker in nonobese OSA patients than in controls and that EAT-t showed a positive correlation with the hypopnea index and oxygen desaturation index.Lubrano et al.[20] reported that EAT was a good predictor of OSA,and this relation was maintained after adjustment for clinical and metabolic risk factors,including age,sex,BMI,left ventricular mass index,and carotid intima thickness.
EAT can secrete numerous inf lammatory markers,including tumor necrosis factor,interleukin-6,and C-reactive protein,the levels of which were found to be increased in OSA patients [27].In this metaanalysis,we found that OSA patients had greater EAT-t than controls.The increase in EAT might promote the incidence and progression of OSA by secretion of proinf lammatory cytokines.However,a strong correlation between EAT and the upper body fat deposition index was found in the study by Aitken-Buck et al.[28].The EAT increase may mirror more ectopic fat deposition in the upper airway,which leads to disordered breathing but does not affect OSA by secretion of proinf lammatory cytokines.Severe OSA patients might have more ectopic fat deposition underneath the epicardium and in the upper airway.Therefore,we compared EAT-t of OSA patients and controls with similar BMIs,and we found that EAT-t in OSA patients was also greater than that in the controls.The studies also showed a correlation between OSA and EAT-t in obesity and nonobesity [9,23].Our study further demonstrated that EAT is a risk factor for OSA,independently of BMI.EAT may be involved in the pathogenesis of OSA by secreting proinf lammatory factors,and EAT may become a potential intervention target for OSA treatment.
There are controversies about the association of EAT-t with the severity of OSA [10,11,20,21].Derin et al.[9] and Akilli et al.[11] did not f ind signif icant differences in EAT-t among mild,moderate,and severe OSA patients.However,several studies indicated that EAT-t is associated with the severity of OSA [20,21,23].Mariani et al.[23] found that EAT-t,right ventricular end-diastolic diameter,carotid intima-media thickness,and trunk/leg fat mass ratio were positively correlated with OSA severity,but EAT-t was the most signif icant independent correlate of the severity of OSA.We investigated the association of EAT-t with the severity of OSA and found that there were signif icant differences among the mild,moderate,and severe OSA subgroups.In general,EAT-t correlates with OSA severity better than the classic indices of obesity,and EAT-t and AHI also maintain a strong correlation after adjustment for other variables [23].Increases in EAT might promote the progression of OSA by increasing the secretion of proinf lammatory cytokines.EAT-t can be accurately measured with noninvasive methods,including echocardiography,CT,and MRI,which are widely used and easily accepted.EAT-t may act as a new marker for assessing the severity of OSA.
Study Strengths and Limitations
To our knowledge,there are only a few studies exploring the relationship between EAT and OSA,and no multicenter or large sample size study has been published investigating the role of EAT in OSA.Therefore,it was necessary to perform a meta-analysis to investigate the relationship.Our work has several advantages.First,we analyzed the association of EAT-t and EAT-v with OSA by a meta-analysis and conf irmed that OSA patients have a greater EAT-t.Second,we found that EAT-t is associated with the severity of OSA.Third,we analyzed the association between EAT and OSA while considering BMI.However,this study also has possible limitations.First,the two studies included in the EAT-v analysis had small sample sizes.Second,there is high heterogeneity for EAT-v between the two trials,which may be caused by differences in BMI.
Conclusion
This meta-analysis showed that EAT-t is increased in patients with OSA compared with controls.EAT-t is associated with the severity of OSA.These f indings may provide a new clue for the pathogenesis and treatment of OSA.
Author Contributions
SD,QS,and BL conceived and designed the experiments.BL and YL collected data.BL,YL,SD,and JD analyzed the data.BL and SD wrote the article.
Funding
This work was supported by grants from the National Natural Science Foundation of China (81770251),the National Natural Science Foundation of China Youth Science Fund Project (81800254),the Social Undertakings and People’ s Livelihood Protection Technology Innovation of Chongqing Science Commission (cstc2017shmsA130086),and Chongqing City Yuzhong District Science and Technology Basic and Advanced Research Projects(20170107).
Conf ilct of Interest
The authors declare that they have no conf licts of interest.
杂志排行
Cardiovascular Innovations and Applications的其它文章
- Comparison of Clinical Value between Right Distal Radial Artery Access and Right Radial Artery Access in Patients Undergoing Coronary Angiography or Percutaneous Coronary Intervention
- Comparison of Segmentation Algorithms for Detecting Myocardial Infarction Using Late Gadolinium Enhancement Magnetic Resonance Imaging
- Current Management Strategies in Patients with Heart Failure and Atrial Fibrillation:A Review of the Literature
- In-Stent Thrombosis after Antiplatelet Therapy Conversion while Awaiting Coronary Bypass
- lmpact of MitraClip Program on the Volume and Outcomes of Mitral Valve Surgery:A Single-Center Retrospective Study
- Clinical Analysis of Transcatheter Embolotherapy for Congenital Pulmonary Arteriovenous Fistulas in Children
