Effect of Salinity on the Zooplankton Community in the Pearl River Estuary
2020-11-30YUANDanniCHENLiangdongLUANLeileiWANGQingandYANGYufeng
YUAN Danni, CHEN Liangdong, LUAN Leilei, WANG Qing, 3), *,and YANG Yufeng, 3), *
Effect of Salinity on the Zooplankton Community in the Pearl River Estuary
YUAN Danni1), 2), CHEN Liangdong1), LUAN Leilei1), WANG Qing1), 3), *,and YANG Yufeng1), 3), *
1),,,510632,2),,,430072,3)(),519000,
Understanding the relationship between the zooplankton distribution and salinity may provide key information to understand ecosystem function under the condition of a global mean sea level rise caused by global climate change.However, little is known about how increasing salinity level will affect the entire zooplankton community on a large scale. Here we completed 1 year of field investigations on the Pearl River Estuary and analyzed the distribution and structure of the zooplankton community. A total of 68 zooplankton species were identified during the survey. The number and diversity (richness, evenness, Shannon index, and Simp- son’s index) of the zooplankton species decreased as salinity increased from 0.10 to 21.26. Salinity negatively affected the abun- dances of rotifers, cladocerans, and total zooplankton,while it had little effect on copepod abundance. Some salt-tolerant species, such as,, and,survived at high-salinity sites. A pattern was observed at all sites: the peak in copepod abundance always occurred when rotifers were abundant (sites S1 and S2) or after rotifer abundance reached a maximumlevel (sites S3, S4, and S5). In general, salinity was the most important environmental factor shaping zooplankton biodiversity and abundance. This study provides insight into potential biodiversity and structure of the zooplankton community in response to salinity change.
estuary; zooplankton; species diversity; salinity
1 Introduction
The Pearl River Estuary is a unique highly diverse environment in the subtropical region, with a rainy season from April to September, when runoff accounts for 78% of the precipitation of the entire year.The dry season is from October to March, and runoff accounts for approximately 22% of the total for the year. The lowest flow often occurs from December to February, mostly in January (Wang., 2009). The Pearl River Estuary is a huge sub- tropical and permanently open estuary characterized by a horizontal gradient in salinity and temperature caused by high freshwater influx (Li., 2006).
The Pearl River flows through Guangzhou city, and sa- linity increases gradually from the Guangzhou city segment to the estuary. The salinity in the Guangzhou segment of the Pearl River is <2 (Wang., 2009), which can be distinguished from freshwater (Jeppesen., 1994). The water quality in the Guangzhou segment of the Pearl River is influenced by an influx of urban and industrial wastes. Salinity in the Pearl River Estuary varies greatly from 0.10 to 25.0 (Li., 2006). The salinity gradient experienced from the Guangzhou city segment to the estuary plays an important role in the change in zooplankton community structure. Zooplanktons play important roles in aquatic food webs by fluxing energy from primary produ- cers to subsequent trophic levels in the food chain (Bă- naru and Harmelinvivien, 2018). Species diversity and the zooplankton community are very sensitive to the changes in the aquatic environmental conditions (Chai., 2018). The relationship between salinity and zooplankton may provide key information on ecosystem function and biodiversity.
Organisms in the estuary are at increased risk for the predicted effects of global climate change, as global mean sea level might rise from 0.09 to 0.88m by 2100 (IPCC, 2001), which will salinize much of the freshwater in the coastal aquatic ecosystem and will inevitably affect the biological composition of the river. Because freshwater organisms generally cannot survive in saltwater (Conde- porcuna, 2018), the species richness of freshwater orga- nisms is expected to decrease as a result of an increase in salinity. Exposing organisms to natural stresses have received increased attention in risk assessment studies (Gar- reta-Lara., 2018). Previous studies on the effects of salinity change on zooplankton have been conducted in the laboratory. For example, Fielder. (2000) examined the availability of the euryhaline rotifersandwith decreasing salinity and found initial transfer shock in both species. Boronat. (2001) suggested that cladoceran species can tolerate an extensive salinity range from fresh water to sea water, withbeing stenohaline (0.5– 1.2gL−1) andbeing euryhaline (3.8–38gL−1). Holste and Peck (2006) examined the effects of salinity (0–34) on the reproductive success of the copepodand found that the hatching rate ofeggs was the lowest (11.4%) at salinity 0.It increased asymptotically as salinity increased, and was reached the highest (84.5%) at 25. Thus, changes in salinity have great effects on rotifers, cladocerans, and copepods. However, little information is available about the effects of increasing salinity levels on the entire zooplankton community from a taxonomic perspective. Therefore, it is important to study the effects of varying salinity on organisms at a large scale. The area ranging from the Guangzhou city segment of the Pearl River to the estuary provides a large scale study area to evaluate the impact of salinity change on biological survival probability and biodiversity.
In this research, we tested the hypothesis that the increase of salinity from the Guangzhou city segment to the estuary of the Pearl River results in severe reductions in biodiversity and abundance of zooplankton. The effects of the salinity gradient on the zooplankton community struc- ture was studied to provide basic data for aquatic biodiversity conservation and environmental studies in the Pearl River Estuary, and to make some relevant conclusions re- garding the ecological system structure and function of the Pearl River Estuary.
2 Materials and Methods
2.1 Sampling Sites
The Pearl River is the largest river in Southern China and the second largest river in China in terms of water discharge. It delivers 350km3of freshwater (11100m3s−1) annually to the South China Sea. The river is 2214km long and drains a catchment area of 452000km2. The average annual temperature is 14–22℃ (Yin., 2000). A total of 60 samples were collected from five stations at the Zhangda site (S1), Yuzhu site (S2), Nineteen-yong site (S3), Humen site (S4), and Xiangzhou site (S5) between January and December 2013 (Fig.1). Salinity at each site is shown in Table 1.
2.2 Sample Collection and Environmental Variables
Samples were collected at the five sites once per month. Three replicate samples were taken from each site. Tem- perature and salinity were measured onsite with a YSI Professional Plus Multiparameter Instrument (YSI Inc., Yellow Springs, OH, USA). Surface water was collected in a 5L water sampler and filtered through 0.45μm Millipore filters to analyze chlorophyll-(Chl-), which was extracted with 90% aqueous acetone and measured fluo- rometrically (Chai., 2018). Concentrations of total nitrogen (TN) and total phosphorous (TP) were determined by method of alkaline potassium persulfate digestion and the molybdate blue method with potassium persulfate digestion, respectively, following standard protocols (SEPAC, 1996). Rotifers were collected by filtering 5L of surface water through a 20μm-mesh zooplankton net, while copepods and cladocerans were collected by filtering 20L of surface water through a 64μm-mesh zooplankton net,and the zooplankton were preserved in 4% buffered formalin.
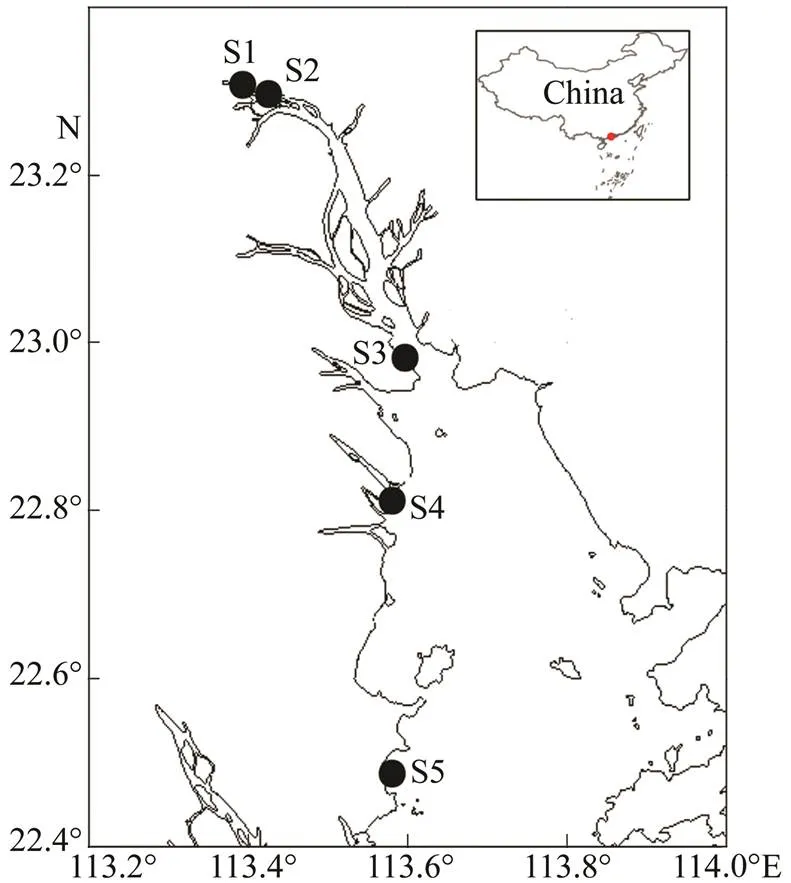
Fig.1 Sampling sites in the Guangzhou segment and estuary of the Pearl River from January to December in 2013.

Table 1 Salinity at the sampling sites
2.3 Identification and Abundance of Zooplankton
A minimum of 200 individuals from each sample were counted with a plankton-counting chamber (1000μL and 5000μL chambers for rotifers and crustaceans, respectively) (CC-F, China). Zooplanktons were identified to the species level when possible or to the genus level. The taxonomic identification of the rotifers was followed Koste (1978) and Wang (1961), while that of copepods and cla- docerans was followed Sheng (1979) and Jiang and Du (1979). We used a fluorescence microscope (BX-51, OLYMPUS, Tokyo, Japan) to identify the plankton in the samples. Zooplankton abundance was expressed as the number of individuals per liter (indL−1).
2.4 Statistical Analysis
Dominant species were defined by the dominance index, which was calculated using the following formula:
,
whereis the dominance index for each species,nre- presents the abundance of the species,is the abundance of all species, andfis the occurrence frequency of thespecies. According to Xu. (2017), if≥0.02, the spe- cies is dominant in the community.
The Shannon-Wiener diversity indexwas calculated using the following equation:
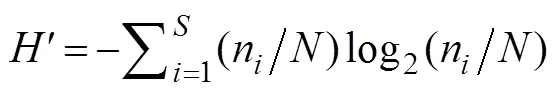
wherenis the abundance of one species, andrepresents the zooplankton abundance in the sample.
Origin 8.5 software (Originlab Corp., North Hampton, MA, USA) was used to evaluate the dynamics of the zooplankton communities at the five sites annually and to illustrate the relationships between salinity and zooplank- ton abundance,while zooplankton abundance data were log(+1) transformed. The significance of the differences among the mean values of richness, evenness, the Shan-non index, and Simpson’s index was determined by one- way analysis of variance (ANOVA) at the 95% confidence level using SPSS 18.0 software (SPSS Inc., Chicago, IL, USA). To illustrate the relationship between the zooplankton community and environmental factors, a re- dundancy analysis (RDA, linear ordination) was perform- ed with CANOCO version 5.0 (Biometrics Wageningen, the Netherlands) (Šmilauer and Lepš, 2013). Data from four groups of zooplankton (rotifer, cladoceran, copepod, and total zooplankton abundance) and seven environmen- tal factors of the 60 samples collected from the five sites (12 samples from each site) were analyzed for the RDA analysis.
3 Results
3.1 Environmental Factors
The mean water temperature (23.27–24.19℃) values were compared among the five sampling sites (Table 2). The highest mean salinity value was observed at S5 (11.59), and the lowest value was observed at S1 (0.19) (Table 2).However, the concentrations of Chl-, TN, and TP at S1 and S2 were significantly higher than those at the other three sites (Table 2).

Table 2 Physicochemical factors at the five sites located in the Guangzhou segment and estuary of the Pearl River
3.2 Species Composition of Zooplankton
A total of 68 zooplankton species were identified, including Rotifera (49 species), Cladocera (7 species), and Copepoda (12 species) (Table 3). Only six species (8.82%) were unique to one site, and more than 45% of the species were common in all of the sites. Most species belonged to the genera,, and. More species of rotifers and cladocerans were detected at sites S1 (43 and 7 species, respectively) and S2 (44 and 7 species, respectively) in the Guangzhou city segment of the Pearl River than at the other sites (28 and 3 species for S3, 27 and 5 species for S4, 25 and 0 species for S5) (Table 3). The number of copepod species was similar among the five sampling sites, while the species composition of copepods differed, such as only two species ofandwere found at sites S1 and S2 in freshwater, and only three species of,,andwere found at hyposaline sites S3, S4, and meso- hypersaline site S5 (Table 3).
Some differences in species composition were detected among the five sites. The community composition of the zooplankton at the five sampling sites was characterized by different species (Table 4). In general, salt-tolerant spe- cies were located in the estuary, whereas some oligohaline species existed in the Guangzhou city segment of the Pearl River. In contrast, the number of zooplankton species in the Guangzhou segment (58 and 59 species at S1 and S2, respectively) was higher than that at the other sampling sites (39, 39, and 25 species at S3, S4, and S5, respectively) (Table 3), with species richness ranging from 2.29 to 4.83 and 2.59 to 5.08 at S1 and S2, respectively, an evenness of 0.67–0.82 (S1) and 0.65–0.79 (S2), Shannon index values of 2.82–3.74 (S1) and 3.01–3.85 (S2) and Simpson’s index values of 0.78–0.91 (S1) and 0.82–0.90 (S2) were higher than those at the other three sampling sites (Fig.2). Among the five sites, the alpha-diversity es- timator values at S5 were the lowest, whereas no significant difference was observed between S3 and S4 (Fig.2).

Table 3 Species composition of zooplankton in the Guangzhou segment and estuary of the Pearl River
()
()

GenusSpeciesS1S2S3S4S5 RotiferEpiphanesEpiphanes macrourus+++++ ColurellidaeColurellidae adriatica++−−− Colurellidae uncinata++−−− LiliferotrochaLiliferotrocha subtilis++++− CephalodellaCephalodella sterea++−−− CollothecaCollotheca sp.++−−− PhilodinaPhilodina sp.+−+−− SynchaetaSynchaeta sp.−−−++ ConochilusConochilus hippocrepis−++−− Total5859393925
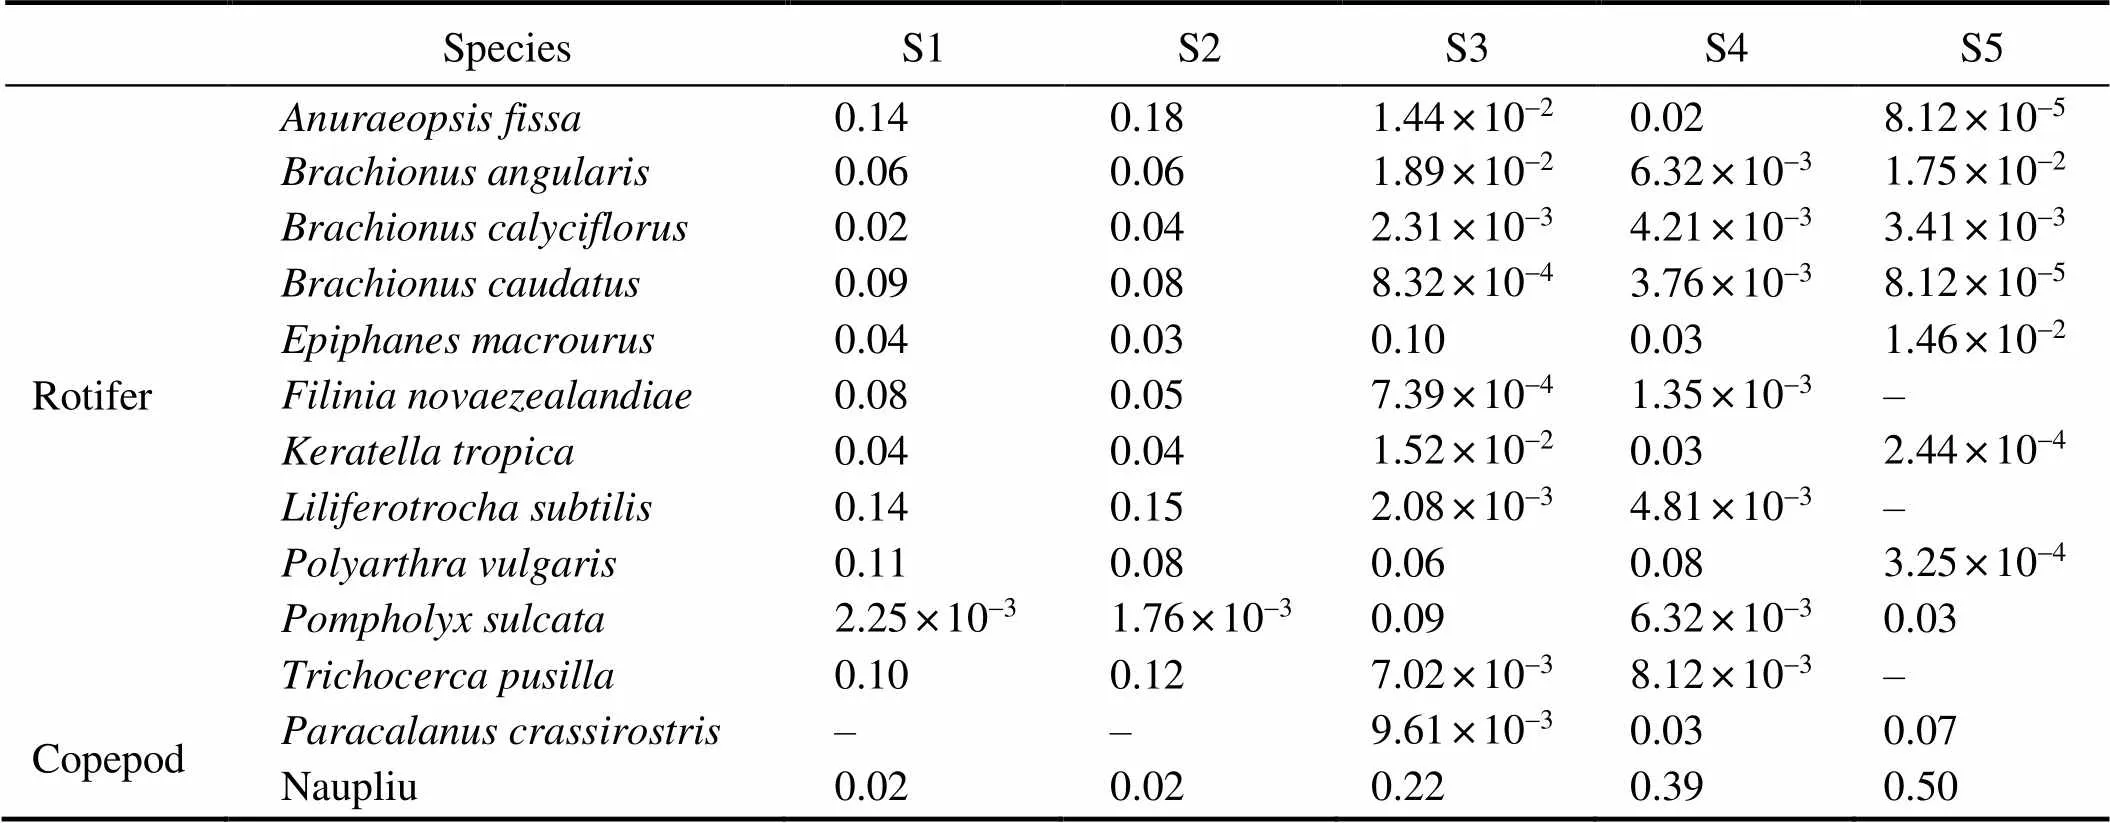
Table 4 Dominance index of the dominant zooplankton species at the sampling sites
Note: ‘–’ species not found at this sampling site.
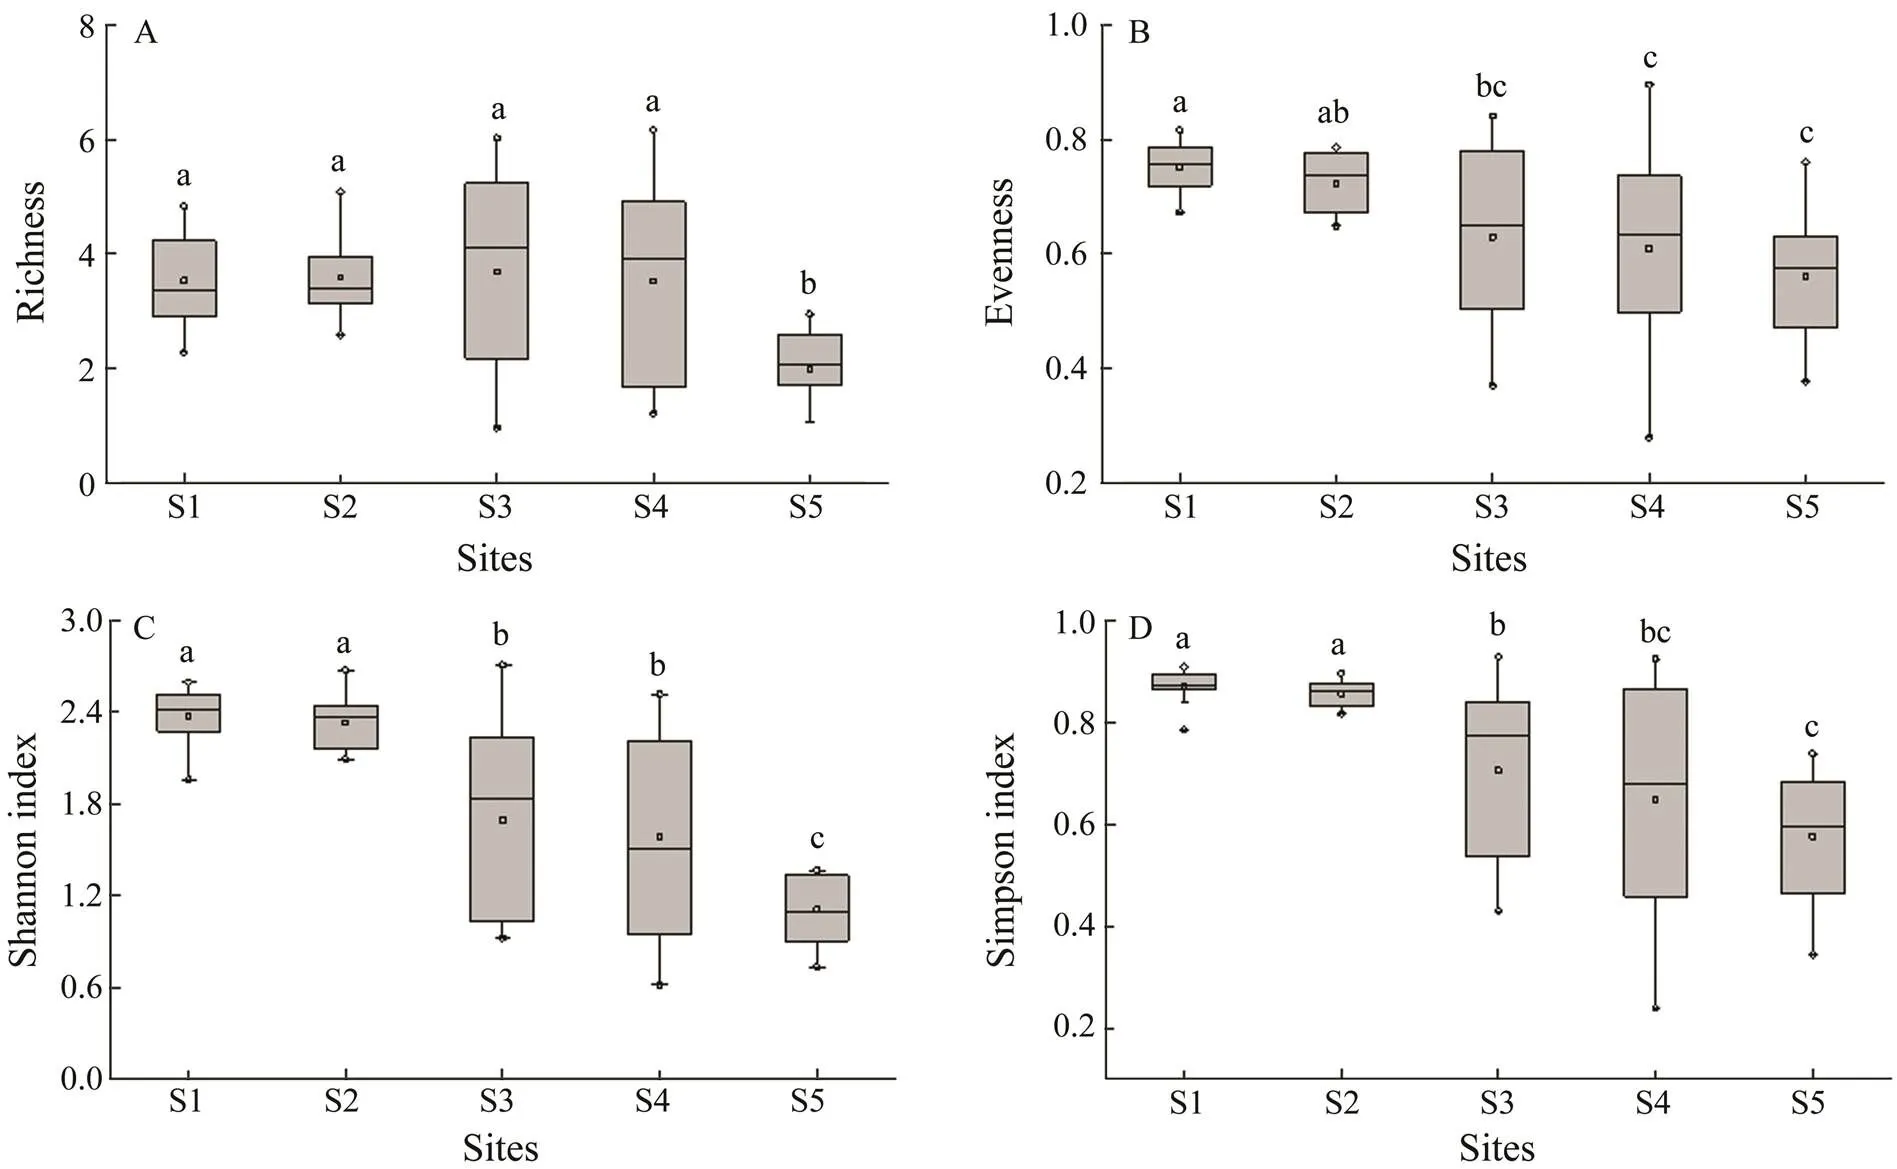
Fig.2 Comparisons of alpha-diversity estimators of zooplankton detected in the Guangzhou segment and estuary of the Pearl River. A, richness; B, evenness; C, Shannon index; D, Simpson’s index. Significant differences are indicated by lowercase letters (one-way ANOVA, Tukey’s test, P<0.05).
3.3 The Spatiotemporal Distribution of Zooplankton
Total zooplankton abundance ranged from 214 to 4165indL−1, 269 to 2635indL−1, 17 to 154indL−1, 5 to 117ind L−1, and 1 to 82indL−1, with mean values of 1026±1082indL−1, 1261±801indL−1, 59±44indL−1, 28±32indL−1, and 23±28indL−1at S1, S2, S3, S4, and S5, respectively. Zooplankton abundanceswere significantly higher at S1 and S2 than at the other three sites (=0.0001), and no significant difference was observed between S1 and S2 (Fig.3). The abundances at S1, S2, and S3 reached a maxi- mum in March 2013, while the peak was observed in July at S4, and in February at S5. The peaks of the different zooplankton groups alternated among the five sites. The densities of copepods at S1 and S2 peaked when rotifers were abundant. Rotifer abundances generally peaked first, and then copepod densities increased along with low ro- tifer numbers the next month at S3, S4, and S5 (Fig.3).
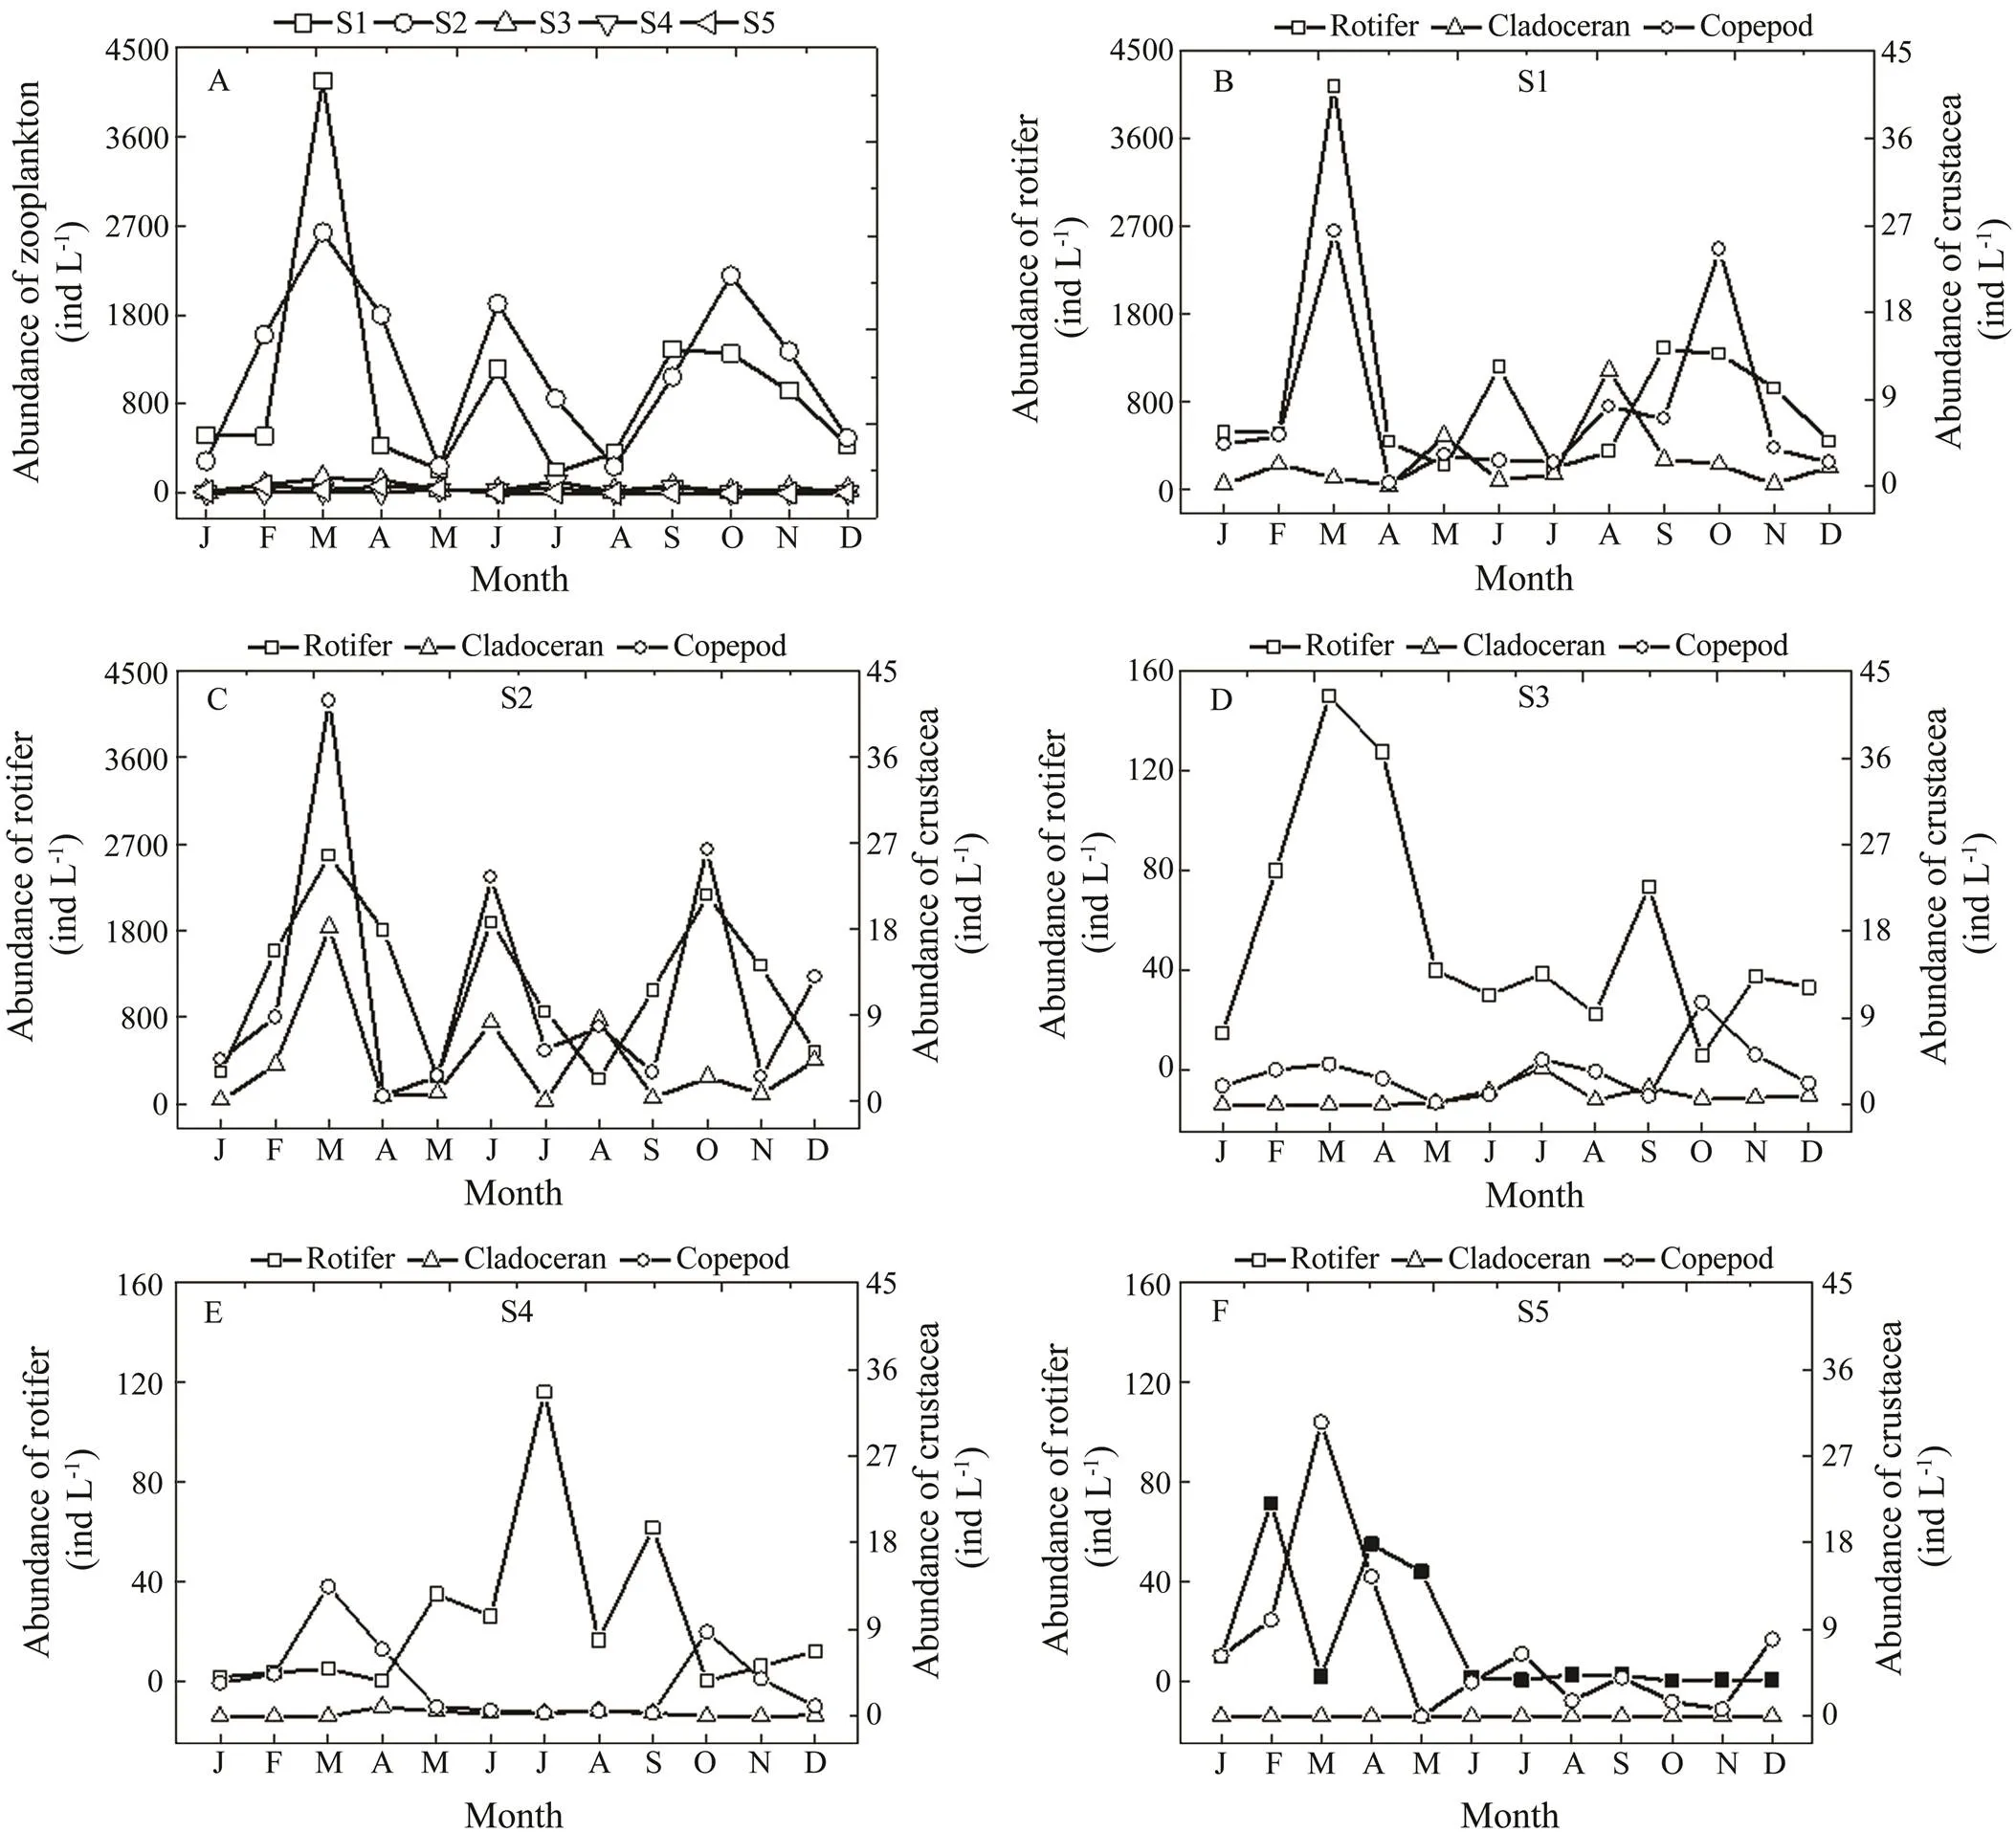
Fig.3 Seasonal variation in zooplankton abundance in the Guangzhou segment and estuary of the Pearl River in 2013. A, variation in total abundance of zooplankton among the five sites; B, variation in rotifer, cladoceran, and copepod abundances at S1; C, variation in rotifer, cladoceran, and copepod abundances at S2; D, variation in rotifer, cladoceran, and copepod abundances at S3; E, variation in rotifer, cladoceran, and copepod abundances at S4; F, variation in rotifer, cladoceran, and copepod abundances at S5.
3.4 Correlations Between Zooplankton and Environmental Factors
The RDA explained 62.7% of the variation in the zoo- plankton assemblage (Fig.4). The primary canonical axis explained 60.59% of the total species-environmental cor- relation. TN, TP, Chl-, and salinity were aligned strongly with this axis, explaining 47%, 42.7%, 32.2%, and 31.8% of the species-environmental correlation, respectively. The secondary axis contributed only 1.97% of the total spe- cies-environmental correlation. The RDA ordination showed that all samples could be separated into two groups asso- ciated with different salinity ranges according to the en- vironmental variables. One group included S1 and S2 in the Guangzhou city segment, and zooplankton was found at a relatively high abundance in this group (rotifers, cla- docerans and total zooplankton). The other group includ- ed the other three sites with higher salinity, and zooplank- ton occurred in this group at a relatively lower abundance.
The RDA plots show that zooplankton was positively correlated (<0.01) with TN, TP, and Chl-at S1 and S2 (Fig.4). The other groups, including S3, S4, and S5, show- ed an apparent salinity gradient.

Fig.4 Redundancy analysis (RDA) plot of the relationship between zooplankton and environmental factors for all sampling sites (S1–S5) (with axis 1 explaining 60.59% and axis 2 explaining 1.97% of the total variation). Zooplank- ton are indicated by blue arrows, environmental variables by red arrows and ordinations of samples with circles in black (S1 and S2), diamonds in green (S3), boxes in or- ange (S4) and up triangles in red (S5). WT, water tem- perature; Trans, transparency; TZ, total zooplankton; Chla, Chl-a.
Rotifer, cladoceran, and zooplankton abundances in all samples from the Pearl River show that all of these indi- ces of zooplankton community structure decreased with in- creasing salinity from the city segment to the estuary (Fig.5). Most of the rotifers, cladocerans, and total zoo- plankton were distributed in 0–1 salinity, whereas fewer were found in the 1–22 salinity areas. The upper limit of the rotifer, cladoceran, and total zooplankton abundances appeared to decline exponentially with increasing salinity. In addition, the variation in salinity had a minimal effect on the abundance of copepods (Fig.5).
4 Discussion
It is widely accepted that estuarine ecosystems are more fluctuated than themarine ecosystem (Hwang., 2010; Liu., 2018). Abiotic parameters, such as sali- nity, fluctuate widely and affect animals moving against spatial gradients (Gutierrez., 2018). These fluctua- tions are major physiological problems for animals float- ing in rivers. Osmotic stress caused by fluctuations ofsalinity lead to changes in basal metabolic rate, resulting in reduced surplus energy available for other activities, such as locomotion, growth, reproduction, and survival (Nielsen., 2010; Oliveira., 2016).

Fig.5 Relationships between the abundance of different groups of zooplankton and salinity. A, total zooplankton abundance; B, rotifer abundance; C, cladoceran abundance; D, copepod abundance.
4.1 Zooplankton Species Composition
Zooplankton is an important component of aquatic food webs and is highly vital to the transfer of energy and matter from primary producers to higher trophic-level- consumers. Therefore, changes in zooplankton community structure as a result of salinity variations are expected to have broad consequences for ecosystem functioning. In previous studies, it has been suggested that zooplankton diversity is affected by salinity (Gutierrez., 2018). As expected, we found that zooplankton species number, rich- ness, evenness, Shannon index, and Simpson’s index va-lues decreased with increasing salinity from 0.10 to 21.26 in the present study (Table 3; Fig.2). Furthermore, the zooplankton species compositions at S1 and S2 (freshwa- ter) were similar but differed from those at the hyposaline sites (S3 and S4) and the meso-hypersaline site (S5). The structure of the zooplankton community at the five sites changed along the salinity gradient. Salinity-tolerant species, such as rotifers,,,, andand copepod, do- minated the zooplankton community at the high-salinity sites, which is consistent with the results of other experi- mental studies (Bailey., 2010). The copepods identi- fied in this study are considered salt-tolerant species, which explains their high tolerance to salinity not only in the low salinity water but also in the estuaryof the Pearl Ri- ver. Rotifers are microscopic animals that mostly live in freshwater environments (Vladimír, 1983), whileandare salt-tolerant species that frequently oc- cur in highly saline systems and brackish water (Park and Marshall, 2000; Azémar., 2007). A high abundance of,, and, which have been pre- viously reported living in freshwater (Sanoamuang, 1992; Dumont., 2006; Santangelo., 2007),were detected at the high-salinity sites (S3, S4, and S5), indicating that these three species are salt-tolerant. Neschuk. (2002) reported that most rotifer species tolerate a wide range of salinities and only a small group avoids high-sa- linity waters. The differences in zooplankton species com- position among the five sampling sites with different salinity levels confirm that salinity can affect the structure of the zooplankton community, and that species withmore salt-tolerant capability can survive at high-salinity sites.
4.2 Correlation Between Zooplankton and Environmental Factors
4.2.1 Salinity
Schallenberg. (2003) analyzed the correlations be- tween zooplankton and environmental factors and report- ed that salinity is the most important factor affectingthe zooplankton community in Lake Waihola. Salinity was more important than either nutrients or wind-induced tur- bidity, as salinity determines 40% of the species-environ- ment correlation. The importance of salinity in affectingthe zooplankton community structure was confirmed in the present study (Figs.4 and 5). The similar dominant effect of salinity on the zooplankton community structure has also been demonstrated in the Charente Estuary (France) along a salinity gradient ranging from freshwater to sali- nity 25 (Modéran., 2010). However, the effect of sali- nity on the abundance of each zooplankton phylum differed in this study. Along the salinity gradient, rotifer abun-dance was negatively correlated with salinity (Fig.5), which is consistent with the report of Ji and Ye (2006), who found that rotifer abundance decreases with increasing salinity from the Yangtze River Estuary mixing zone to the south branch. However, Viayeh (2012) reported a positive cor- relation between water salinity and rotifer abundance in shallow water bodies in Iran. Fontaneto. (2006) con- sidered that freshwater generally maintains a larger num- ber of rotifers than saltwater. In the present study, clado- cerans exhibited a negative relationship with salinity from the city segment to the estuary of the Pearl River (Fig.5), which was attributed to their poor osmoregulatory ability (Frey, 1993). Among the cladocerans identified in this study,andspp. generally lived in freshwater, and the other species were widely distributed (Chengalath, 1982; Bos., 1999). A low correlation was detected be- tween copepod abundance and salinity in this study (Fig.5). The copepods adapted to a wide range of salinities (Ho- lste and Peck, 2006). For example,andgenerally inhabit in low-salt brackish or freshwater (Sheng, 1979), which was consis- tent with our results that the two species were found in the Guangzhou city segment of the Pearl River in fresh- water.andwere reported to live in 10–35 salinity (Tan., 2004), andlives in low-salt brackish water (Sheng, 1979), which explains why these three species were only found at the relatively saltier sites (S3, S4, and S5). In general, salinity has a significant effect on zooplankton composition and some species that prefer freshwater decrease in abundance in an estuarine ecosystem.
4.2.2 Nutrients
Because salinity can affect other environmental factors, such as the flocculation of dissolved organic carbon and inorganic matter (Sholkovitz, 1976), saline inputs affect other aspects of river water chemistry. The concentrations of nutrients, such as nitrogen and phosphorus, affected the zooplankton community structure in the Pearl River. High concentrations of TN and TP were found at the relatively freshwater sites of S1 and S2, along with a high Chl-con- tent and a high abundance of total zooplankton (Table 2 and Fig.3). The high concentration of nutrients promoted primary production, which, in turn, facilitated the repro- duction and growth of zooplankton and other predators that feed on the primary producers (Fermani., 2013). The higher nutrient content detected at sites S1 and S2 was closely related to human activities. A large amount of do- mestic and industrial wastewater is discharged into the Guangzhou city segment of the Pearl River, so this sec- tion is subjected to eutrophication. Zooplankton abundance will increase with increasing eutrophication in a wide rangeof temperate-tropical lakes, and rotifers dominate total zoo-plankton abundance within highly eutrophied waters (Park, 2000). This observation explains why the total zooplank- ton and rotifer abundances were higher at sites S1 and S2 than those at the other sites from the perspective ofeutro- phication. Nitrogen and phosphorus are important drivers influencing freshwater ecosystems (Yang., 2018).
4.3 The Spatiotemporal Distribution of Zooplankton Abundance
Although the structure of the zooplankton community changed with variations in salinity, the turnover among rotifers, cladocerans, and copepods at each site presented a similar pattern. In the present study, the peak in cope- pod abundance always can be oberved when or after roti- fer abundance reached a peak (Fig.3). Predation by co- pepods could explain why copepod abundance reached a peak after the rotifer abundance peaked at sites S3, S4, and S5. Many copepod species ingest other zooplankton, including cladocerans and rotifers (Yang., 1998). Cope- pods control the populations of rotifers and cladocerans and have obvious top-down effects on them (Yang., 1998). The mutual influence of eutrophication and preda- tion could explain why the peak of copepod and rotifer abundances overlapped at sites S1 and S2. However, the highest abundances of zooplankton were detected during the dry season at different sampling sites, exceptfor site S4, which may be related to the hydrological conditions in the estuary. For example, more runoff occurs during the rainy season than that during the dry season (Rougier, 2005). Zooplankton abundance at S4 may be influenced by hu- man disturbance, as the site is near the Humen Bridge. In addition, phytoplankton biomass (measured as Chl-con- tent) decreased along the salinity gradient from freshwa- ter to high-salinity water, which was likely controlled by the abundance of herbivorous zooplankton (Schriver., 2010). Food web interactions likely affect zooplankton community structure in the Pearl River, and biological in- teractions affecting zooplankton, such as predation and ingestion, interact with the variation in salinity as demonstrated previously (Jeppesen., 1994).
5 Conclusions
Overall, our results support our hypothesis that the increase in salinity from the Guangzhou city segment to the estuary of the Pearl River results in severe decreases in the biodiversity and abundance of zooplankton after in- vestigating five sites along the salinity gradient. Zooplank- ton species number, richness, evenness, Shannon index, and Simpson’s index values decreased with increasing sa- linity. The effect of salinity on zooplankton abundance dif- fered during the investigation. The abundances of total zoo- plankton, rotifers, and cladocerans were negatively corre- lated with salinity, while there was little correlation be- tween the abundance of copepods and salinity. The peak in copepod abundance always occurred when or after thepeak of rotifer abundance. The structural characteristics of the zooplankton community were affected by the compre- hensive effects of salinity-based environmental factors. Tofully understand the effects of salinity on zooplankton com- munity structure, future investigations should focus on the effects of sampling-scale that include spatial extent and time scale.
Acknowledgements
This research was financially supported by the National Natural Science Foundation of China (No. 41673080) and the China Postdoctoral Science Foundation (No. 2020M6 72449). We especially thank the anonymous reviewers for their constructive comments on the manuscript.
Azémar, F., Damme, S. V., Meire, P., and Tackx, M., 2007. New occurrence of(Murray, 1913) and some other alien rotifers in the Schelde estuary (Belgium)., 137: 75-83.
Bailey, S. A., Duggan, I. C., Van-Overdijk, C. D. A., Johengen, T. H., Reid, D. F., and Macisaac, H. J., 2010. Salinity toler- ance of diapausing eggs of freshwater zooplankton., 49: 286-295.
Bănaru, D., and Harmelinvivien, M., 2018. Trophic links and riverine effects on food webs of pelagic fish of the north- western Black Sea., 60: 529- 540.
Boronat, L., Miracle, M. R., and Armengol, X., 2001. Cladoce- ran as semblages in a mineralization gradient., 442: 75-88.
Bos, D. G., Cumming, B. F., and Smol, J. P., 1999. Cladocera and Anostraca from the Interior Plateau of British Columbia, Ca- nada, as paleolimnological indicators of salinity and lake le- vel., 392: 129-141.
Chai, Z. Y., He, Z. L., Deng, Y. Y., Yang, Y. F., and Tang, Y. Z., 2018. Cultivation of seaweedenhanced biodiversity in a eukaryotic plankton community as re-vealedmetagenomic analyses., 27: 1081- 1093.
Chengalath, R., 1982. A faunistic and ecological survey of the littoral Cladocera of Canada., 60: 2668-2682.
Conde-porcuna, J. M., Pérez-martínez, C., and Moreno, E., 2018. Variations in the hatching response of rotifers to salinity and waterbird ingestion.,40: 326-341.
Dumont, H. J., Sarma, S. S. S., and Ali, A. J., 2006. Laboratory studies on the population dynamics of(Rotifera) in relation to food density., 33: 39- 46.
Fermani, P., Diovisalvi, N., Torremorell, A., Lagomarsino, L., and Zagarese, H. E., 2013. The microbial food web structure of a hypertrophic warm-temperate shallow lake, as affected by contrasting zooplankton assemblages., 714: 115-130.
Fielder, D. S., Purser, G. J., and Battaglene, S. C., 2000. Effect ofrapid changes in temperature and salinity on availability of the rotifersand., 189: 85-99.
Fontaneto, D., Smet, W. H., and Ricci, C., 2006. Rotifers in salt- water environments, re-evaluation of an inconspicuous taxon., 86: 623-656.
Frey, D. G., 1993. The penetration of Cladocera into saline waters., 267: 233-248.
Garreta-Lara, E., Campos, B., Barata, C., Lacorte, S., and Tauler, R., 2018. Combined effects of salinity, temperature and hy- poxia on,, metabolism., 610-611: 602-612.
Gutierrez, M. F., Ülkü, N. T., Vidal, N., Yu, J. L., Mello, F. T., Çakiroglu, A. I., He, H., Liu, Z. W., and Jeppesen, E., 2018. Salinity shapes zooplankton communities and functional diversity and has complex effects on size structure in lakes., 813: 237-255.
Holste, L., and Peck, M. A., 2006. The effects of temperature and salinity on egg production and hatching success of Baltic(Copepoda: Calanoida): A laboratory investigation., 148: 1061-1070.
Hwang, J. S., Kumar, R., Hsieh, C. W., Kuo, A. Y., Souissi, S., Hsu, M. H., Wu, J. T., Liu, W. C., Wang, C. F., and Chen, Q. C., 2010. Patterns of zooplankton distribution along the marine, estuarine, and riverine portions of the Danshuei ecosystem in northern Taiwan., 49: 335-352.
IPCC, 2001. Third report of the working group of the inter- governmental panel on climate change. Intergovernmental Panel on Climate Change, http://www.ipcc.ch.
从经济关系看,称之为全民所有制形式的国家所有制是苏联政治制度的经济基础,但这种所有制只把劳动者看作活劳动的体现者,而未能成为它的主人。在这种高度集中管理国家财产的条件下,这种所有制形式的空洞性越来越明显地暴露出来。在财产的分配、有效的使用和增加方面与生产者没有现实的利害关系。
Jeppesen, E., Søndergaard, M., Kanstrup, E., Petersen, B., Erik- sen, R. B., Hammershøj, M., Mortensen, E., Jensen, J. P., and Have, A., 1994. Does the impact of nutrients on the biological structure and function of brackish and fresh-water lakes differ?, 275: 15-30.
Ji, H. H., and Ye, S. F., 2006. Ecological distribution characteristics of zooplankton and its relationship with environmental factors in the Changjiang River estuary., 30: 23-30 (in Chinese with English abstract).
Jiang, S. C., and Du, N. S., 1979.,,. Science Press, Academia Sinica, Beijing, 80- 271 (in Chinese).
Koste, W., 1978.,. Gebrüder Borntraeger, Berlin, 463pp.
Li, K. Z., Yin, J. Q., Huang, L. M., and Tan, Y. H., 2006. Spatial and temporal variations of mesozooplankton in the Pearl Ri- ver Estuary, China., 67: 543-552.
Li, Y. H., Hong, Y. X., and Wu, S. J., 2011. Comparison of the antioxidation ability in different age classes ofpopulation in Quanzhou Bay., 2: 1-15 (in Chinese with English abstract).
Liu, X. B., Pan, J., Liu, Y., Li, M., and Gu, J. D., 2018. Diversity and distribution of Archaea in global estuarine ecosystems., s637-638: 349-358.
Neschuk, N., Claps, M., and Gabellone, N., 2002. Planktonic rotifers of a saline-lowland river: The Salado River (Argentina).,14: 191-198.
Nielsen, D. L., Brock, M. A., Crosslé, K., Harris, K., Healey, M., and Jarosinski, I., 2010. The effects of salinity on aquatic plant germination and zooplankton hatching from two wetland se- diments.,48: 2214-2223.
Oliveira, M. V. V. D., Intorne, A. C., Vespoli, L. D. S., Madu- reira, H. C., Leandro, M. R., Pereira, T. N. S., Oliveira, F. L., Berbert-Molina, M. A., and Filho, G. A. D. S., 2016. Differen- tial effects of salinity and osmotic stress on the plant growth- promoting bacteriumPAL5., 198: 287-294.
Park, G. S., 2000. Estuarine relationships between zooplankton community structure and trophic gradients., 22: 121-136.
Park, G. S., and Marshall, H. G., 2000. The trophic contributions of rotifers in tidal freshwater and estuarine habitats., 51: 729-742.
Rougier, C., Pourriot, R., Lam-Hoai, T., and Guiral, D., 2005. Ecological patterns of the rotifer communities in the Kaw River Estuary (French Guiana)., 63: 83-91.
Sanoamuang, L., 1992. The ecology of mountain lake rotifers in Canterbury, with particular reference to Lake Grasmere and the genusBory de St. Vincent. PhD thesis. University of Canterbury, New Zealand, 24-56.
Santangelo, J. M., Rocha, A. D. M., Bozelli, R. L., Carneiro, L. S., and Esteves, F. D. A., 2007. Zooplankton responses to sandbar opening in a tropical eutrophic coastal lagoon., 71: 657-668.
Schallenberg, M., Hall, C. J., and Burns, C. W., 2003. Consequences of climate-induced salinity increases on zooplankton abundance and diversity in costal lakes., 251: 181-189.
Schriver, P., Bøgestrand, J., Jesppesen, E., and Søndergaard, M., 2010. Impact of submerged macrophytes on fish-zooplankton- phytoplankton interactions: Large-scale enclosure experiments in a shallow eutrophic lake.,33: 255-270.
Sheng, J. R., 1979.,,. Science Press, Academia Sinica, Beijing, 53-418 (in Chi- nese).
Sholkovitz, E., 1976. Flacculation of dissolved organic and in- organic matter during mixing of river water and sea water., 40: 831-845.
Šmilauer, P., and Lepš, J., 2013.. Cambridge University Press, United Kingdom, 10-34.
State Environmental Protection Administration of China (SEPAC),1996.. Chinese Environmental Press, Beijing, 243-284 (in Chinese).
Tan, Y., Huang, L., Chen, Q., and Huang, X., 2004. Seasonal va- riation in zooplankton composition and grazing impact on phytoplankton standingstock in the Pearl River Estuary, Chi- na., 24: 1949-1968.
Viayeh, R. M., and Špoljar, M., 2012. Structure of rotifer assem- blages in shallow waterbodies of semi-arid northwest Iran dif- fering in salinity and vegetation cover., 686: 73- 89.
Vladimír, S., 1983. Rotifers as indicators of water quality., 100: 169-201.
Wang, J. J., 1961.. Science Press, Beijing, 288pp (in Chinese).
Wang, Q., Yang, Y. F., and Chen, J. F., 2009. Impact of environ- ment on the spatio-temporal distribution of rotifers in the tidal Guangzhou segment of the Pearl River Estuary, China., 94: 688-705.
Xu, Y. G., Li, A. J., Qin, J. H., Li, Q., Ho, J. G., and Li, H. S., 2017. Seasonal patterns of water quality and phytoplankton dy- namics in surface waters in Guangzhou and Foshan, China., s590-591: 361-369.
Yang, Y. F., Yang, J. X., and Huang, X. F., 1998. Feeding ofon zooplankton., 22: 71-78.
Yang, Y. Z., Ni, P., Gao, Y. C., Xiong, W., Zhao, Y., and Zhan, A. B., 2018. Geographical distribution of zooplankton biodiversity in highly polluted running water ecosystems: Validation of fine-scale species sorting hypothesis., 8: 4830-4840.
Yin, K. D., Qian, P. Y., Chen, J. C., Hsieh, D. P. H., and Harrison, P. J., 2000. Dynamics of nutrients and phytoplankton biomass in the Pearl River estuary and adjacent waters of Hong Kong during summer: Preliminary evidence for phosphorus and silicon limitation., 194: 295-305.
s. E-mail: wq2010@jnu.edu.cn
E-mail: tyyf@jnu.edu.cn
January 19, 2020;
April 3, 2020;
October 16, 2020
(Edited by Qiu Yantao)
猜你喜欢
杂志排行
Journal of Ocean University of China的其它文章
- Numerical Simulation and Risk Analysis of Coastal Inundation in Land Reclamation Areas: A Case Study of the Pearl River Estuary
- Variation of Yellow River Runoff and Its Influence on Salinity in Laizhou Bay
- Cold Water in the Lee of the Batanes Islands in the Luzon Strait
- Preliminary Design of a Submerged Support Structure for Floating Wind Turbines
- Inversion of Oceanic Parameters Represented by CTD Utilizing Seismic Multi-Attributes Based on Convolutional Neural Network
- Trace-Norm Regularized Multi-Task Learning for Sea State Bias Estimation