Numerical Simulation and Risk Analysis of Coastal Inundation in Land Reclamation Areas: A Case Study of the Pearl River Estuary
2020-11-30DUMeiHOUYijunGUOYunxiaandWANGKai
DU Mei, HOU Yijun, GUO Yunxia, and WANG Kai
Numerical Simulation and Risk Analysis of Coastal Inundation in Land Reclamation Areas: A Case Study of the Pearl River Estuary
DU Mei1), 2), 4), HOU Yijun1), 2), 3), 4), *, GUO Yunxia1), 2), 4), and WANG Kai1), 2), 4)
1) Key Laboratory of Ocean Circulation and Waves, Institute of Oceanology, Chinese Academy of Sciences, Qingdao 266071, China 2) University of Chinese Academy of Sciences, Beijing 100049, China 3) Laboratory for Ocean and Climate Dynamics, Qingdao National Laboratory for Marine Science and Technology, Qingdao 266237, China 4) Center for Ocean Mega-Science, Chinese Academy of Sciences, Qingdao 266071, China
Coastal inundation results in many human casualties and significant economic losses. In this study, an inundation model with an unstructured mesh was developed using the ADvanced CIRCulation (ADCIRC) and Simulating WAves Nearshore (SWAN) models to simulate 43 inundation events from 1998 to 2018. A combined wind-pressure field derived from the assimilation wind-pressure model was used to drive the coupled ADCIRC-SWAN model. On the basis of the model results, a sensitivity study of the influence of land reclamation on coastal inundation was conducted. The results of the study showed that coastline changes caused by reclamation significantly influence the distribution of coastal inundation, particularly in areas where narrow waterways, bays, and peninsulas are newly formed. Combining the extreme inundation events calculated using the Gumbel and Weibull distributions, the 10-year, 50-year, 100-year, and 200-year return coastal inundations were obtained for the Pearl River Estuary in China. The risk of coastal inundation was analyzed according to the probability of the inundation depth exceeding 1m. A hazard grade zoning map was drawn to guide disaster relief and mitigation in the reclamation area.
coupled ADCIRC-SWAN model; coastline change; coastal inundation; Pearl River Estuary; risk analysis
1 Introduction
Coastal inundations are induced by destructive storm surges (induced by tropical cyclones), which are common in many coastal areas. The losses caused by destructive storm surges and coastal inundations are significant for coastal cities with increasing population and tropical cyclone frequency and intensified coastal development (Hallegatte, 2013; Kang, 2016; Yin, 2016; Tomiczek, 2017). Thus, coastal inundations need to be investigated to reduce losses.
Previous studies have focused on simulating the dynamic processes of storm surges by using numerical models (Jones and Davies, 2009; Lin, 2009; Feng, 2011, 2012; Choi, 2013). These studies play a guiding role in simulating coastal inundation, such as the selection of the model and the construction of the mesh. Bhaskaran(2014) and Yin(2016) simulated coastal inundations during cyclones. Their results showed that the ADvanced CIRCulation (ADCIRC) model can precisely simulate coastal inundation. Sheng(2010) simulated the coastal floods of Hurricane Ivan (2004) in selected areas. They observed that the inundated area expands under the action of waves. Therefore, waves should be added to the simulation of the coastal inundation process to consider their influence. Moreover, many studies have focused on calculating the return period of the storm surge on the basis of the model results to assess the risks (Lin, 2010; Zhang, 2014a; Wu, 2015; Wang, 2018). These results not only provide a way for the government to analyze the risk of storm surges but also help enable risk analysis and risk assessment of coastal inundations.
Notably, the resolution of the mesh and the shape of the coastline affect the accuracy of the model results (Kerr, 2013; Passeri, 2015; Bilskie, 2016a; Ding and Wei, 2016; Shen, 2018). Moreover, the shape of the coastline changes after it experiences natural factors (, sediment deposition, seawater erosion, and global warming) and human factors (, port construction, rec- lamation, and marine engineering) (Weng, 2002; Solomon, 2005). In the economically developed and densely popu- lated estuary delta area, the coastline changes are rela- tively obvious, such as in some regions of the Pearl River Estuary in China (Li and Damen, 2010; Wang, 2013; Zhang, 2014b). Fig.1b synthesizes some of the achi- evements of previous studies on coastline changes in some parts of the Pearl River Estuary based on satellite remote sensing. The increase in the land area and the narrowing of the Pearl River Estuary are due to the continuous ex- pansion of the land to the sea. In the past half-century, the islands and coastlines in Jinwan District of Zhuhai City have been connected to form a new land boundary. In sum- mary, coastline changes increase the difficulty of coastal inundation risk analysis in this area because they affect the numerical prediction and simulation of coastal inundations.
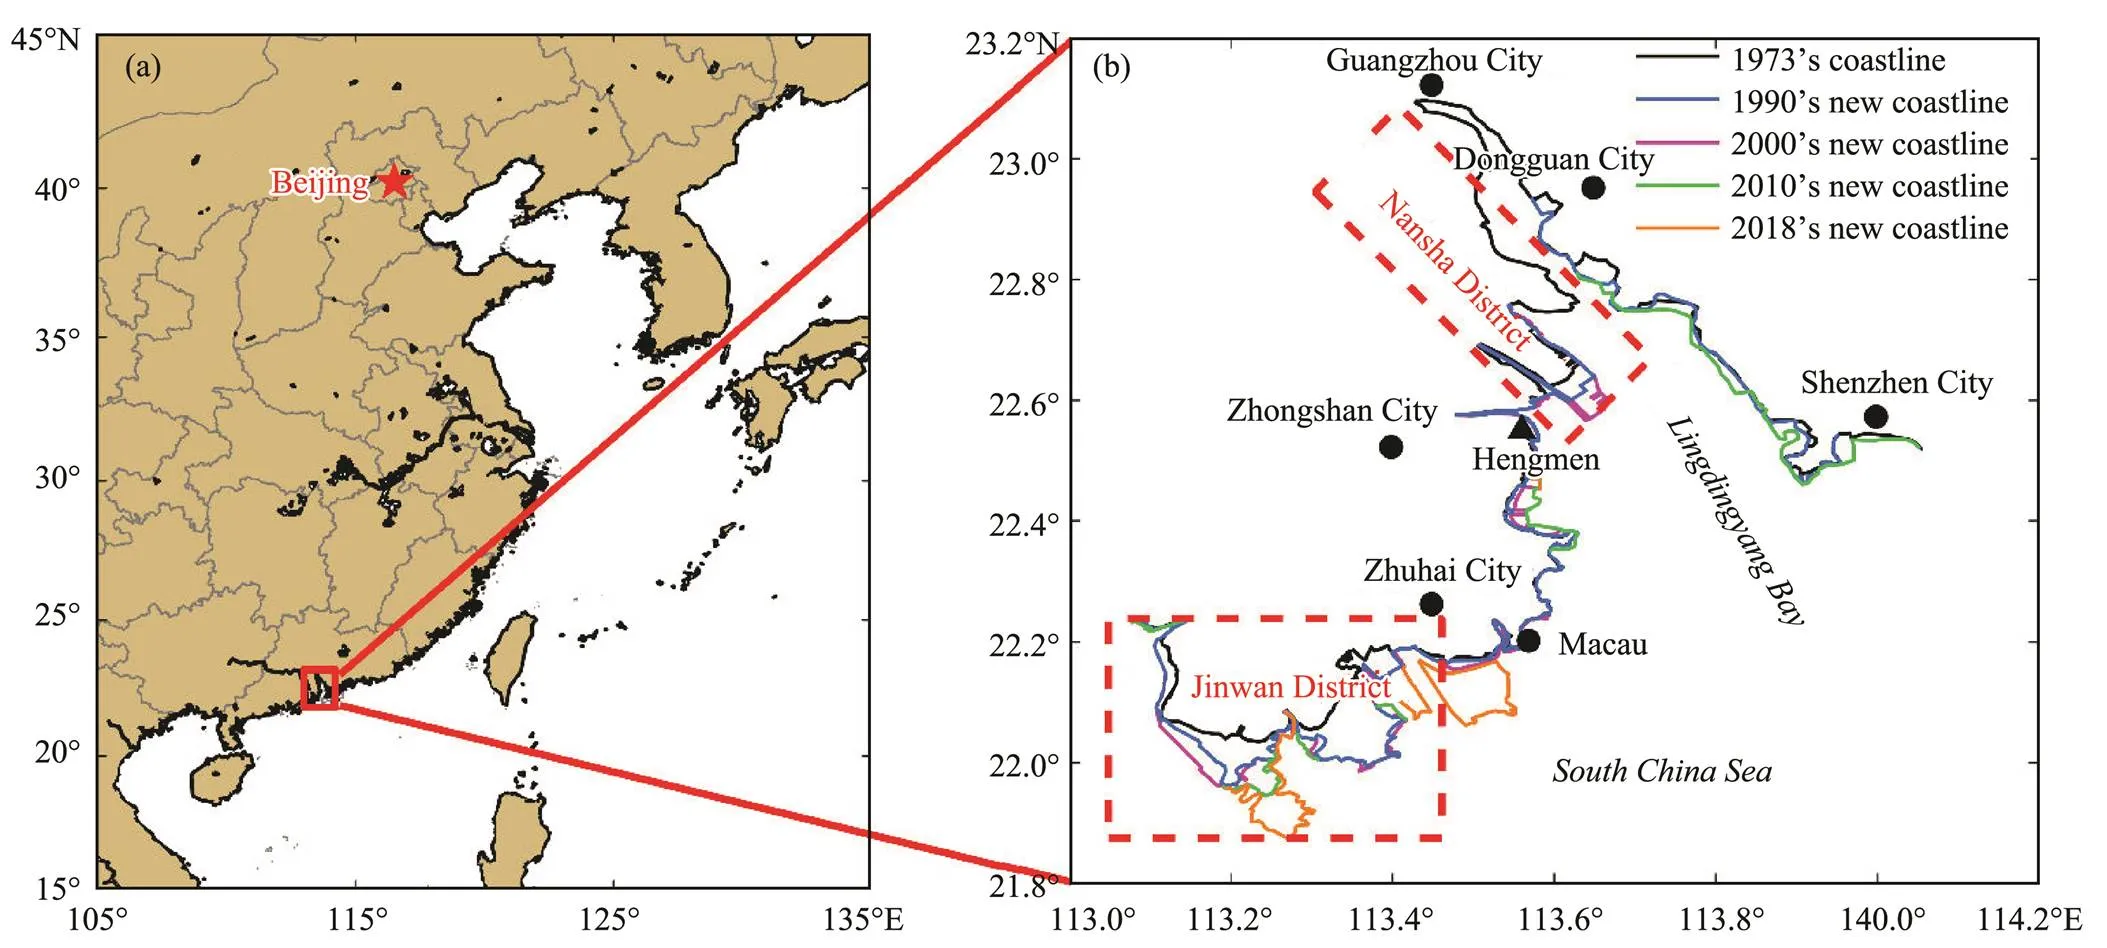
Fig.1 Coastline changes in some parts of the Pearl River Estuary in China. The two districts enclosed by the red dashed boxes in (b) are discussed in Section 4.
To address the aforementioned issues, this study focuses on the numerical simulation and risk analysis of coastal inundation under land reclamation (, port construction, reclamation, and marine engineering). In this study, the Pearl River Estuary in China is used as an example. With the coupled ADvanced CIRCulation-Simulating WAves Nearshore (ADCIRC-SWAN) model and an assimilation wind-pressure model, 43 inundations of the Pearl River Estuary in China from 1998 to 2018 are simulated. On the basis of the model results, a sensitivity study of the influence of coastline changes on coastal inundations in reclamation areas is conducted. Combining the extreme inundation events calculated using the Gumbel and Weibull distributions, the 10-year, 50-year, 100-year, and 200-year return coastal inundations are obtained. We analyze the coastal inundation risk in some areas of the Pearl River Estuary according to the probability of the inundation depth exceeding 1m. A hazard grade zoning map is drawn to guide disaster relief and mitigation in the reclamation area. The remainder of the paper is organized as follows: Section 2 describes the methods and data. Section 3 presents the model validation. Section 4 discusses the sensitivity of coastal inundations to coastline changes and presents the hazard grade zoning map and the return period of coastal inundations. Finally, Section 5 summarizes the main results and provides a guide for government departments tasked with coastal inundation forecasting and coastal engineering design.
2 Methodology and Data
2.1 Coastal Inundation Model
Regional-scale coastal inundation modeling was performed through the two-dimensional, depth-integrated implementation of the coupled ADCIRC-SWAN model. The ADCIRC model is a finite element model developed by Luettich and Westerink (2007) and Westerink(2006), which has the advantage of flexible coverage, particularly for complex coastlines and tidal hydrodynamics in coastal areas (Suh,2014). The Simulating WAves Nearshore (SWAN) model is a third-generation wave model (Booij, 1999; Ris, 1999), which is suitable for coastal areas, estuaries, and lakes. The ADCIRC model has been used to analyze coastal inundations caused by storm surges in coastal areas (Dietrich, 2010; Bhaskaran, 2014; Bilskie, 2016b). The coupled ADCIRC-SWAN model can be used to simulate the complex process of coastal inundation on a high-resolution unstructured grid.
We construct an unstructured mesh suitable for the coupled ADCIRC-SWAN model. Fig.2 shows the coverage and topography of the calculation domain. The land boundary in the red box is selected from the electronic nautical charts (Zhoushan Chart Information Technology Co., Ltd.; http://www.zshaitu.com/; also mentioned in Section 2.4). The other parts of the coastline were derived from the General Bathymetric Chart of the Oceans (GEBCO; https://www.gebco.net/; also mentioned in Section 2.4). The resolution of the mesh decreases gradually from inland (70m) to offshore (300m) to the deep ocean (30km). The grid covers the Pearl River Estuary with a high resolution (100–200m) (see Fig.2c). The yellow and green lines in Figs.2c and 2d are not only the boundaries of the islands and the mainland but also the demarcations of the dry (land) mesh and the wet (sea) mesh. The simulation time of the model is set to the Coordinated Universal Time (UTC). The coupled ADCIRC-SWAN model considers the tidal, wind, and air pressure forcing. The evolution and depth-averaged velocity of tidal currents on the open boundary are examined. The eight tidal constitu- ents (, K1, K2, M2, N2, O1, P1, Q1, and S2) are obtained using the Oregon State University Tidal Prediction Software (http://volkov.oce.orst.edu/tides/). Moreover, the AD- CIRC model calculates per second, whereas the SWAN model calculates per hour. The simulation results are presented as the output per hour.
2.2 Meteorological Driving Model
The wind forcing and the pressure forcing are calculated by the assimilation wind-pressure model. Taking Typhoon Nida (2016) as an example, the planar views of wind and air pressure from two sources at 18:00 UTC on August 1, 2016, are shown in Fig.3. From the data ob- tained from the website of the National Meteorological Center of the China Meteorological Administration (CMA), the maximum wind speed of Typhoon Nida was 42ms−1and the center of Typhoon Nida was located at 22.3˚N, 115.1˚E at that moment. However, Fig.3b shows that the maximum wind speed (the minimum central pressure) obtained from the Climate Forecast System Version 2 (CFSV2) dataset is lower (higher) than that obtained from the National Meteorological Center of the CMA, and the location of the typhoon’s center is inaccurate. In other words, the wind-pressure field derived from the CFSV2 dataset cannot depict the typhoon event exactly. Fig.3c shows that the assimilation wind-pressure model can precisely simulate the typhoon wind-pressure field.
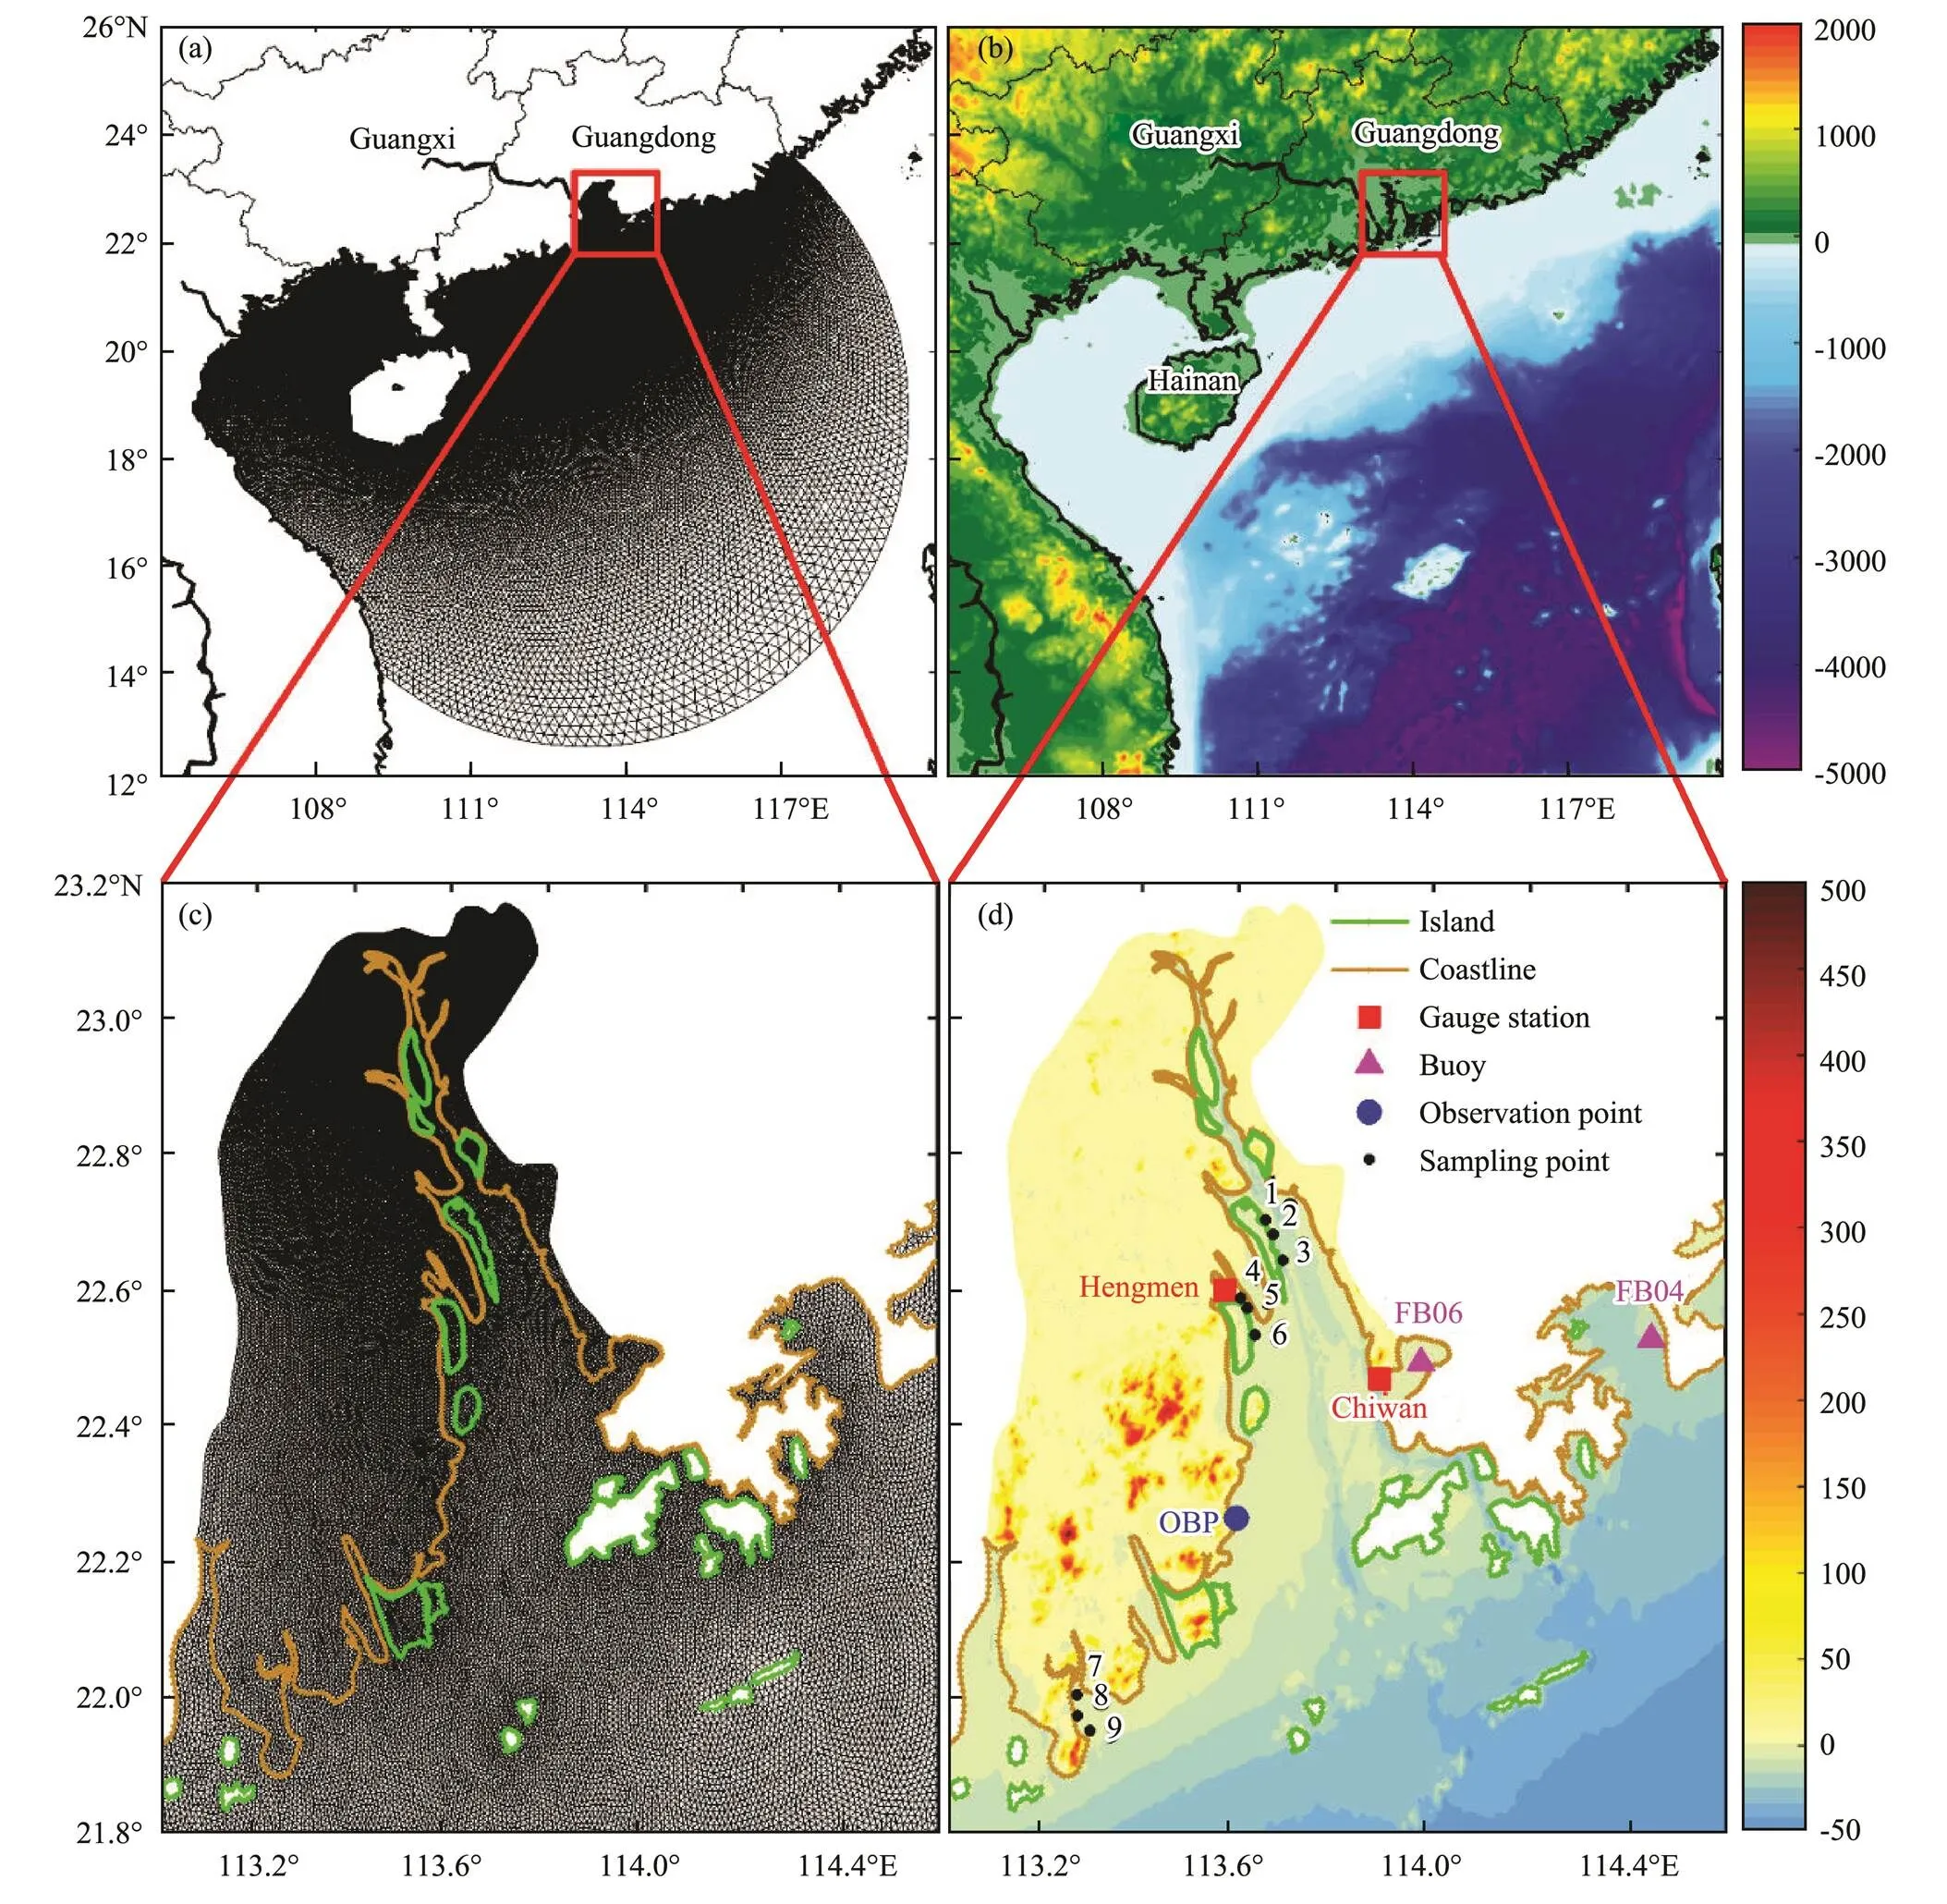
Fig.2 Unstructured mesh (a) and topography (b) (unit: m; shaded) of the computational domain for the coupled AD- CIRC-SWAN model. The mesh shown in (a) has 110055 nodes and 216932 triangular elements. (c) The mesh of Pearl River Estuary (also called Mesh 3) with a horizontal resolution of 70–300m. (d) The mapping position of points and the topography (unit: m; shaded) of the Pearl River Estuary (corresponding to the area in the red box in (b)). The blue dot denotes the observation point (OBP) discussed in Section 3. The black dots denote the sampling points discussed in Section 4.1.
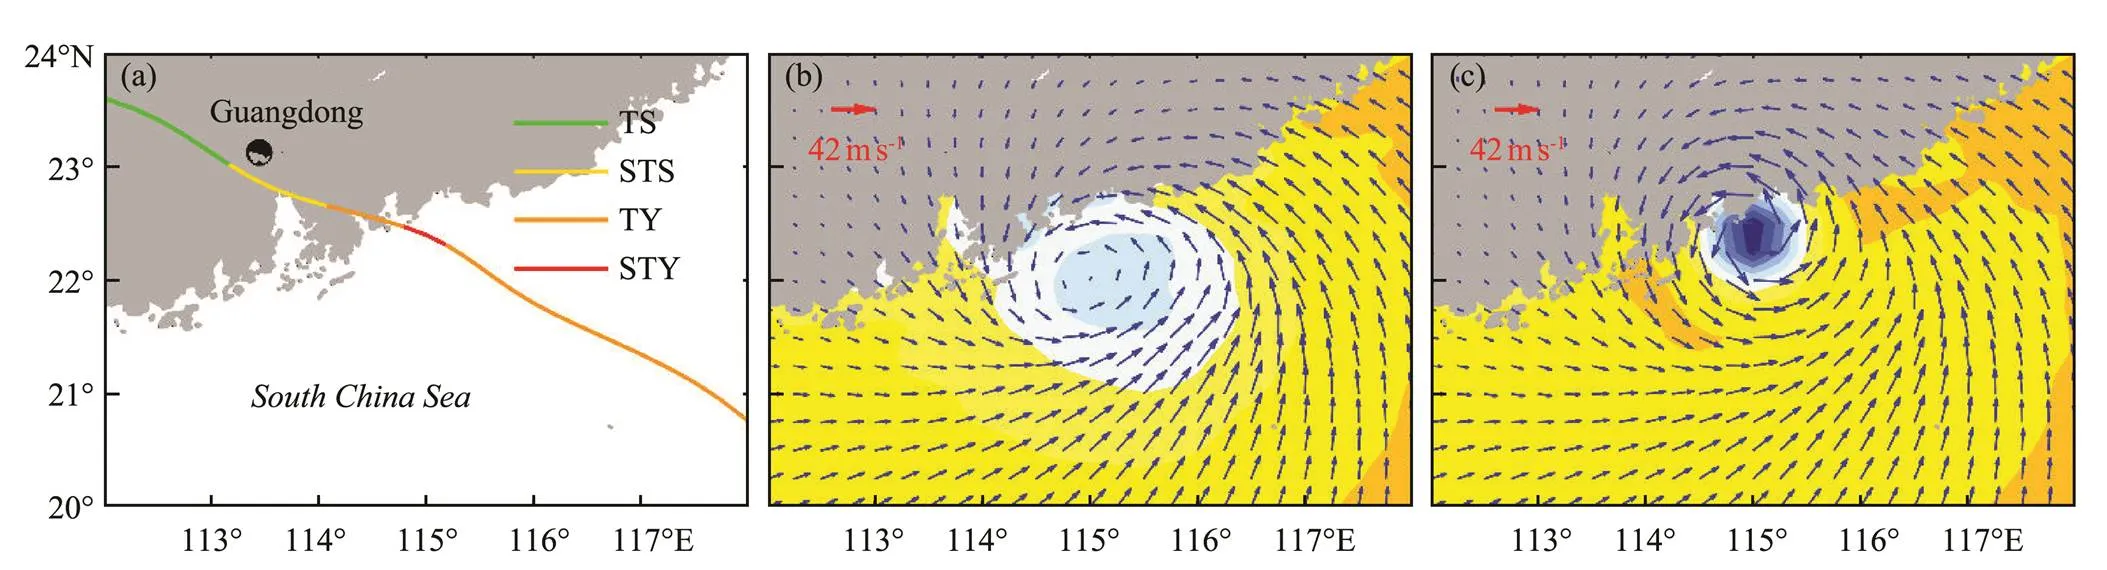
Fig.3 Planar views of Typhoon Nida (2016). The colored lines in (a) show the intensity of the typhoon. Wind velocity (unit: ms−1; vectors) and air pressure (unit: hPa; shaded) at 18:00 UTC on August 1, 2016, obtained from the CFSV2 dataset (b) and derived by the assimilation wind-pressure model (c).
The assimilation wind-pressure model is composed of the analysis products and the Holland model (Holland, 1980). We use Eqs. (1) to (4) to calculate the combined wind-pressure field, which is used as the input file for the coupled ADCIRC-SWAN model:
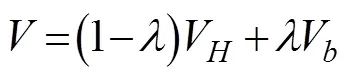
whereVis the wind speed obtained from the Holland model,Pis the pressure obtained from the Holland model,Vis the wind speed obtained from the analysis dataset,Pis the pressure obtained from the analysis dataset, andandare the weight coefficients. When=4, the combined wind-pressure field can provide a relatively accurate description of the dynamic characteristics of the typhoon (Carr and Elsberry, 1997). The formulas for calculating the wind and pressure obtained from the Holland model mentioned previously are expressed as Eqs. (5) and (6):
whereVis the gradient of the wind at radius, Pis the gradient pressure at radius,Pis the ambient pressure (P=1.013×10⁵Pa),is the Coriolis parameter, andPis the central pressure.andare scaling parameters used in the expressionmax=1/B, wheremaxis the radius of the maximum wind speed. The values ofmaxandhave been obtained by Willoughby and Rahn (2004) as follows:


On the basis of the combined wind-pressure field, we interpolate the wind speed and air pressure in the calculation grid suitable for the coupled ADCIRC-SWAN model to generate the wind-pressure file (NWS=305 selected in the model’s setting file fort.15), which is inputted hourly to drive the coupled ADCIRC-SWAN model.
2.3 Inundation Risk Evaluation
In this study, we use the simulation results of the maximum inundation depth caused by several typhoons as samples to calculate the return period of coastal inundation for the entire Pearl River Estuary. The Gumbel and Weibull distributions are used to estimate the return period of the sample extremum. When the sample extremum follows the Gumbel distribution, the distribution function can be expressed as:
Thus, the corresponding probability density function can be expressed as:
and the probability that the maximum value of the sample exceedscan be expressed as:
whereandare the scale and location parameters of the Gumbel distribution, respectively. When the sample extremum follows the Weibull distribution, the distribution function can be expressed as:
Thus, the corresponding probability density function can be expressed as:
and the probability that the maximum value of the sample exceedscan be expressed as:
where,, andare the location, scale, and shape parameters of theWeibull distribution, respectively. Here, two distribution methods are used to fit the maximum inundation depth at all points in the mesh of the computational domain. Among the two fittings, only those that passed the confidence test were used at the point of the mesh.If two fittings pass the confidence test at one point, then the result with the highest confidence was selected. In this study, the fitting results of all of the points in the mesh have passed the confidence test.
2.4 Data
The typhoon tracks were obtained from the CMA Tropical Cyclone Best Track Dataset (http://tcdata.typhoon.org.cn/; Ying, 2014). The analysis products were derived from the hourly time series dataset of the Climate Forecast System Reanalysis (CFSR; https://rda.ucar.edu/datasets/ds093.1/) Selected Hourly Time-Series Product and CFSV2 (https://rda.ucar.edu/datasets/ds094.1/) Select- ed Hourly Time-Series Product (Saha, 2010, 2011). Notably, the CFSR only contains data before 2011, where- as the CFSV2 only contains data after 2011. Thus, these two data products cover the range of data needed. The land topography data were derived from the Global Di- gital Elevation Data Version 2 (GDEMV2; http://www.gscloud.cn/), which has a resolution of 30m. The bathymetry and coastline data were derived from GEBCO (https://www.gebco.net/), which has a resolution of 30s, and electronic nautical charts (Zhoushan Chart Information Technology Co., Ltd.; http://www.zshaitu.com/), which have a resolution of 30m. The land-sea topography is obtained by replacing the land topography of GEBCO with the land topography of GDEMV2. The land-sea topography is merged using the MATLAB software.
In this study, we use the Pearl River Estuary in China as an example. The coastline of this area has changed significantly in the past 50 years (see Fig.1b). Therefore, we adopt the previous analysis results of the coastline characteristics (Weng, 2002; Li and Deamen, 2010; Wang, 2013; Zhang, 2014b) to achieve a highly accurate coastline for this area. The measured water level and significant wave height (SWH) data used to verify the model are obtained from gauge stations and buoys (Fig.2d). Moreover, the measured data used to verify coastal inundation are obtained from on-site measurements and the National Marine Hazard Mitigation Service.
3 Model Validation
We analyze the waves, water levels, and inundation depths caused by Typhoon Nida (2016) by using the coupled ADCIRC-SWAN model. The track and intensity of Typhoon Nida are shown in Fig.3a. Nida was first identified as a tropical depression at 12:00 UTC on July 29, 2016, originating from the northwestern Pacific Ocean. Nida had a 1002hPa central pressure and was located at 12.2˚N, 127.6˚E. The maximum wind speed and minimum central pressure are shown in Fig.3c. To conveniently interpret the model results, we also calculate the following indices: the absolute error (AE), relative error (RE), root-mean-square error (RMSE), and correlation coefficient (CC) of the maximum data between the measured data and the estimated results. Figs.4a and 4b show the time series of the observed data versus the ADCIRC-SWAN modeled SWHs at buoys FB04 and FB06 near the Pearl River Estuary. The simulated SWH (trend) is consistent with the observed SWH. In Fig.4a, the observed and simulated maximum SWHs are 1.45 and 1.38m at buoy FB04, respectively. In Fig.4b, the observed and simulated maximum SWHs are 0.9 and 0.86m at buoy FB06, re- spectively. The timing and size of the peak values are characterized by a high degree of consistency between the hindcast simulations and the observations. Notably, a slight difference between the model results and the measured results before and after the peak value can be observed because the combined wind-pressure field precisely describes the characteristics of the actual typhoon, which makes the simulation more accurate. Figs.4c and 4d show the time series of the observed versus simulated water levels at the Chiwan and Hengmen gauge stations, respectively. The simulations of the water levels (phase and amplitude) are consistent with the observations. At the Chiwan gauge station, the RMSE and CC of the water level are 0.13m and 0.99, respectively. At the Hengmen gauge station, the RMSE and CC of the water level are 0.15m and 0.98, respectively. The timing and stage of the water level peaks are characterized by a high degree of consistency between the hindcast simulations and the observations. Moreover, according to several indices of wave height (see Table 1), the coupled ADCIRC-SWAN model can precisely reproduce the SWH and water level during a typhoon.
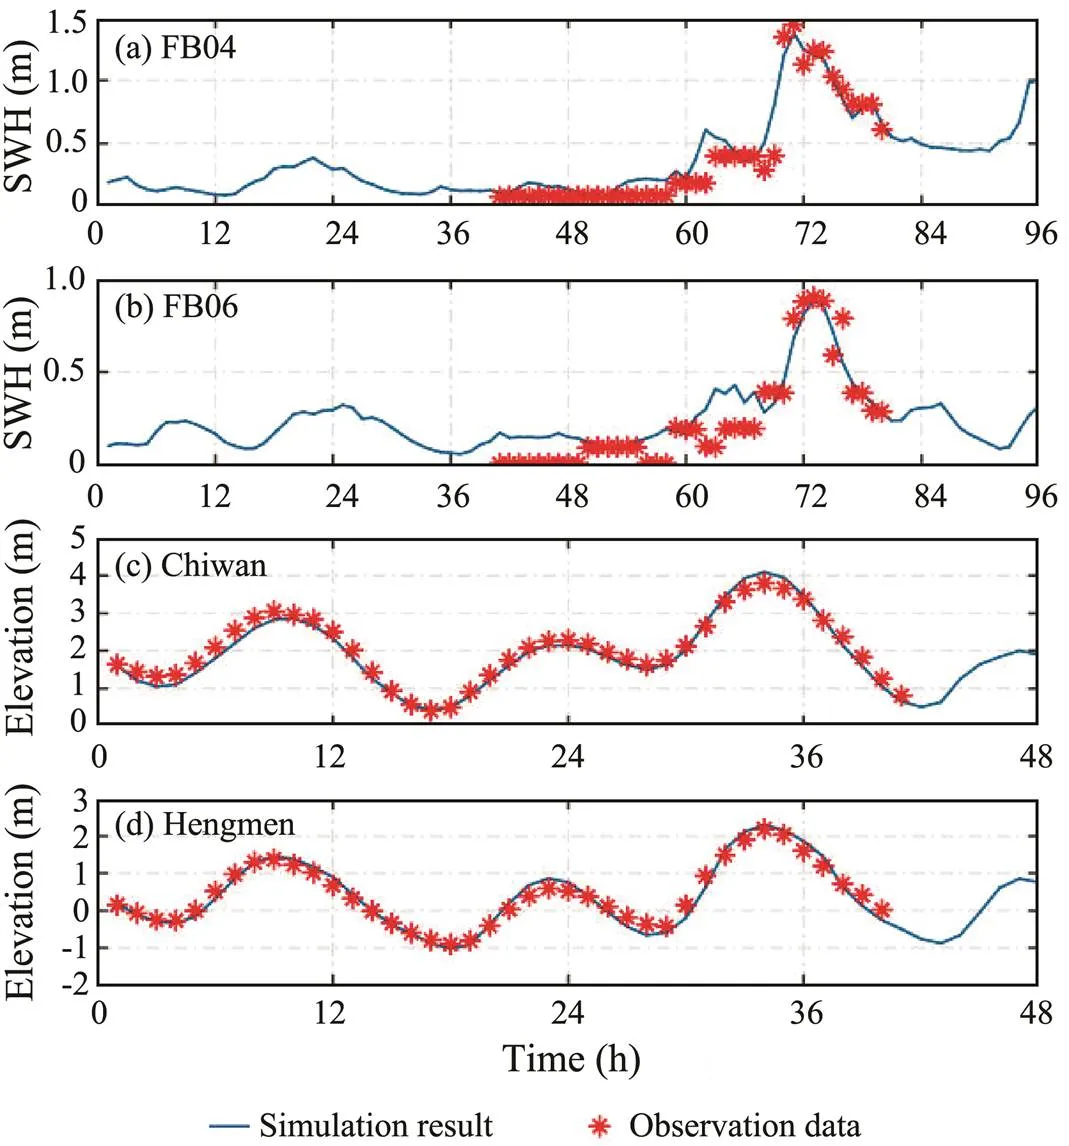
Fig.4 Simulated (blue line) and measured (red asterisk) values of the significant waves (a and b) and water levels (c and d) of Typhoon Nida. In (a) and (b), the coordinate axis of 0h corresponds to 00:00 on July 30, 2016. In (c) and (d), the coordinate axis of 0h corresponds to 16:00 on July 31, 2016.
According to the data records, obvious inundations occurred along the Zhuhai Coast during Typhoon Nida (2016). The Lovers Road Beach Bath in Zhuhai was inundated 65m from the coastline. The viewing platform of the Fisher Girl was inundated 70m from the coastline. The inundation depth reached 1.9m. Fig.5 shows the simulation results of the maximum inundation near Lovers Road (part of the black circle) in Zhuhai City, and the land is indeed inundated. Table 2 shows the difference between the simulated maximum inundation and the actual maximum inundation in Zhuhai. By calculating the data shown in Table 2, the RMSEs of the inundation depth and inundation distance are 0.21 and 12.75m, respectively, and the CC of the simulation and measurement is 0.99. Therefore, the inundation process induced by a typhoon can be feasibly simulated using the model established in this study.
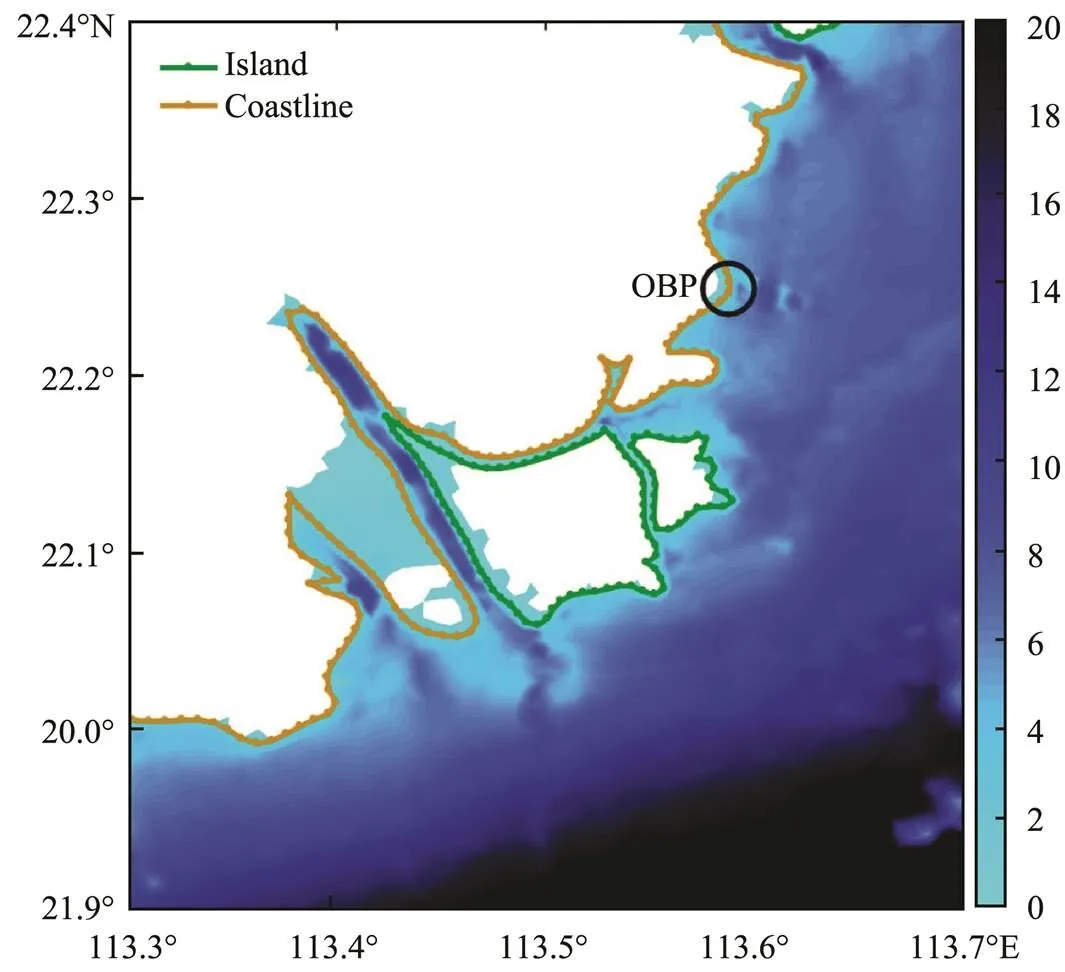
Fig.5 Simulated maximum water level (unit: m; shaded) of Typhoon Nida (2016) at the OBP. The coastal area within the black circle contains the Lovers Road Beach Bath and the viewing platform of the Fisher Girl. The shaded parts on land represent the inundated areas.
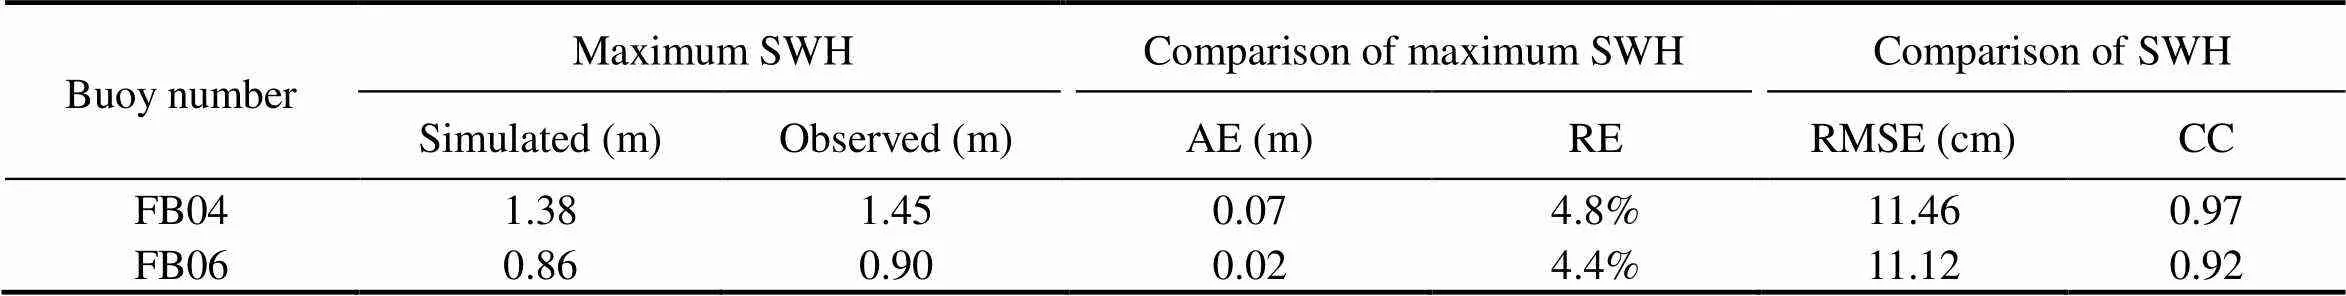
Table 1 Comparison of the observed SWH and the corresponding model results at the buoys during Typhoon Nida (2016)
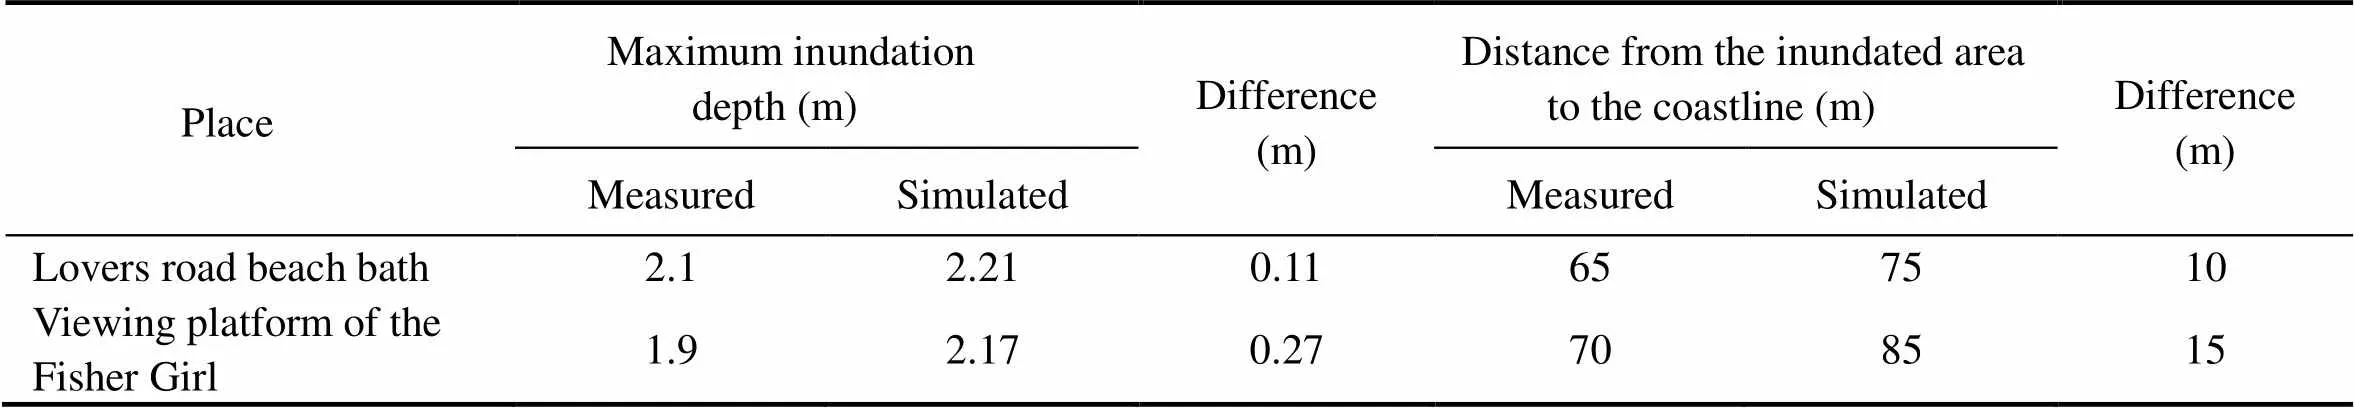
Table 2 Comparison of the inundation measurements and the corresponding model results at the OBP
4 Results and Discussion
4.1 Effect of Reclamation on the Coastal Hydrodynamics
Over the past few decades, the total length of the coastline in some parts of the Pearl River Estuary (Fig.1b) has increased by 236.0643km because of continuous reclamation projects. On the basis of the coastline in 1973 and 1990, two new mesh structures (Fig.6) are constructed for the coupled ADCIRC-SWAN model. Compared with the mesh structure of the coastline in 2018 (Fig.2a), the area of the dry mesh (the mesh to the north of the brown line and the mesh within the green line) in the entire calculation domain increases year by year. In some areas, the dry mesh of the islands and the dry mesh of the mainland have become connected. However, the grids of the simulation model are changed, but the boundaries and other parameters are not changed. This is done to control the variables and enable the simulation to proceed under a validated model. To further analyze the specific effects of reclamation on the SWH, storm surge, and coastal inundation, we simulate Typhoon Nida (2016) in three meshes (Meshes 1, 2, and 3). Nine sampling points (Points 1 to 9) are set up in the sea area around the reclamation area. The positions of the sampling points are marked by black dots in Fig.2d.

Fig.6 An enlarged view of the mesh structures of different coastlines in the Pearl River Estuary: (a) mesh mapped by the coastline in 1973 (also called Mesh 1) and (b) mesh mapped by the coastline in 1990 (also called Mesh 2).
4.1.1 Effect of reclamation on the wave height
On the basis of the simulation results, we extract the SWHs of nine sampling points (marked by black dots in Fig.2d) in the three meshes to plot the time series of the SWHs. Fig.7 shows the SWHs in 24h of the nine sampling points during landfall of Typhoon Nida (2016) in Guangzhou City. The SWH at each point significantly differ in the three meshes. As the number of reclamation projects increases, the SWH of each point decreases. For example, the SWHs of Point 1 in Meshes 2 and 3 are lower than those in Mesh 1, but the maximum reduction is <0.5m. This finding indicates that land reclamation reduces the SWH in the nearby sea area. However, the SWHs of Mesh 3 compared with those of Mesh 1 decrease on average by 0.1m (<8%) during the typhoon process. Therefore, the decrease in SWHs has only a slight effect on the reduction of inundation in this area because of the small degree of reduction and limited influence range.
4.1.2 Effect of reclamation on the current velocity
Fig.8 shows the current velocity (vectors) of the nine sampling points during landfall of Typhoon Nida (2016) in Guangzhou City. For example, the direction and size of the velocity at Point 1 are different at the same time in Meshes 1, 2, and 3 (the same applies to Points 2 and 9). The comparison of these nine sampling points shows that the velocities of Points 4 to 9 are the most affected by the reclamation projects. As the extent of reclamation increases, the size of the velocities at most points increases. Notably, the maximum velocity of Mesh 3 compared with that of Mesh 1 increase by 0.18ms−1(>50%) during the typhoon process. Therefore, the coastline changes caused by reclamation have a significant effect on the current velocity.
4.1.3 Effect of reclamation on the storm surge
According to the model results, the simulated storm surges of nine sampling points were extracted by subtracting the simulated astronomical tide (running the coupled ADCIRC-SWAN model without the combined wind-pressure field) from the simulated water level. Fig.9 shows the time series of the storm surges in 24h of the nine sampling points during landfall of Typhoon Nida (2016) in Guangzhou City. In subfigure 1 of Fig.9, the storm surge at Point 1 of Mesh 3 is significantly higher than that at Point 1 of Mesh 1 or 2 (the same applies to Points 2 to 6). In Mesh 1, the water level at Point 1 decreased (, the height of the storm surge was <0m) between 12:00 and 24:00 UTC on August 1, 2016. However, this process is weakened in Meshes 2 and 3, particularly Mesh 3 (the same applies to Points 2 to 6). In subfigures 7 to 9 of Fig.9, the storm surges at Points 7 to 9 are low. However, the storm surges at Points 7 to 9 of Mesh 3 are significantly higher than that of Meshes 1 and 2. Therefore, the following conclusions can be drawn: 1) the existence of the reclaimed island to the west of Points 1, 2, and 3 aggravates the storm surges at these points; 2) the reclaimed peninsula and the reclaimed island narrow the waterways surrounding Points 4 to 6 and aggravate the storm surges at these points; and 3) the storm surge in Mesh 3 occurs earlier than that in Mesh 1 or 2 because the water levels do not decrease but increase before storm surges. Table 3 lists the maximum storm surges in 24h of the sampling points in the three meshes. The maximum storm surges in Mesh 2 or 3 are higher than those in Mesh 1, and the maximum increase is 0.53m. Notably, the comparison value between Meshes 3 and 1 is significantly greater than that between Meshes 2 and 1. Overall, in unreclaimed land around the sampling points, the storm surges are low. However, during Typhoon Nida (2016), the storm surges were aggravated at sampling points in reclaimed land. These findings indicate that reclamation projects do increase the risk of storm surges at their surroundings.
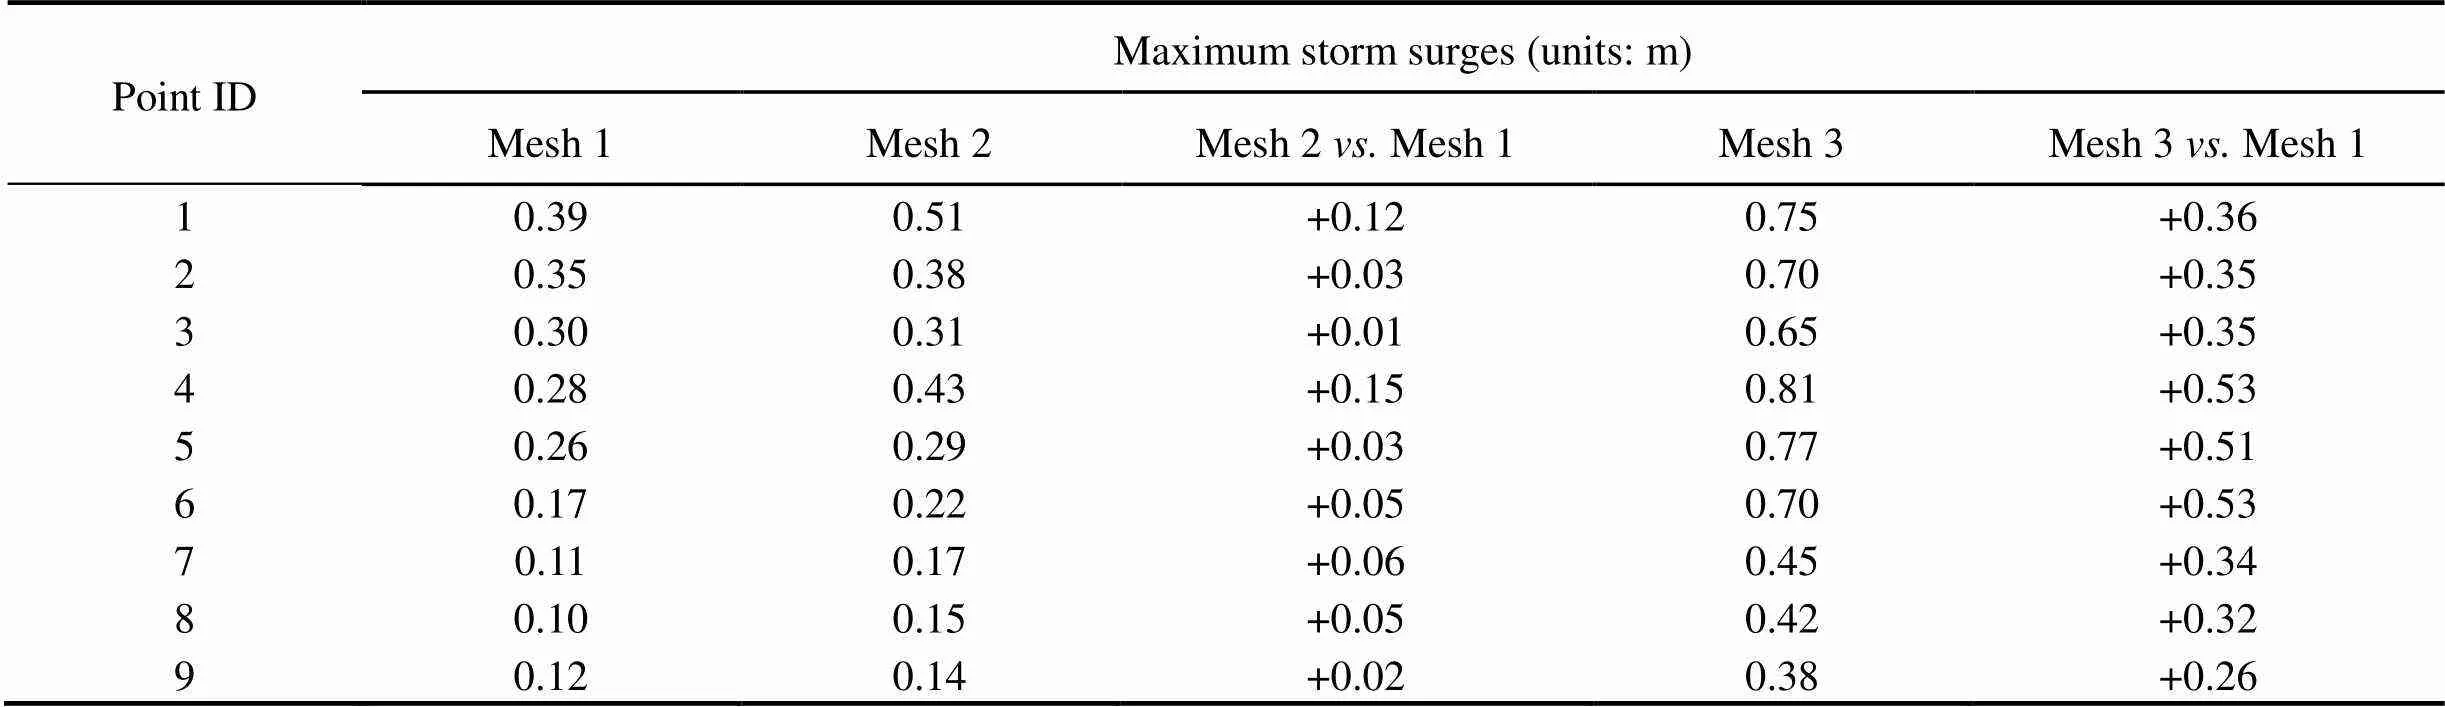
Table 3 Simulation results of the maximum storm surges of nine sampling points in Meshes 1, 2, and 3 caused by Typhoon Nida (2016)
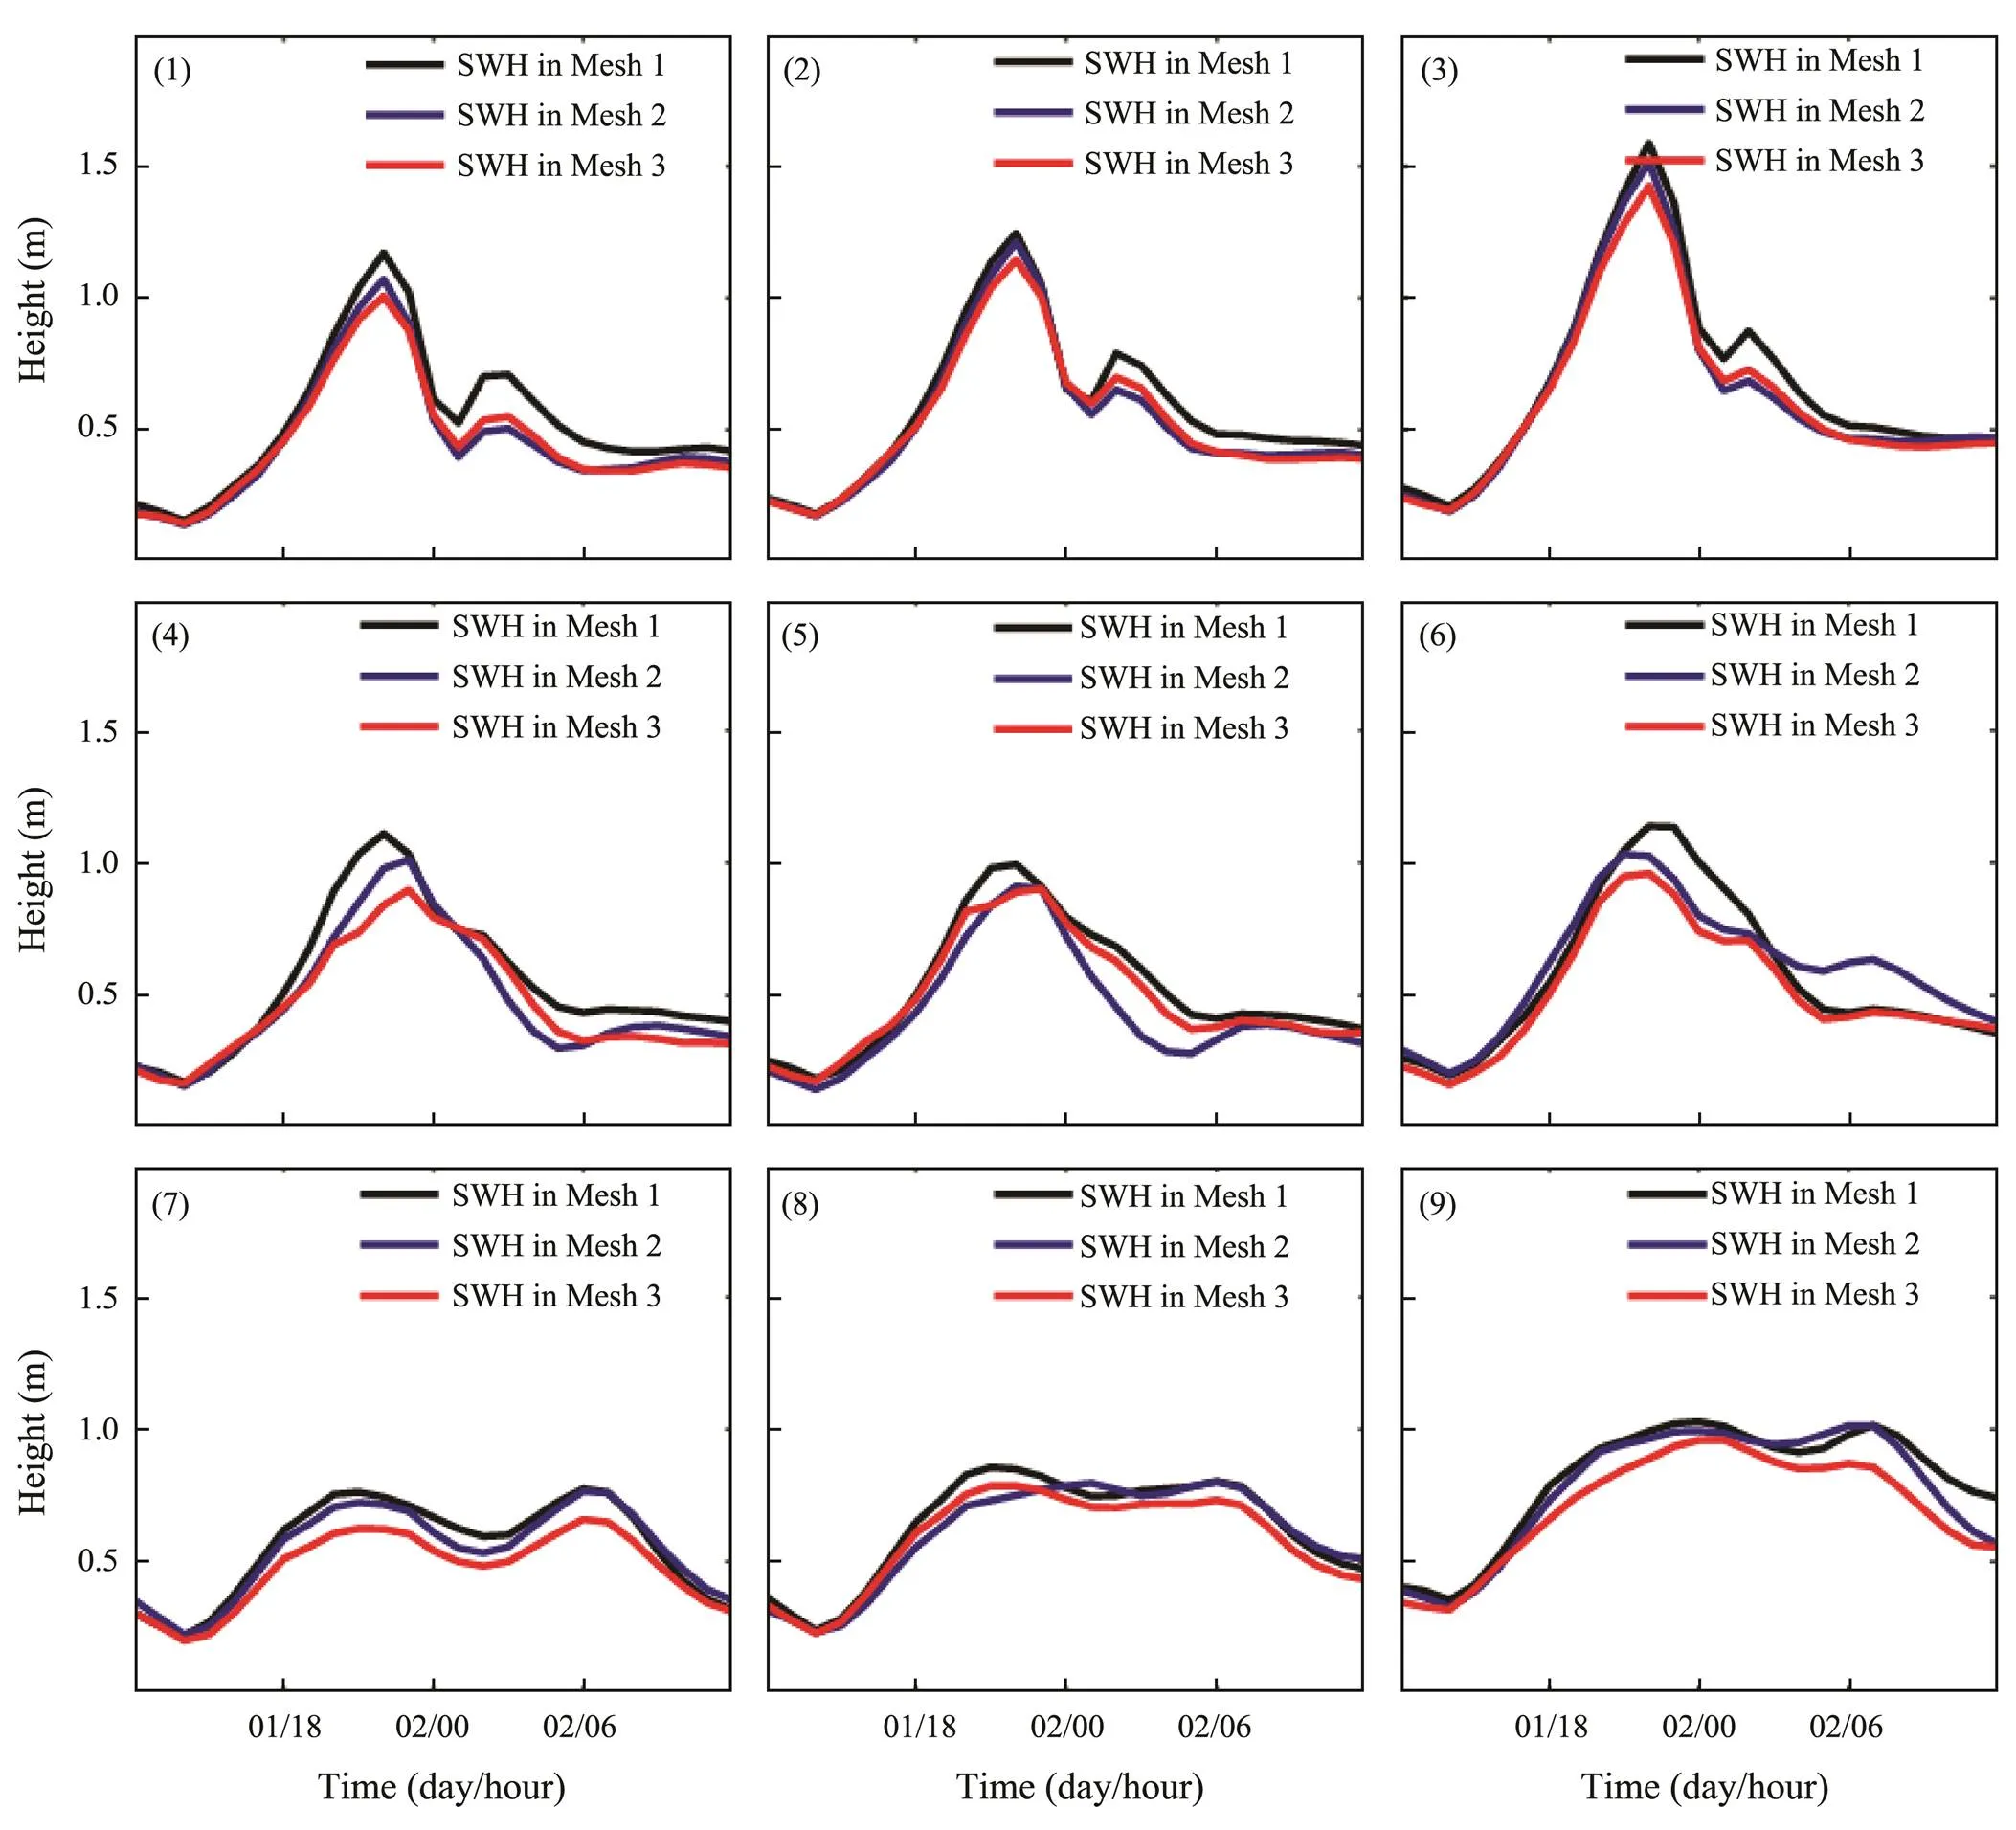
Fig.7 Time series of the simulated SWHs (unit: m) of nine sampling points. The coordinate axis corresponds to August 2016. Subfigures 1 to 9 depict the SWHs of sampling points 1 to 9, respectively.

Fig.8 Time series of the simulated current velocity (unit: ms−1; vectors) of nine sampling points. Subfigures 1 to 9 depict the current velocities of sampling points 1 to 9, respectively.
4.1.4 Effect of reclamation on the coastal inundation
Fig.10 shows the simulated coastal inundations during Typhoon Nida (2016) in three meshes (Meshes 1, 2, and 3). The inundated area of Mesh 1 is 46.56km2, which is the smallest among the three meshes. The inundated lands are concentrated in the estuary area. By contrast, the inundated area of Mesh 3 is 338.62km2, which is the largest among the three meshes. In Mesh 3, the reclamation areas in Jinwan District of Zhuhai City and Nansha District of Guangzhou City (marked in Fig.1b) are inundated, and the maximum depth of inundation is 2.70m (Table 4). In other words, the inundations mostly occurred in the reclamation area, which was formed after 1973, or its surroundings. According to the simulation results, if Ty-phoon Nida occurred in 2018 (in 1990), the inundated area will increase by 292.06km2(119.35km2) compared with that in 1973 (see Table 4). Thus, the coastal inundation in Mesh 2 or 3 is more serious than that in Mesh 1 because of the reclaimed land. From Fig.10 and Table 4, the following conclusions can be drawn: 1) the reclamation project narrows the estuary on the west side of Nansha District, Guangzhou City and enables the formation of a new peninsula, which makes the coastal inundations in this area the most severe; 2) the reclamation projects on the coast of Guangzhou City and Dongguan City narrow the width of the Pearl River Estuary and aggravate the inundation along the western coast of Dongguan City; and 3) the low elevation of artificial land and the increase in storm surges around the newly formed peninsula and bay aggravate the coastal inundation along the southern coast of Jinwan District, Zhuhai City. These findings indicate that reclamation projects do change the distribution and depth of coastal inundations and increase the risk of coastal inundations.
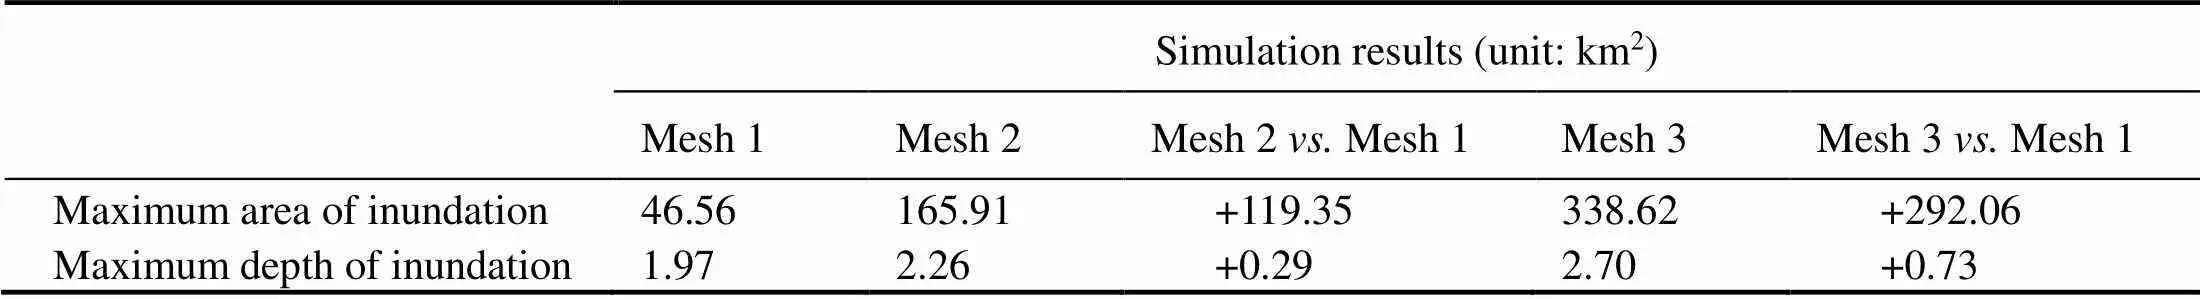
Table 4 Simulation results of the maximum inundated area and maximum inundated depth in Meshes 1, 2, and 3 caused by Typhoon Nida (2016)
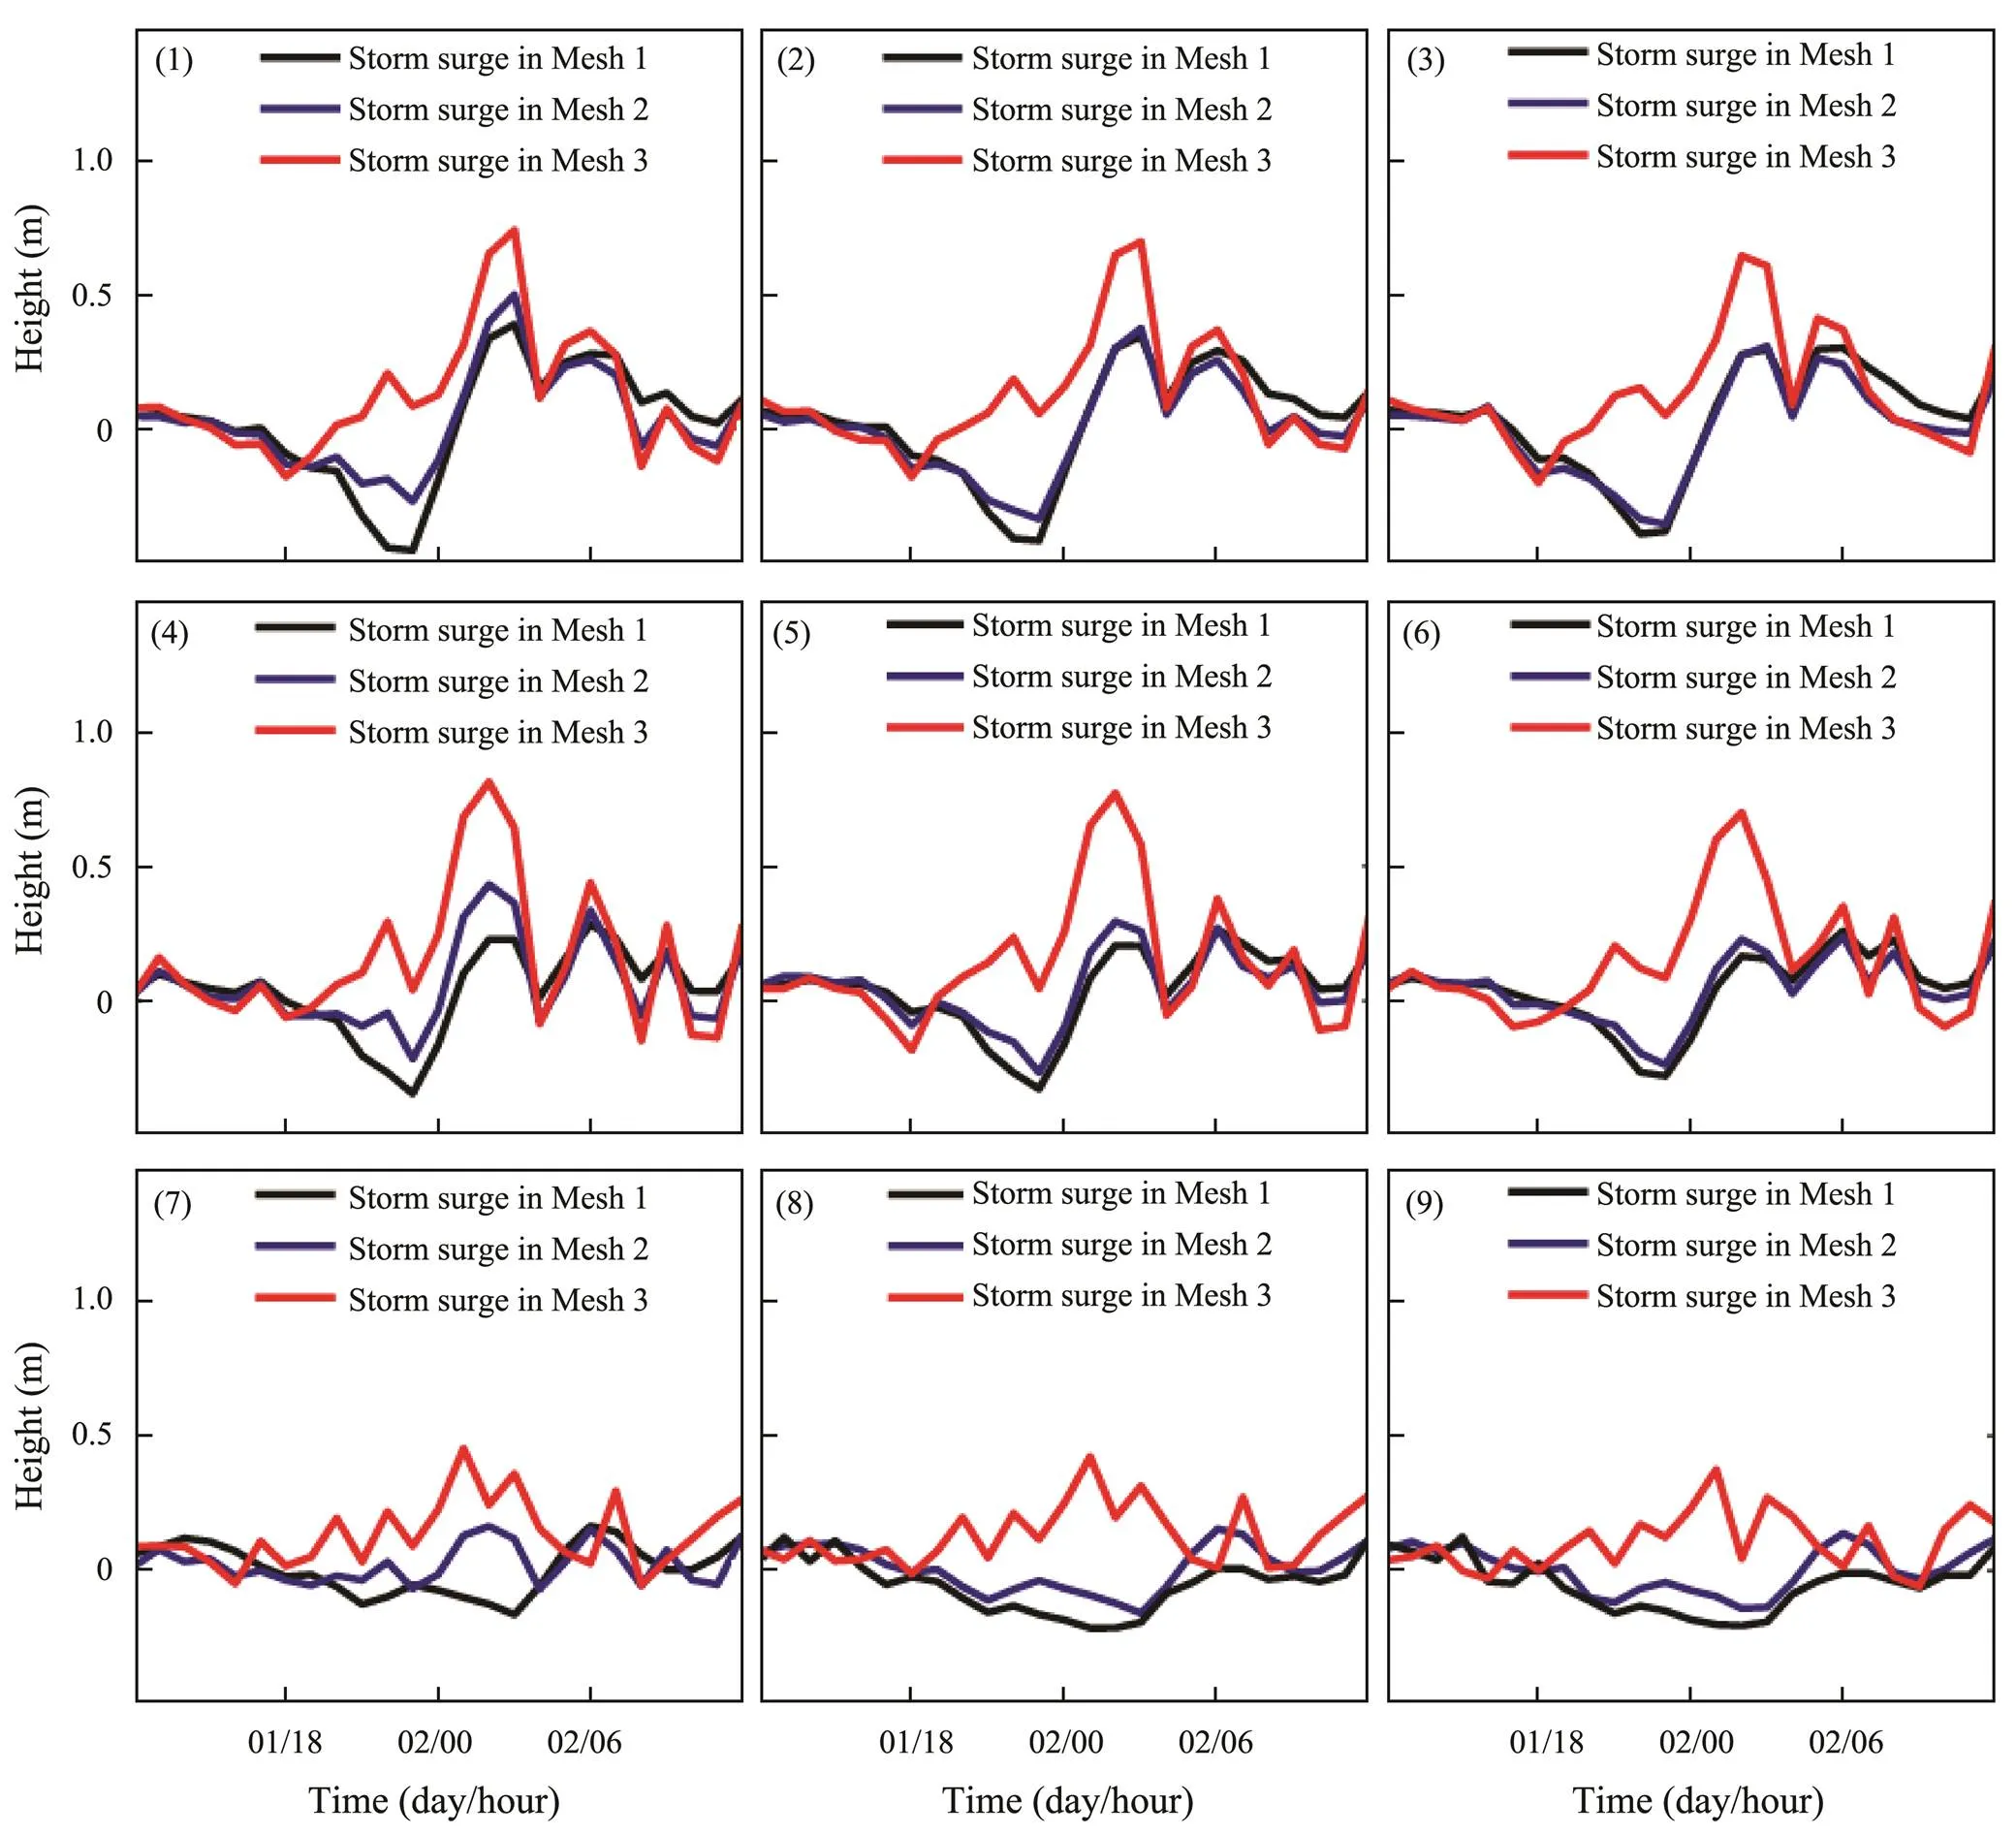
Fig.9 Time series of the simulated storm surges (units: m) of nine sampling points. The coordinate axis corresponds to August 2016. Subfigures 1 to 9 depict the storm surges of sampling points 1 to 9, respectively.
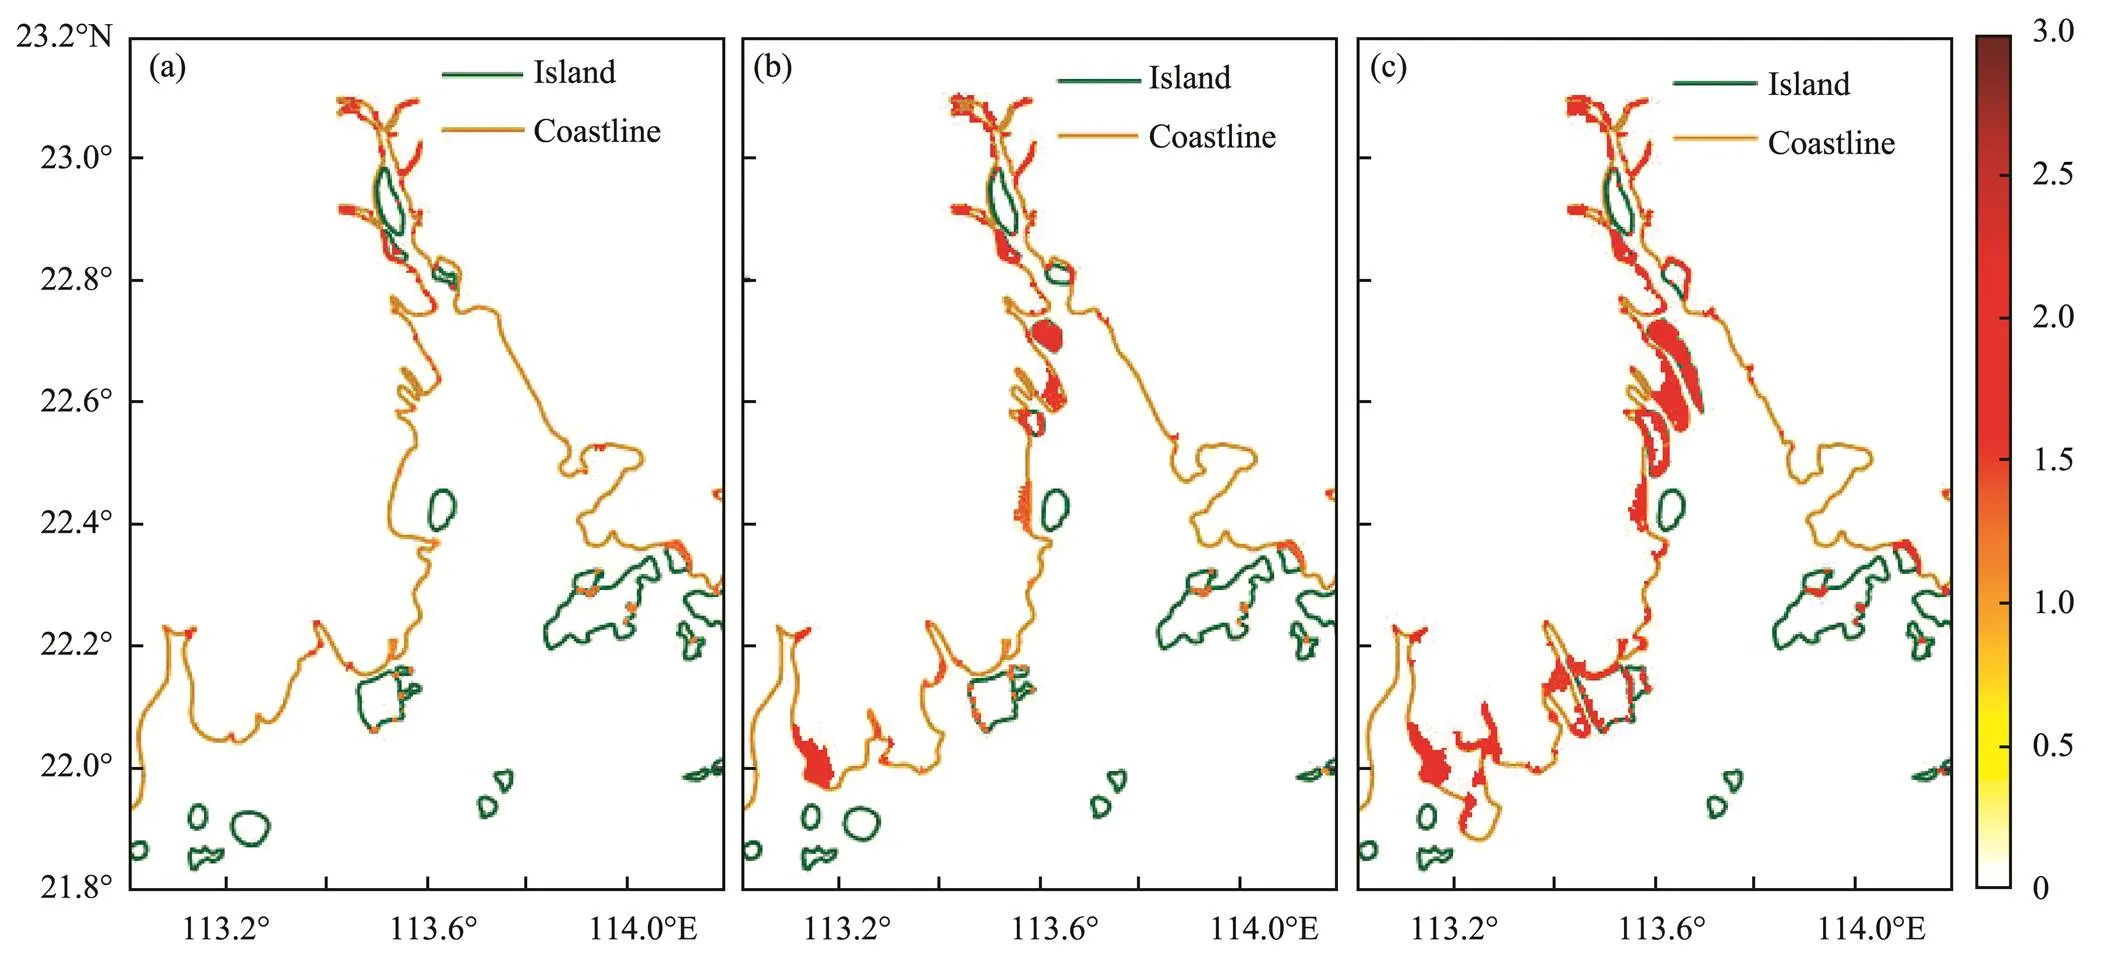
Fig.10 Maximum inundation (unit: m; shaded) within the different mesh structures. The maximum inundations are determined from the simulation results of the coastal inundation caused by Typhoon Nida (2016). The shaded parts in (a), (b), and (c) show only the inundated area on land, but not the water depth of the ocean.
According to the simulated inundations caused by Typhoon Nida, we did the following: 1) the simulation results of the maximum SWH, maximum current velocity, maximum storm surge, and maximum inundation depth were extracted at every point in Meshes 1, 2, and 3 and 2) the differences in the values of the maximum SWH, maxi- mum current velocity, maximum storm surge, and maximum inundation depth in Meshes 1 and 3 were calculated. The CC of the calculated maximum SWH difference and the maximum inundation depth difference is −0.0021. The CC of the calculated maximum current velocity difference and the maximum inundation depth difference is 0.5315. The CC of the calculated maximum storm surge difference and the maximum inundation depth difference is 0.9424. These values indicate that the increase in current velocity and storm surge aggravates the possibility of coastal inundation. The variation in SWH in the reclamation area has almost no effect on inundation.
4.2 Calculation of Storm Surge Extreme Inundation Events
We use the coupled ADCIRC-SWAN model to simulate 43 different tropical cyclones (Fig.11) in the Pearl River Estuary from 1998 to 2018. Because some of the inundation processes occurred in the same year, we compare the maximum inundations in different processes in the same year to determine the maximum value of the annual extreme inundation. Thus, we identify 20 extreme inundation events, which we use to calculate the return period of the inundation. We use the Gumbel and Weibull distributions and the annual extreme value method to analyze the long-term inundation data. The results of the two distributions were combined to ensure that all of the points in mesh pass the confidence test. Finally, the 10-year, 50-year, 100-year, and 200-year return inundation depths were obtained (Fig.12). The inundations mostly occurred in the western part of the Pearl River Estuary,, in Jinwan District of Zhuhai City, in Nansha District of Guangzhou City, and along the coast of Zhongshan City. For the distribution of each return period, the area and depth of inundation in the reclamation area are larger than those of the other regions. For example, the 100-year return maximum possible inundation is 4.7m in Nansha District of Guangzhou City, 4.8m along the western coast of Dongguan City, 4.0m in Jinwan District of Zhuhai City, and only 2.0m in Shenzhen City. Reclamation leads to an increase in storm surges along the coast; thus, the possibility of coastal inundation is increased. Moreover, the elevation of the reclamation area is lower than that of normal land, which makes these areas vulnerable to coastal inundation. Overall, the possibility of coastal inundation in the reclamation area after 1973 is greater than that in other areas of the Pearl River Estuary.
4.3 Hazard Grade Distribution
Hazard analysis was conducted on the basis of 43 inundation events from 1998 to 2018. We set 1m as the threshold for coastal inundation disasters in the Pearl River Estuary. The probability of the inundation depth exceeding the thresholds of the different inundations is summarized in Fig.13a. The probabilities of inundation in most areas in Nansha District of Guangzhou City, Jinwan District of Zhuhai City, and the western coast of Dongguan City are >20%. In other words, these areas are more likely to be inundated. The probability of the inundation depth exceeding the threshold increases in areas with high amounts of reclamation (newly formed peninsulas, narrow waterways, and narrow river estuaries).
We rank the inundations into five grades according to the probability of the inundation depth exceeding 1m. Level V corresponds to a probability of <20%; Level IV corresponds to a probability of between 20% and 40%; Level III corresponds to a probability of between 40% and 60%; Level II corresponds to a probability of between 60% and 80%; and Level I corresponds to a probability of >80%. The distribution of the inundation risk level in the Pearl River Estuary is shown in Fig.13b, and its distribution characteristics are similar to those in Fig.13a. The coastal areas of Nansha District and the western coast of Dongguan City are Level I. Most of the southern coast of Jinwan District and the eastern coast of Zhongshan City are Level II. The distribution characteristics of the hazards in the Pearl River Estuary show that the risk level in the reclamation area is higher than that in other areas. Moreover, the closer to the coast, the greater the hazard. We propose that effective protective measures be implemented for the artificial coastlines constructed in the late 1980s to reduce the losses caused by destructive inundations.
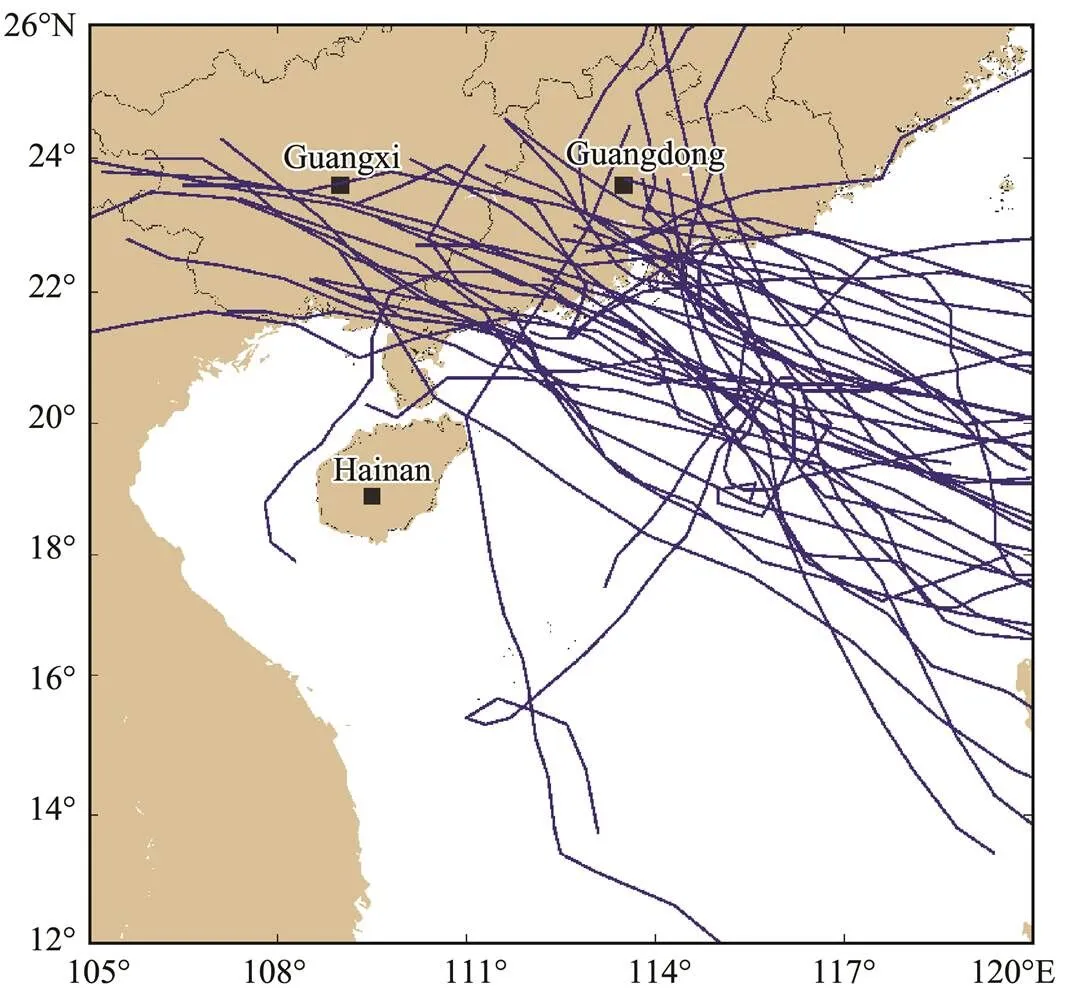
Fig.11 Tracks (blue lines) of 43 tropical cyclones from 1998 to 2018.
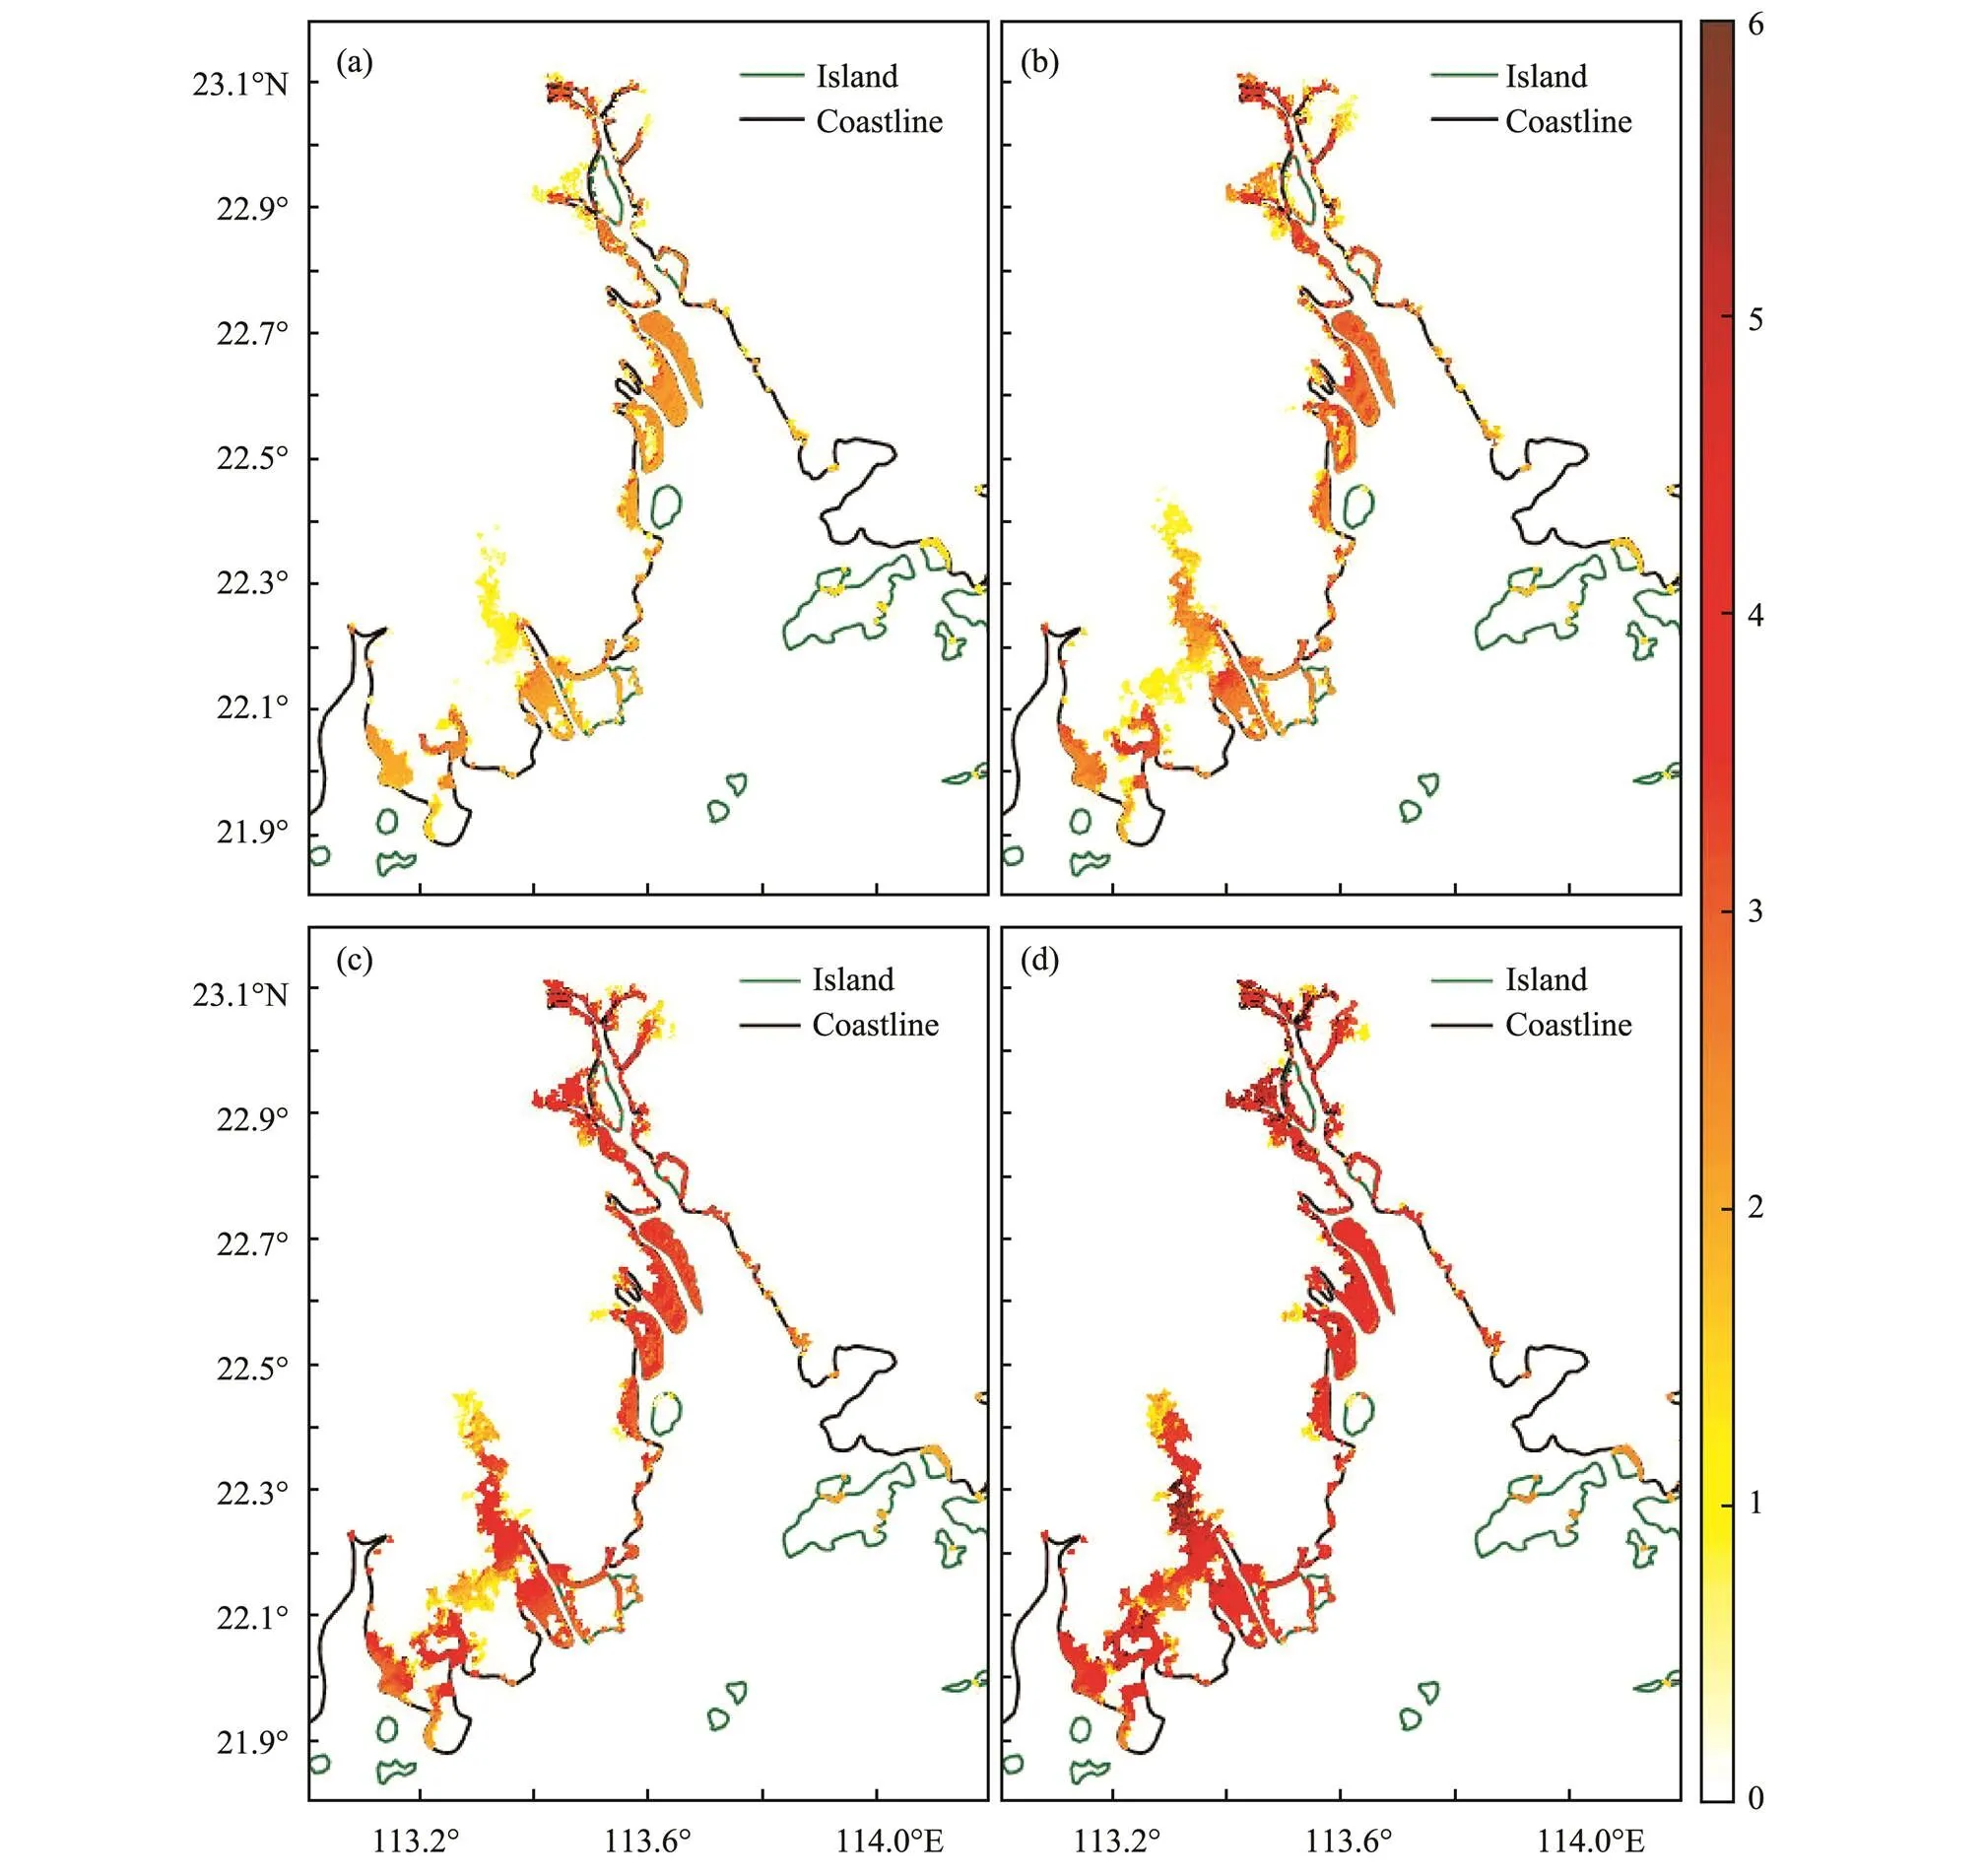
Fig.12 Distribution of the 10-year (a), 50-year (b), 100-year (c), and 200-year (d) return coastal inundations (unit: m; shaded). The shaded parts in (a), (b), (c), and (d) show only the inundated area on land, but not the water depth of the ocean.
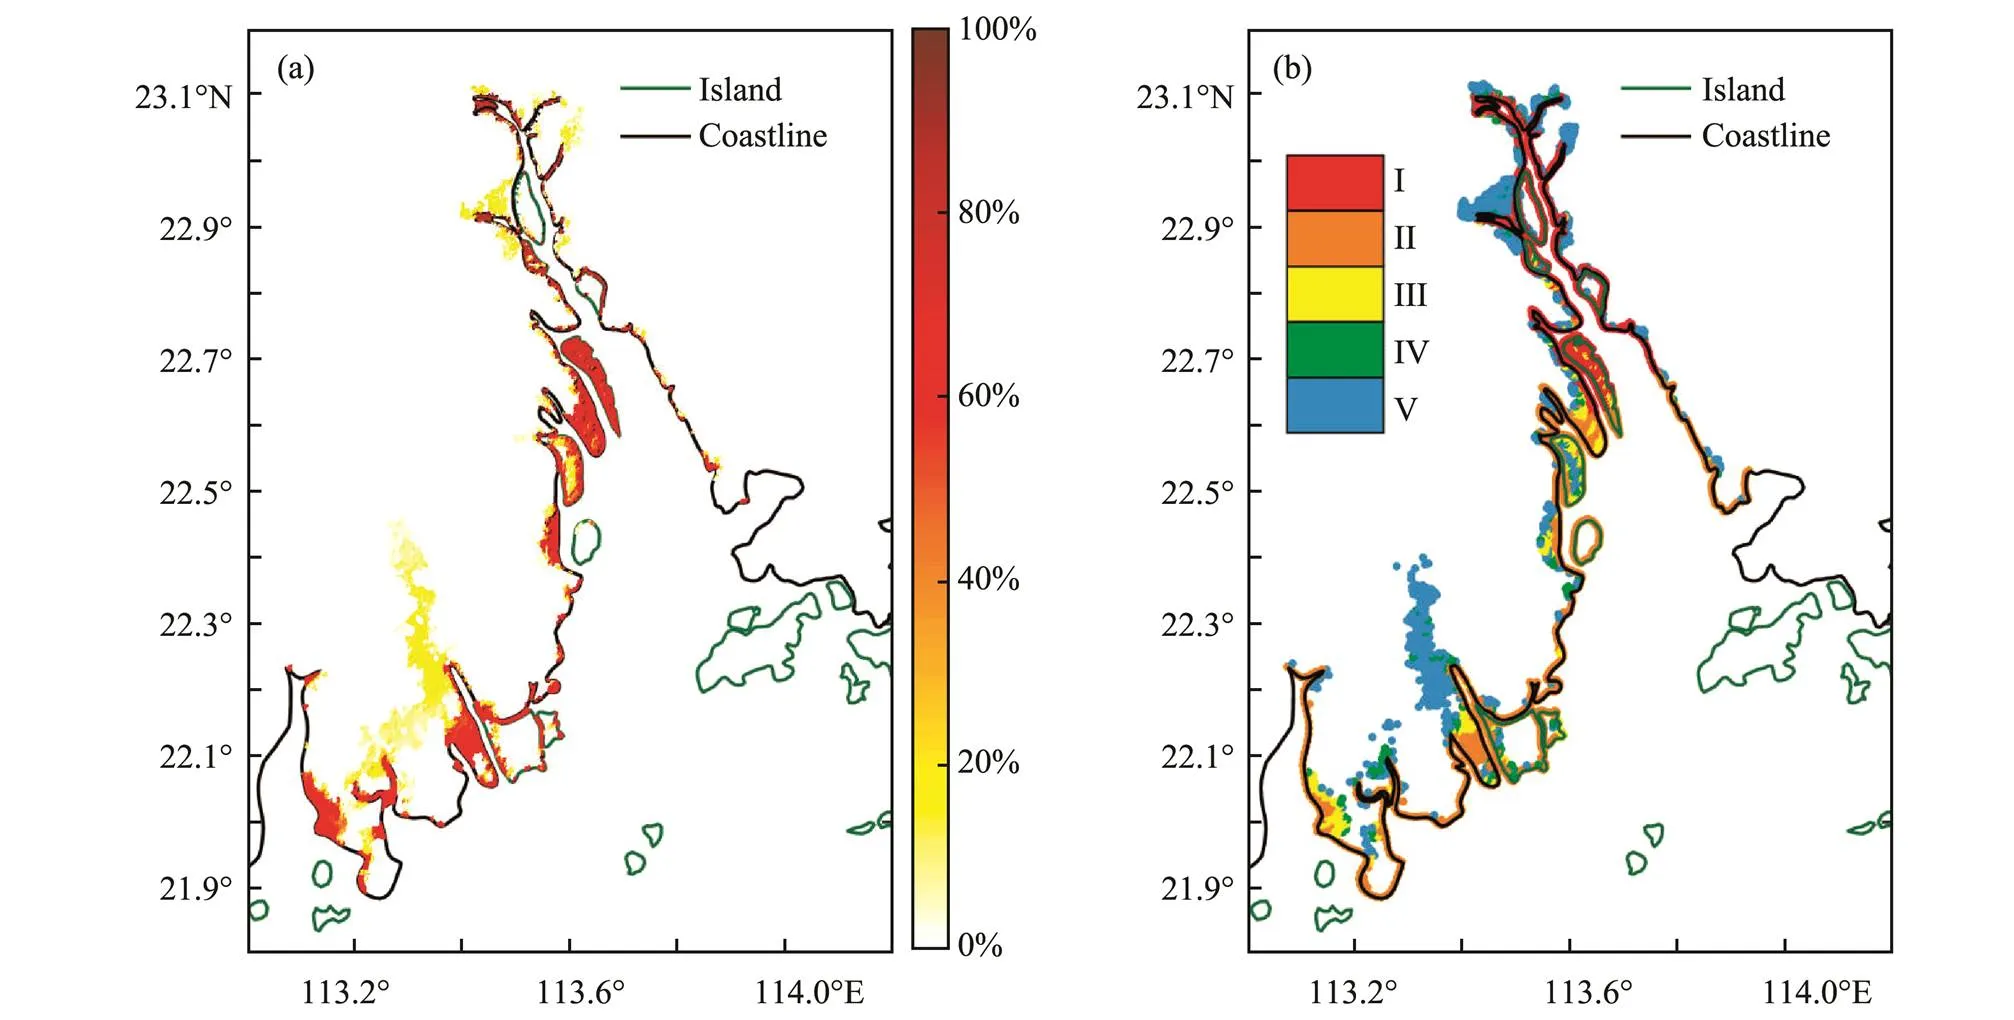
Fig.13 Hazard grade distribution in the Pearl River Estuary: (a) the probability of the inundation depth exceeding 1m and (b) the grade distribution.
5 Conclusions
In this study, a regional-scale coastal inundation model with an unstructured mesh was developed in the reclamation area using the coupled ADCIRC-SWAN model. The combined wind-pressure field provided by the assimilation wind-pressure model was selected to drive the coupled ADCIRC-SWAN model. The simulation of Typhoon Nida shows that the coupled ADCIRC-SWAN model precisely simulates the SWH, water level, and coastal inundation.
On the basis of the coastlines in 1973 and 1990, we establish Meshes 1 and 2. Using Typhoon Nida as an example, we investigate the effects of coastline changes on the SWH, current velocity, storm surge, and coastal inundation. Our conclusions are summarized as follows:
1) The reclamation projects induce storm surges to occur earlier, and the water-level reduction process before landfall of the typhoon no longer exists. These serious storm surges aggravate the inundations along the reclamation areas.
2) The reclamation project narrows the estuary on the west side of Nansha District, Guangzhou City and enables the formation of a new peninsula, which makes the coastal inundations in this area the most severe.
3) The low elevation of artificial land and the increase in the current velocity and storm surge around the newly formed peninsula and bay aggravate the coastal inundation along the southern coast of Jinwan District, Zhuhai City.
4) The reclamation projects on both sides of the river narrow the estuary, which decreases the wave height, with small degree of reduction, but increases the current velocity and storm surge. Moreover, the reclamation projects aggravate the inundation along the western coast of Dongguan City.
Moreover, using the coupled ADCIRC-SWAN model established in this study, the 43 inundations that affected the Pearl River Estuary from 1998 to 2018 were simulated using an unstructured mesh constructed for the 2018 coastline. The Gumbel and Weibull distributions were used to fit the sample extremum at all of the points in the mesh, and the 10-year, 50-year, 100-year, and 200-year return inundation depths were calculated. The results indicate that the possibility of coastal inundation in the reclamation area after 1973 is greater than that in other areas of the Pearl River Estuary. This difference is mainly due to the low topography of the reclamation area and the increase in storm surges in the areas surrounding the reclamation area. Using statistical methods, five hazard levels for inundations in the Pearl River Estuary were defined, with Level I being the highest. The results show that the areas with the highest hazard level are mainly located on both sides of narrow river estuaries, followed by narrow waterways along the coast and newly formed peninsulas. The closer the area to the coast, the greater the risk of inundation. On the basis of the hazard grade distribution, the relevant departments should strengthen the construction of the coastal inundation prevention system along the Pearl River Estuary, particularly in the Nansha District of Guangzhou City and the Jinwan District of Zhuhai City. The heights of the breakwaters and the submerged breakwaters should be set according to the return inundation results shown in Fig.12.
In summary, reclamation has changed the distribution and intensity of coastal inundations by changing the distribution of the land and sea areas in the Pearl River Estuary, making the Nansha District of Guangzhou City, the western coast of Dongguan City, and the Jinwan District of Zhuhai City more prone to inundation than other areas. Therefore, coastal cities along the Pearl River Estuary should improve the accuracy of coastal inundation forecasting and strengthen preventive measures to reduce the risk of destructive inundation. In the planning of reclamation projects in the coastal areas of the Pearl River Estuary, the inundation risk level should be considered, and effective facilities for inundation control and discharge should be built.
Acknowledgements
Data listed in Section 2 are available from the public platforms. The authors are thankful to those public platforms for providing the data. This work is supported by the National Key Research and Development Program of China (No. 2016YFC1402000). The numerical work is supported by the High-Performance Computing Center, Institution of Oceanology, CAS.
Bhaskaran, P. K., Gayathri, R., Murty, P. L. N., Bonthu, S. R., and Sen, D., 2014. A numerical study of coastal inundation and its validation for thane cyclone in the Bay of Bengal.,83: 108-118.
Bilskie, M. V., Hagen, S. C., Alizad, K., Medeiros, S. C., Passeri, D. L., Needham, H. F., and Cox, A., 2016a. Dynamic simulation and numerical analysis of hurricane storm surge under sea level rise with geomorphologic changes along the northern Gulf of Mexico., 4 (5): 177-193.
Bilskie, M. V., Hagen, S. C., Medeiros, S. C., Cox, A. T., Salisbury, M., and Coggin, D., 2016b. Data and numerical analysis of astronomic tides, wind-waves, and hurricane storm surge along the northern Gulf of Mexico., 121 (5): 3625-3658.
Booij, N., Ris, R., and Holthuijsen, L., 1999. A third-generation wave model for coastal regions: 1: Model description and validation., 104: 7649-7666.
Carr, L. E., and Elsberry, R. L., 1997. Models of tropical cyclone wind distribution and beta-effect propagation for application to tropical cyclone track forecasting., 125 (12): 3190-3209.
Choi, B. H., Min, B. I., Kim, K. O., and Yuk, J. H., 2013. Wave-tide-surge coupled simulation for Typhoon Maemi.,27 (2): 141-158.
Dietrich, J. C., Bunya, S., Westerink, J. J., Ebersole, B. A., Smith, J. M., Atkinson, J. H., Resio, D. T., Luettich, R. A., Dawson, C., Cardone, V. J., Cox, A. T., Powell, M. D., Westerink, H. J., and Roberts, H. J., 2010. A high-resolution coupled riverine flow, tide, wind, wind wave, and storm surge model for southern Louisiana and Mississippi. Part II: Synoptic description and analysis of Hurricanes Katrina and Rita., 138 (2): 378-404.
Ding, Y., and Wei, H., 2016. Modeling the impact of land reclamation on storm surges in Bohai Sea, China., 85: 1-15.
Feng, X., Yin, B., and Yang, D., 2012. Effect of hurricane paths on storm surge response at Tianjin, China.,106: 58-68.
Feng, X., Yin, B., Yang, D., and William, P., 2011. The effect of wave-induced radiation stress on storm surge during Typhoon Saomai (2006).,30 (3): 20-26.
Hallegatte, S., Green, C., Nicholls, R. J., and Corfee-Morlot, J., 2013. Future flood losses in major coastal cities.,3 (9): 802-806.
Holland, G., 1980. An analytic model of the wind and pressure profiles in hurricanes., 108 (8): 1212-1218.
Jones, J. E., and Davies, A. M., 2009. Storm surge computations in estuarine and near-coastal regions: The Mersey estuary and Irish Sea area.,59 (6): 1061-1076.
Kang, L., Ma, L., and Liu, Y., 2016. Evaluation of farmland losses from sea level rise and storm surges in the Pearl River Delta region under global climate change.,26 (4): 439-456.
Kerr, P., Martyr, R., Donahue, A., Hope, M. E., Westerink, J. J., Luettich, R. A., Kennedy, A. B., Dietrich, J. C., Dawson, C., and Westerink, H. J., 2013. US IOOS coastal and ocean modeling testbed: Evaluation of tide, wave, and hurricane surge response sensitivities to mesh resolution and friction in the Gulf of Mexico., 118 (9): 4633-4661.
Li, X., and Damen, M. C., 2010. Coastline change detection with satellite remote sensing for environmental management of the Pearl River Estuary, China., 82: S54-S61.
Lin, N., Emanuel, K. A., Smith, J. A., and Vanmarcke, E., 2010. Risk assessment of hurricane storm surge for New York City., 115 (D18): D18121.
Lin, N., Smith, J. A., Villarini, G., Marchok, T. P., and Baeck, M. L., 2009. Modeling extreme rainfall, winds, and surge from hurricane Isabel (2003).,25 (5): 1342-1361.
Luettich, R., and Westerink, J., 2007. A parallel advanced circulation model for oceanic coastal and estuarine waters., available at http://www.adcirc.org.
Passeri, D. L., Hagen, S. C., Bilskie, M. V., and Medeiros, S. C., 2015. On the significance of incorporating shoreline changes for evaluating coastal hydrodynamics under sea level rise scenarios., 75 (2): 1599-1617.
Ris, R., Booij, N., and Holthuijsen, L., 1999. A third-generation wave model for coastal regions, 2. Verification.,104: 7667-7681.
Saha, S.,, 2010. NCEP climate forecast system reanalysis (CFSR) selected hourly time-series products. Research data archive at the National Center for Atmospheric Research, Com- putational and Information Systems Laboratory, https://doi.org/10.5065/D6513W89.
Saha, S.,, 2011. NCEP Climate Forecast System Version 2 (CFSv2) Selected Hourly Time-Series Products. Research data archive at the National Center for Atmospheric Research, Computational and Information Systems Laboratory. https://doi.org/10.5065/D6N877VB.
Shen, Y., Jia, H., Li, C., and Tang, J., 2018. Numerical simulation of saltwater intrusion and storm surge effects of reclamation in Pearl River Estuary, China., 79: 101-112.
Sheng, Y. P., Zhang, Y., and Paramygin, V. A., 2010. Simulation of storm surge, wave, and coastal inundation in the northeastern Gulf of Mexico region during Hurricane Ivan in 2004.,35 (4): 314-331.
Solomon, S. M., 2005. Spatial and temporal variability of shoreline change in the Beaufort-Mackenzie region, Northwest Territories, Canada., 25 (2-3): 127-137.
Suh, S. W., Lee, H. Y., and Kim, H. J., 2014. Spatio-temporal variability of tidal asymmetry due to multiple coastal constructions along the west coast of Korea., 151: 336-346.
Tomiczek, T., Kennedy, A., Zhang, Y., Owensby, M., Hope, M. E., Lin, N., and Flory, A., 2017. Hurricane damage classification methodology and fragility functions derived from Hurricane Sandy’s effects in coastal New Jersey., 143 (5): 04017027.
Wang, X. Z., Zhang, H. G., Fu, B., and Shi, A., 2013. Analysis on the coastline change and erosion-accretion evolution of the Pearl River Estuary, China, based on remote-sensing images and nautical charts., 7 (1): 073519.
Wang, Y., Mao, X., and Jiang, W., 2018. Long-term hazard analysis of destructive storm surges using the Adcirc-Swan model: A case study of Bohai Sea, China., 73: 52-62.
Weng, Q., 2002. Land use change analysis in the Zhujiang Delta of China using satellite remote sensing, GIS and Stochastic Modelling., 64 (3): 273-284.
Westerink, J. J., Luettich, R. A., Blain, C. A., and Scheffner, N. W., 2006. ADCIRC: An advanced three-dimensional circulation model for shelves, coasts, and estuaries. Report 2: User’s manual for ADCIRC-2DDI., 76 (6): 721-723.
Willoughby, H. E., and Rahn, M. E., 2004. Parametric representation of the primary hurricane vortex. Part I: Observations and evaluation of the Holland (1980) Model., 132 (12): 3033-3048.
Wu, Y., Li, X., Ma, Y., and Bao, Y., 2015. Numerical simulation and statistical analysis of typhoon storm surge in coastal area of Shandong Province., 24 (3): 169-176 (in Chinese with English abstract).
Yin, J., Lin, N., and Yu, D., 2016. Coupled modeling of storm surge and coastal inundation: A case study in New York City during Hurricane Sandy., 52: 8685-8699.
Ying, M., Zhang, W., Yu, H., Lu, X., Feng, J., Fan, Y., Zhu, Y., and Chen, D., 2014. An overview of the china meteorological administration tropical cyclone database., 31 (2): 287-301, DOI: 10.1175/JTECH-D-12-00119.1.
Zhang, X., Pan, D., Chen, J., Zhao, J., Zhu, Q., and Huang, H., 2014a. Evaluation of coastline changes under human intervention using multi-temporal high-resolution images: A case study of the Zhoushan Islands, China., 6 (10): 9930-9950.
Zhang, Y., Li, X., Ma, Y., and Bao, Y., 2014b. Analyzing shoreline changes of the Pearl River Estuary based on remote sensing., 34 (3): 52-55 (in Chinese with English abstract).
. E-mail: yjhou@qdio.ac.cn
December 29, 2019;
April 8, 2020;
April 22, 2020
(Edited by Xie Jun)
杂志排行
Journal of Ocean University of China的其它文章
- Variation of Yellow River Runoff and Its Influence on Salinity in Laizhou Bay
- Cold Water in the Lee of the Batanes Islands in the Luzon Strait
- Preliminary Design of a Submerged Support Structure for Floating Wind Turbines
- Inversion of Oceanic Parameters Represented by CTD Utilizing Seismic Multi-Attributes Based on Convolutional Neural Network
- Trace-Norm Regularized Multi-Task Learning for Sea State Bias Estimation
- 11000-Year Record of Trace Metals in Sediments off the Southern Shandong Peninsula in the South Yellow Sea