Cold Water in the Lee of the Batanes Islands in the Luzon Strait
2020-11-30SUNRuiliZHAIFangguoZHANGGuoshengGUYanzhenandCHINianping
SUN Ruili, ZHAI Fangguo, ZHANG Guosheng, GU Yanzhen, and CHI Nianping
Cold Water in the Lee of the Batanes Islands in the Luzon Strait
SUN Ruili1), *, ZHAI Fangguo2), ZHANG Guosheng3), 4), *, GU Yanzhen2), and CHI Nianping1)
1) College of Environmental Science and Engineering, Zhejiang Gongshang University, Hangzhou 310000, China 2) College of Oceanic and Atmospheric Sciences, Ocean University of China, Qingdao 266100, China 3) Nanjing University of Information Science and Technology, Nanjing 210044, China 4) Southern Marine Science and Engineering Guangdong Laboratory (Zhuhai), Zhuhai 519080, China
Using satellite remote sensing data and hydrological observation data, this study investigated the cold water in the lee of the Batanes Islands in the Luzon Strait. The formation of cold water in climate is mainly due to the geostrophic heat advection on the east and west sides of the Batanes Islands: the Kuroshio separates into two branches on the east and west sides of the Batanes Islands. These two branches cause two warm tongues by transferring heat from low latitudes to mid-latitudes, and then the two warm tongues lead to the formation of the relatively cold water in the lee of the Batanes Islands. Further study shows that the cold water range has obvious seasonal and inter-annual variations. Except for August, the seasonal variation of the cold water range is caused by the interaction of geostrophic heat advection and net surface heat flux, whereas the low temperature in August in the lee of the Batanes Islands is caused by the island wake effect. The inter-annual of the cold water range is related to the difference in the meridional velocity between the east and west sides of the Batanes Islands, and the correlation coefficient can reach −0.68 at the 95% confidence level.
Luzon Strait; cold water; Batanes Islands; temperature equation; island wake effect
1 Introduction
The Luzon Strait (LS) located between Taiwan Island and Luzon Island (Figs.1a and 1b) is the most important gap for material and energy exchange between the South China Sea (SCS) and the Pacific Ocean (Qu, 2002; Centurioni, 2004; Nan, 2013; Zhang, 2017). The seawater is transported from the Pacific Ocean to the SCS in the upper and deep layer of LS but from the SCS to the Pacific Ocean in the middle layer water of the LS (Qu, 2006; Tian and Qu, 2012; Zhao, 2014; Wang, 2016). The Pacific intrusive water and mesoscale eddies transport heat, salt, and volume from the Pacific to the SCS, thereby affecting the local circulation and thermohaline structure in the northern SCS (Qu, 2002; Sheu, 2010; Wang, 2012; Qiu, 2019a; Wang, 2020). Meanwhile, the LS is surrounded by many small islands, such as Batanes Islands, Lanyu Island, and Green Island, which interact with the flow field to produce complex oceanic phenomena around the LS (Chang, 2013; Sun, 2016a, b).
As the strongest western boundary current in the North- west Pacific, the Kuroshio passes through the eastern part of the LS and intrudes into the SCS in various flow pat-terns (Jia and Liu, 2004; Caruso, 2006; Nan, 2011). Affected by topography, monsoon, and mesoscale eddies, the variation of Kuroshio in the LS is extremely complex: 1) the Kuroshio can intrude into the SCS in the form of multiple flow patterns (Caruso, 2006; Nan, 2011; Zhang, 2017); 2) the Kuroshio interacts with the mesoscale eddies, which alters the local current field (Lu and Liu, 2013; Zu, 2013; Lien, 2014; Geng, 2016, 2018; Sun, 2016a, b; Zhang, 2017; Qiu, 2019b); and 3) the Kuroshio is divided into two branches due to topographic blocking (Sun, 2016b). Given the complex circulation and importance of the Kuroshio in the vicinity of the LS, these issues are interesting topics.
The Batanes Islands lie to the east of the central LS and are the only way to the Kuroshio in the LS (Fig.1a), and the Kuroshio inevitably interacts with the Batanes Islands, which in theory can significantly change the local marine environment. We re-examined the sea surface temperature (SST) distribution around the Batanes Islands and found cold water leeward from the Batanes Islands, which has not been studied to our best knowledge. Thus, this study investigated the cause and the spatio-temporal variation characteristics of the cold water formation in the lee of the Batanes Islands. The rest of the paper is organized as follows. Section 2 briefly describes the data and methods. Section 3 shows the formation mechanism of the cold water and its seasonal and inter-annual variation. Section 4 discusses the island wake effect in the lee of Batanes Islands. Section 5 summarizes the results of this study.
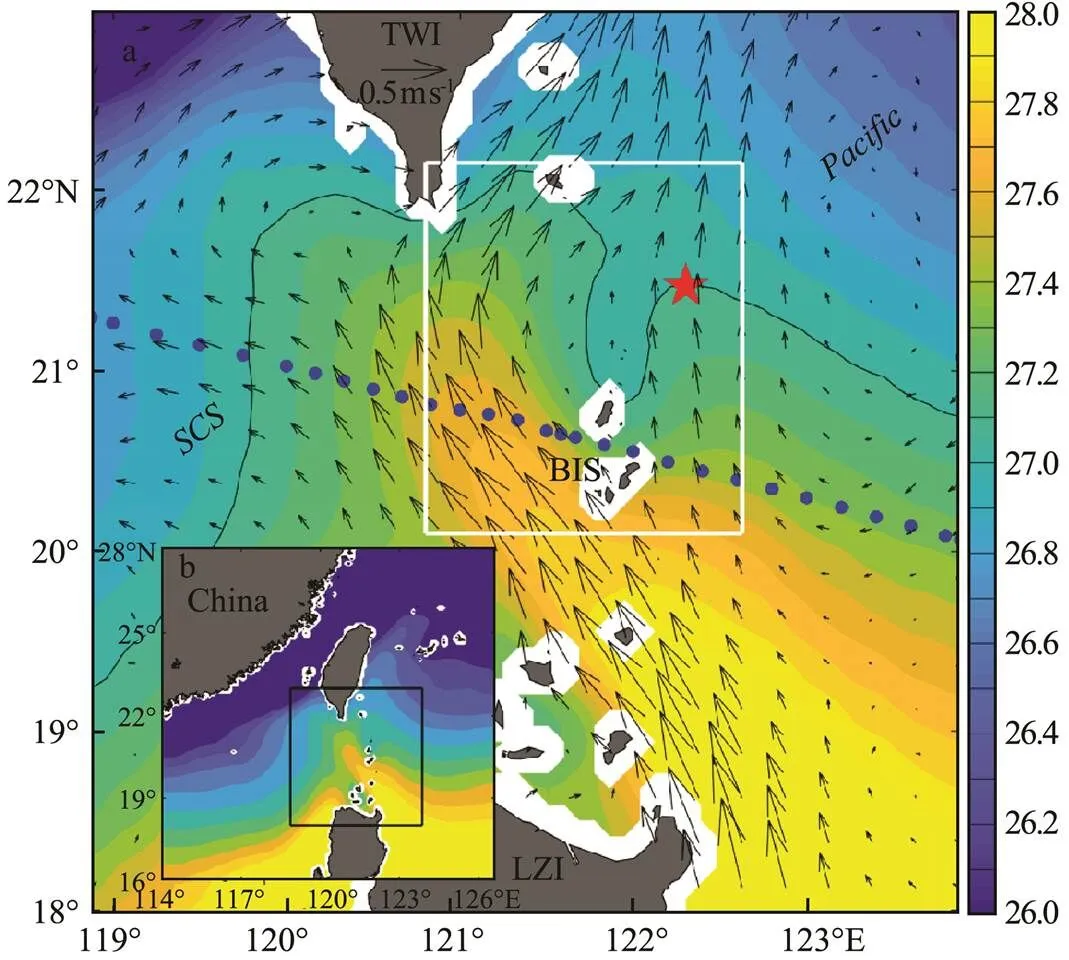
Fig.1 (a) Spatial distribution of the sea surface temperature (℃, indicated by color) and geostrophic current (ms−1, indicated by vector) in the climate state around the LS. The black line represents 27.2℃ to emphasize the cold water in the lee of the Batanes Islands. The white box covers 20.10˚–22.15˚N, 120.800˚–122.625˚E, which is selected as the research area in this paper. The location of the red pentagram denotes the northernmost end of the cold water. The solid blue dots indicate the observation location of XBT. LZI, Luzon Island; TWI, Taiwan Island; BIS, Batanes Islands; SCS, South China Sea. (b) The extent of the main map is shown as a black box in Fig.b. The color bar of Fig.1a is the same as that of Fig.1b.
2 Data and Methods
2.1 Data
SST data are downloaded from Remote Sensing Systems (ftp://ftp.remss.com). The data set is merged with Microwave measurements from the Advanced Microwave Scanning Radiometer for Earth Observing System, Wind- SAT, and Tropical Rainfall Measuring Mission MicrowaveImages and with infrared measurements from the Moderate Resolution Imaging Spectroradiometer. It provides daily data from June 1, 2002 to present. It has a spatial resolution of 9km×9km and a temporal sampling frequency of 1 day. The data set gives an estimated error standard deviation of SST and has been widely used in oceanography (Sun, 2016b, 2018).
Geostrophic current data are provided by Copernicus MarineEnvironmentMonitoringService(CMEMS)(http://marine.copernicus.eu/). The data set is generated by the processing system, including data from all altimeter missions: Sentinel-3A/B, Jason-3, HY-2A, Jason-1, Topex/Poseidon, Envisat, GFO, and ERS-1/2. It provides a global coverage and regional products, has a spatial resolution of 0.25˚×0.25˚, and has a temporal sampling frequency of 1 dayfrom1993topresent.TheCMEMSproducestwocom- ponents: near real-time component and delayed-time component. The delayed-time component provides a homogeneous, inter-calibrated, and highly accurate long time series of all altimeter data (Pujol and Francoise, 2019). The delayed-time component is selected in this paper.
Expendable bathythermograph (XBT) data are provided by the Global Temperature and Salinity Profile Program (GTSPP, http:www//.nodc.noaa.gov/GTSPP/gtspp-home.html). GTSPP provides XBT data from May 1989 to December 2018 and has processed the temperature profile data to ensure data quality. The XBT profiles can reach up800m deep with a horizontal spacing of roughly 10 profiles per degree of longitude across the Kuroshio (Gilson, 1998). The XBT profile from 25 August 2006 best reflects the Kuroshio-induced wake in the lee of the Batanes Islands in the LS and thus was selected for this study.
Quickscat wind data originate from the Asia-Pacific Data-Research Center (http://apdrc.soest.hawaii.edu/) and then is processed by the observations of the SeaWinds scatterometer on the Quick Scatterometer space mission of the National Aeronautics and Space Administration (NASA). The time span of the wind data is from January 2000 to December 2008. It has a spatial resolution of 0.25˚×0.25˚ and a temporal sampling frequency of 1 day, which is one of the best-resolved products available.
The monthly climatology of observed temperature and salinity from World Ocean Atlas 2013 (WOA2013) is used to calculate the mixed-layer depth (MLD). It has a horizontal resolution of 0.25˚×0.25˚ and 102 standard depths from the surface to 5500m with a vertical resolution varying from 5m at the surface to 100m below 2000m. Previous studies demonstrated that WOA can capture MLD well (Qu, 2001; Wang and Wang, 2006).
Chlorophyll-concentration data are obtained from the Moderate Resolution Imaging Spectroradiometer of NASA (https://modis.gsfc.nasa.gov/) with a spatial resolution of 0.25˚×0.25˚ and a temporal resolution of 1 day. The net heat flux reanalysis data from the European Center for Medium-Range Weather Forecasts (https://www.ecmwf.int/) has a spatial resolution of 0.25˚×0.25˚ and a temporal resolution of 1 h. The time span of the data set is from January 1, 1979 to present.
2.2 Methods
To examine what influences temperature change, we apply a mixed-layer temperature equation:
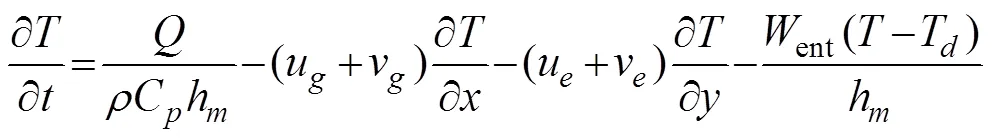
whereis the SST and is a good proxy of the mixed-layer temperature,is the time,is the surface net heat flux,is the reference density of seawater,ρCis the specific heat capacity per unit volume,his the MLD,andare the conventional Cartesian coordinates,u(u) andv(v) are the geostrophic (Ekman) components of ocean current velocity corresponding toand, respectively,entis the vertical entrainment velocity,Tis the water temperature at a depth of 5m below the MLD. In the following, we refer to the five terms in Eq. (1) as temperature tendency, surface net heat flux term, geostrophic heat advection term, Ekman heat advection term, and vertical heat entrainment term (Qu, 2001). The model is assumed to have reached equilibrium once the temperature variation between two successive time steps is smaller than 0.1℃ (Sun, 2016b).
In this paper, cold water is defined as the relatively low-temperature region between the east and west warm tongues. The maximum latitude on the less latitude side of the cold water edge contour is defined as the cold water range in the lee of the Batanes Islands, which is marked by a red pentagram in Figs.1, 4, and 7. The average value of the cold water range is 21.47˚N, as shown in Fig.1. Minusing the average value of the cold water range, the abnormality of the cold water range can be obtained.
3 Results
3.1 Formation Mechanism of the Cold Water in the Lee of the Batanes Islands
As shown in Fig.1, the Kuroshio has been divided into two branches and forms two warm tongues on the west and east sides of the Batanes Islands. The SST between the two warm tongues is relatively low, and the low-SST region is defined as the cold water region in this study. Previous studies reported that the factors affecting SST include net surface heat flux, geostrophic heat advection, Ekman heat advection, and vertical heat entrainment (Qu, 2001; Wang and Wang, 2006; Qiu, 2015). Therefore, we use the temperature equation described in Section 2.2 to study the formation mechanism and variation of the cold water.
The contributions of the net surface heat flux term, Ekman heat advection term, geostrophic heat advection term, and vertical heat entrainment term are shown in Fig.2. The Ekman heat advection and vertical heat entrainment are generally small. In the vicinity of the Batanes Islands, the net surface heat flux (geostrophic heat advection) shows a negative (positive) SST change about 1–1.5℃mon−1(0–4℃mon−1) near the Batanes Islands. Fig.2a shows that although the net surface heat flux is the dominant term in the SST change, its cooling effect cannot produce the spatial pattern of the cold water near the Batanes Islands. Fig.2c shows that the spatial pattern of SST change caused by the geostrophic heat advection term is similar to the spatial pattern of the cold water in the lee of the Batanes Islands. Thus, the geostrophic heat advection term leads to the cold water formation in the lee of the Batanes Islands in the climate state, and the net surface heat flux term can affect the spatial distribution of the cold water in the lee of the Batanes Islands.

Fig.2 (a) Net surface heat flux term; (b) Ekman heat advection term; (c) Geostrophic heat advection term; (d) Vertical heat entrainment term. Unit: ℃month−1. Each item is the average of the climate state.
We use the zonal average values of SST and geostrophic current in climatic state as the initial SST distribution and current distribution (Fig.3a), respectively, ignoring the net heat flux term, Ekman heat advection term, and vertical heat entrainment and then integrating the temperature Eq. (1). The simulated SST pattern (Fig.3b) is consistent with the SST pattern from the satellite observation (Fig.3c) and can reflect the cold water in the lee of the Batanes Islands. The spatial correlation coefficient between the simulated SST and satellite-observed SST is as high as 0.964.
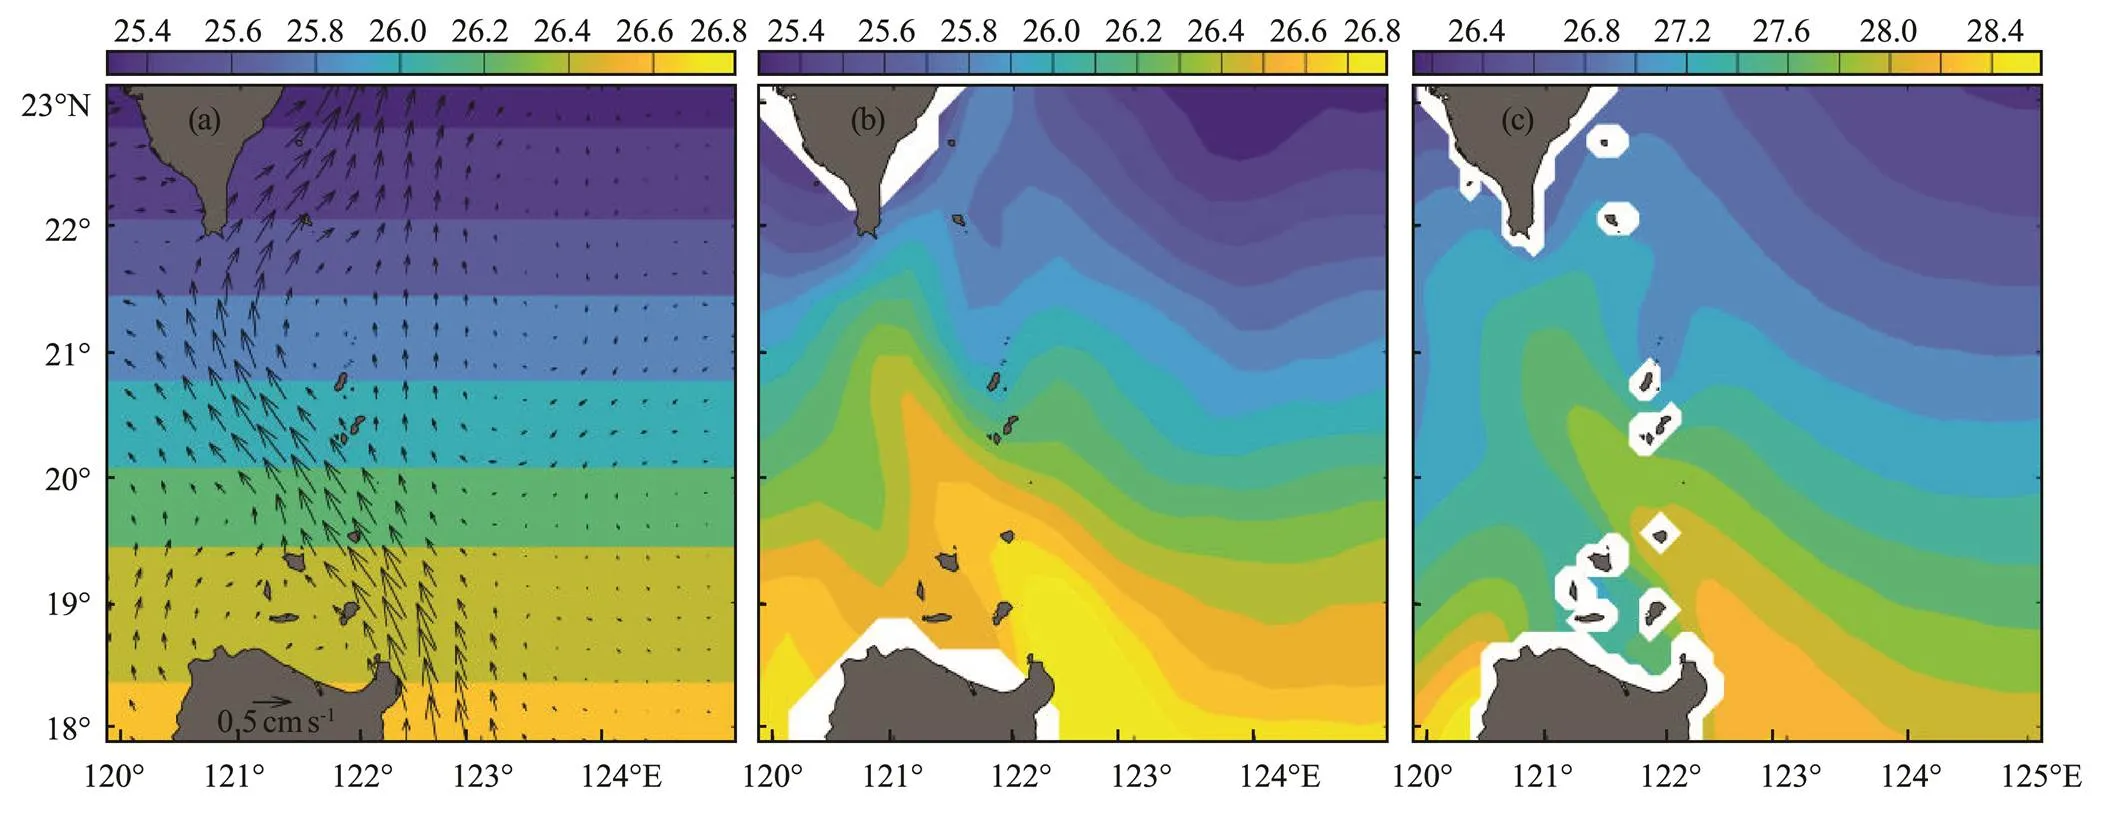
Fig.3 (a) Spatial distribution of initial geostrophic current and SST in the climate state; (b) Simulated SST; (c) Climatological SST observed by satellite from January 1, 2003 to December 31, 2019.
3.2 Seasonal Variation of the Cold Water Range in the Lee of the Batanes Islands
Seasonal variation of the spatial distribution of cold water in the lee of the Batanes Islands is shown in Fig.4. The figure shows that the spatial distribution of the cold water has obvious seasonal variation. The spatial scope of cold water is larger in some months, such as in July, September, and October, and smaller in some months, such as in March, April, and August. The contour of the cold water edge (CCWE) is important to quantitatively describe the seasonal variation of the cold water in the lee of the Batanes Islands. When the contour interval is 0.1℃, the CCWE must meet the following conditions: 1) The contour crosses the Batanes Islands; 2) The northernmost section of the contour on the east and west sides of the Batanes Islands can reach the maximum. Notably, 0.1℃ is small enough. A contour interval less than 0.1℃ will not affect the conclusion of this study. The black line in each sub-graph in Fig.4 represents the corresponding CCWE, indicating that the maximum latitude of the contour is generally greater on the west side than on the east side of the Batanes Islands. According to the buckets effect, the spatial range of the cold water is determined by the less latitude side of CCWE.
The seasonal variation of the cold water range anomaly is shown in Fig.5. Fig.5 shows that the cold water range is abnormally large (small) in boreal summer and autumn (boreal winter and spring), except in August. The positive outliers of the cold water range have minimal difference and are greater in July, September, and October than in June and November. The largest positive anomaly in July and October is 0.6˚. The negative outliers of the cold water range initially increase and then decrease from winter to spring, reaching a maximum of 0.5˚ in March. The amplitude of the cold water range variation can reach 1.1˚ on an annual scale.
The anomaly of the cold water range in August is a special case in Fig.5, which can also be intuitively reflected in Fig.4. The figure shows that the spatial distribution of the cold water range in August is significantly different from that in other months. In other months, two strong northward currents cause two warm tongues, leading to a relatively cold water formation in the lee of the Batanes Islands, which is consistent with the conclusion of the formation mechanism of the cold water in Section 3.1 of this paper. However, warm tongues are absent in August, although two strong northward currents exist on the east and west sides of the Batanes Islands. Thus, the formation mechanism of the cold water in August is not caused by geostrophic heat advection. It is consistent with our above conclusions because the formation mechanism of the cold water in Section 3.1 is used for the cold water of climate state and not the specific month. The cold water formation in August is caused by the island wake effect, which will be given in detail in Section 4.
Seasonal variation of the cold water range is essentially one of the spatial distribution of SST near the Batanes Islands.Fig.6 shows the seasonal variation of SST changes caused by each item of the mixed-layer temperature equation, indicating that the geostrophic heat advection term and the net surface heat flux term play a leading role in the monthly SST change. The SST changes caused by geostrophic heat advection reach the minimum in August (Fig.6), confirming that the cold water formation in August is not caused by geostrophic heat advection. There-fore, except for August, the seasonal variation of SST changes around the cold water is mainly caused by the interaction of geostrophic heat advection and surface net heat flux. The seasonal variation of SST changes affects the spatial distribution of SST, which determines the seasonal variation of the cold water range in the lee of the Batanes Islands.

Fig.4 Seasonal variation of SST (℃, indicated by color) and geostrophic current (ms−1, indicated by vector). The black solid line crossing the Batanes Islands represents the corresponding contour of the cold water edge. The red pentagrams correspond to the maximum latitude affected by the cold water in the lee of the Batanes Islands, respectively. The contour interval is 0.1℃.

Fig.5 Seasonal variation of the cold water range anomaly in the lee of the Batanes Islands.
3.3 Inter-Annual Variation of the Cold Water Range in the Lee of the Batanes Islands
Fig.7 shows the inter-annual variation in the spatial distribution of cold water in the lee of the Batanes Islands from 2003 to 2018 and shows two warm tongues caused by two strong northward currents. The two warm tongues lead to the cold water in a relative sense in the lee of the Batanes Islands in all the years, which is consistent with the conclusion of the cold water formation mechanism in Section 3.1. Inter-annual variation of the cold water range anomaly in the lee of the Batanes Islands is shown quantitatively in Fig.8a. As shown in Fig.8a, the anomaly of the cold water range is larger (smaller) than the positive (negative) standard deviation that deviates from the mean in 2003, 2015, and 2017 (in 2008, 2009, 2012, and 2013). The maximum positive (negative) value is 0.6223˚ in 2015 (0.675˚ in 2012), and the amplitude of the cold water range variation can reach 1.3˚ on an inter-annual scale.
The SST and geostrophic current in 2003, 2015, and 2017 and in 2008, 2009, 2012, and 2013 are respectively composited, as shown in Figs.8b and 8c. The cold water range in Fig.8b can reach 22.19˚N, whereas the cold water range in Fig.8c can only reach 20.93˚N, and the difference between the two can reach 1.26˚. Comparison of Figs.8b and 8c indicates that the meridional velocity difference between the east and west sides of the Batanes Islands weaken (strengthen). In addition, the two warm tongues caused by the two strong northward current on the east and west sides of the Batanes Islands strengthen (weaken) and further increase (decrease) the cold water range in the lee of Batanes Islands. Hence, we speculate that the inter-annual variation of meridional current velocity difference on the east and west sides of the Batanes Islands leads to the inter-annual variation of the cold water range.

Fig.6 Seasonal variation of SST changes caused by the net surface heat flux term, geostrophic heat advection term, Ekman heat advection term, and vertical heat entrainment term of the mixed-layer temperature equation. The region of SST changes in this figure is the one covered by the white box in Fig.1.
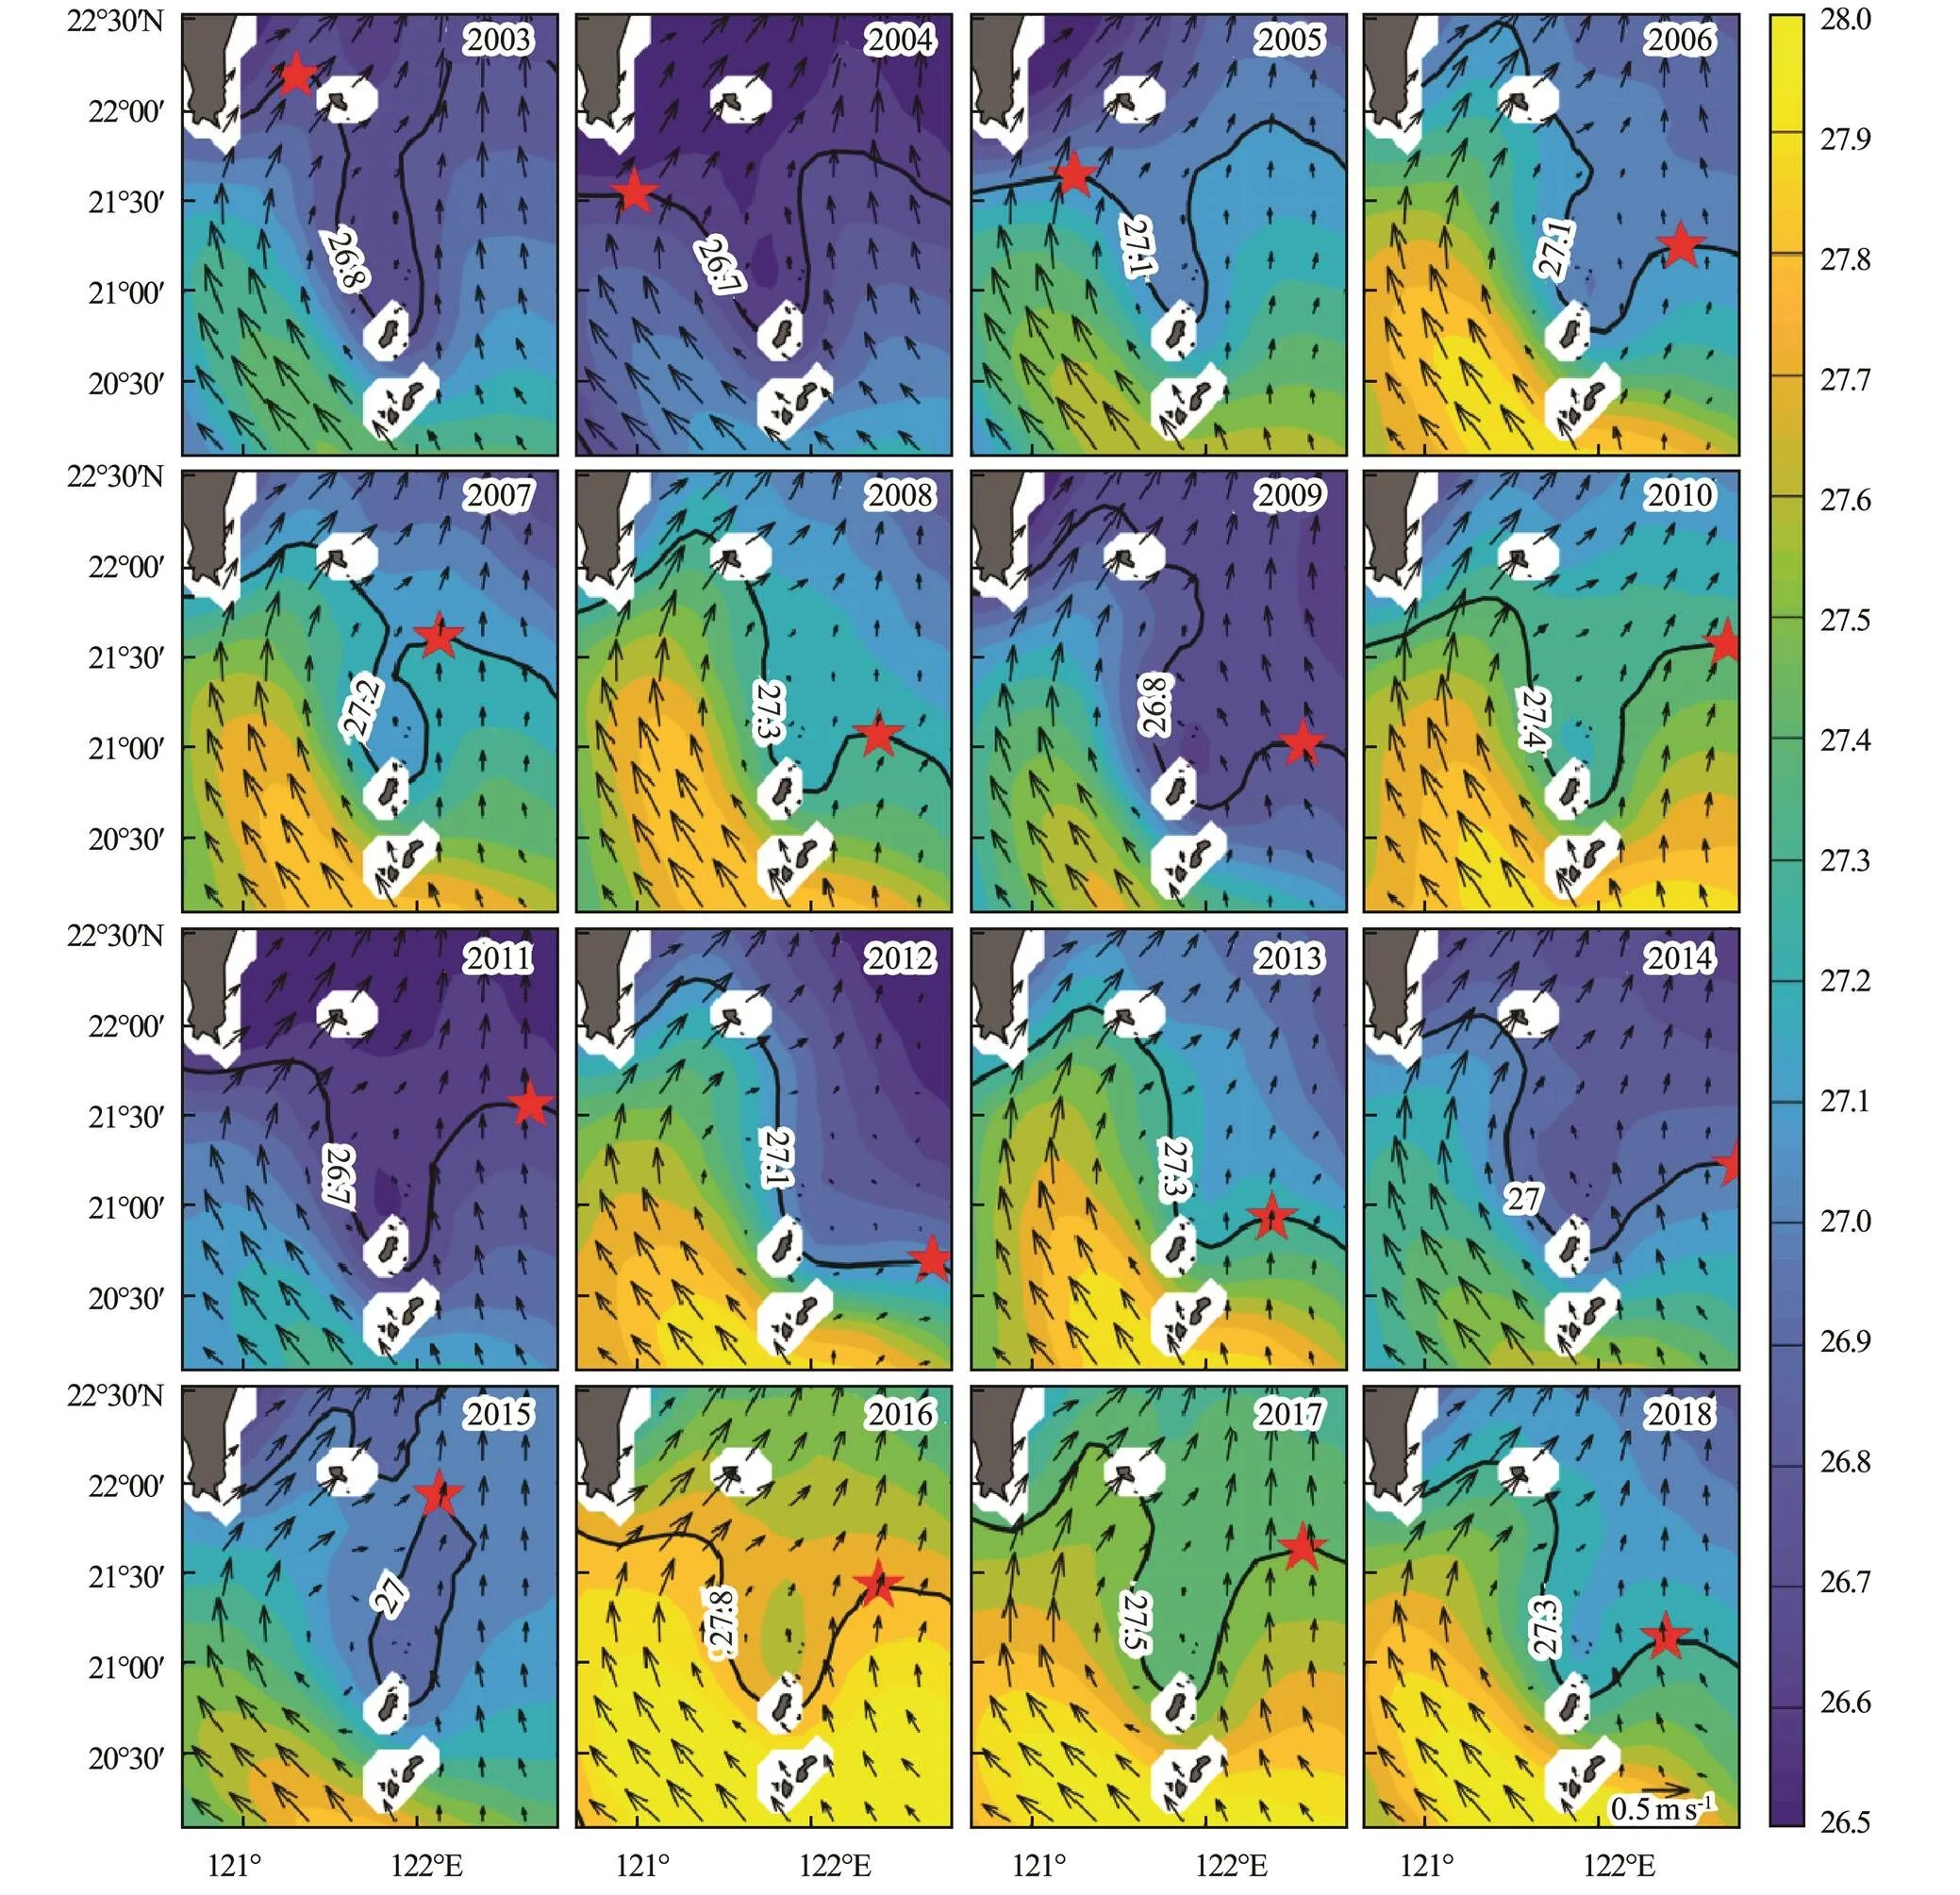
Fig.7 Inter-annual variation of SST (℃, indicated by color) and geostrophic current (ms−1, indicated by vector) from 2003 to 2018. The black solid line crossing the Batanes Islands represents the corresponding CCWE. The red pentagrams correspond to the maximum latitude affected by the cold water range in the lee of the Batanes Islands, respectively. The contour interval is 0.1℃.
The regions marked by the two white boxes in Fig.8b represent two northward currents on the east and west sides of the Batanes Islands. A slight change in the size or position of the two white boxes in Fig.8b does not affect the conclusion of this paper. The mean meridional velocity of the western white box is subtracted from that of the eastern white box to obtain the meridional velocity anomaly index (MVAI), as shown in Fig.8a. The MVAI has obvious inter-annual variation, and the correlation coefficient between the cold water range and MVAI can reach 0.68 at the 95% confidence level, which proves our above speculation in statistical significance.
To verify our above speculation from dynamics, we si- mulate the cold water formation on the inter-annual scale by using a mixed-layer temperature equation. Fig.8a shows that the minimum and maximum values of MVAI were in 2004 and 2012, respectively, which can be intuitively reflected in Fig.7. The figure shows that the meridional velocity on the east and west sides of the Batanes Islands in 2004 had minimal difference, whereas the meridional velocity on the east side of the Batanes Islands in 2012 was significantly weaker than that on the west side. Furthermore, we use the geostrophic current in 2004 and 2012 to simulate the formation of cold water, as shown in Figs.9a and 9b, respectively. Fig.9a shows that the east and west warm tongues are strong, resulting in a large cold water range. The spatial correlation coefficient between the simulated and observed SSTs in 2004 can reach 0.87. Meanwhile, Fig.9b shows that the east warm tongue is significantly weaker than the west warm tongue, resulting in a smaller cold water range. The spatial correlation coefficient between the simulated and observed SSTs in 2012 can reach 0.93. This mixed-layer temperature equation that only considers the geostrophic heat advection can well simulate the inter-annual variation of the cold water range, which further proves our speculation above. The effect of net heat flux on inter-annual variation of the cold water range in the lee of the Batanes Islands was also studied. Results show no good correspondence between the two.
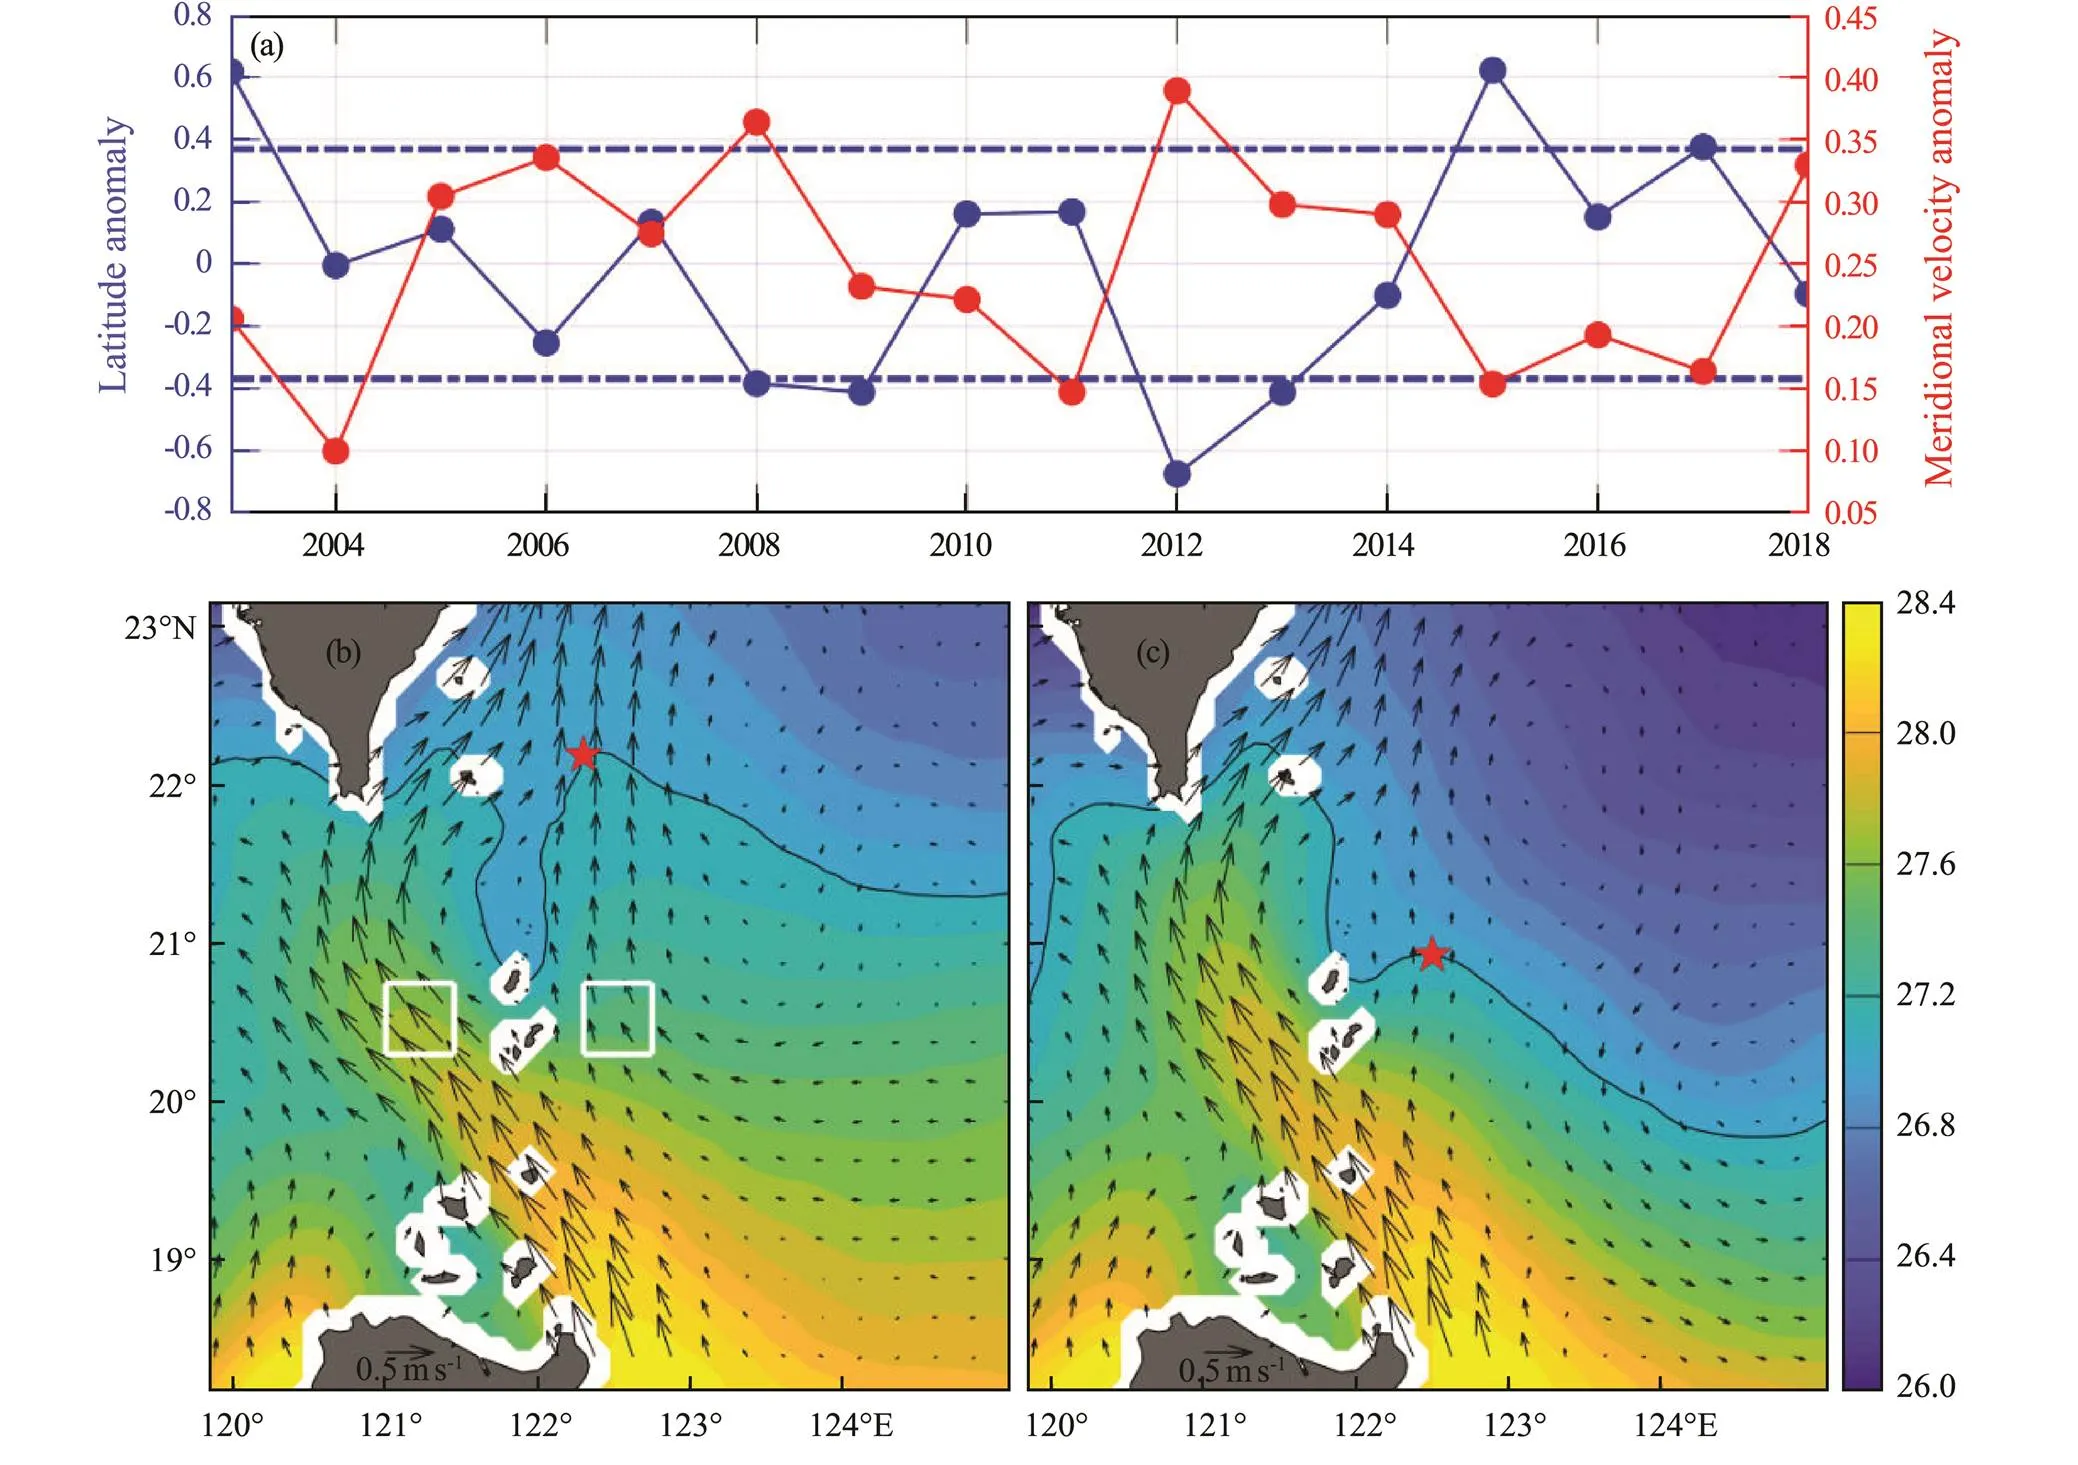
Fig.8 (a) Inter-annual variation of the cold water range anomaly in the lee of the Batanes Islands (˚, indicated by blue line) and inter-annual variation of meridional velocity anomaly index (ms−1, indicated by red line). The upper (lower) blue dotted line above represents the sum (difference) of the one times standard deviation and the average value of the time series; (b) Composition of SST (℃, indicated by color) and geostrophic current (ms−1, indicated by vector) in 2003, 2015, and 2017. The white boxes cover 20.30˚–20.75˚N, 121.00˚–121.45˚E and 20.30˚–20.75˚N, 122.30˚–122.75˚E on the western and eastern sides of the Batanes Islands, respectively; (c) Same as Fig.8b, except for in 2008, 2009, 2012, and 2013. The black solid lines and the red pentagrams indicate the contour line of 27.1℃ and the maximum latitude affected by the cold water range in the lee of the Batanes Islands in Figs.8a and 8b, respectively. The contour intervals in Figs.8a and 8b are 0.1℃.

Fig.9 (a) Simulated sea surface temperature (SST) by the geostrophic current in 2004; (b) Simulated SST by the geostrophic current in 2012. The contour interval is 0.1℃.
The specific process of inter-annual variation of the cold water range caused by the difference of meridional current velocity between the east and west sides of the Batanes Islands can be understood as follows. The current velocity of the eastern branch of the Kuroshio bifurcation is weaker than that of the western branch, which makes the east warm tongue weaker than the west warm tongue. When the Kuroshio shifts more volume from the west branch to the east branch or more anticyclone eddies occur in the east side of the Batanes Islands (Sun, 2016b), the difference in meridional current velocity on the east and west sides of the Batanes Islands decreases, enhances the east branch, and then causes a strong east warm tongue. According to the buckets effect, an increase in the weaker east warm tongue increases the cold water range between the west and east warm tongues.
4 Discussion
Previous studies have shown that the SST is relative low because of the upwelling caused by eddies in the wake region of the islands (Dong, 2007; Chang, 2013). Therefore, a reasonable question is does the Batanes Islands in this paper have the island wake effect. In general, the sea temperature gradually decreases from the surface to the bottom of the sea. If upwelling occurs in the lee of the Batanes Islands, the isotherms should be convex from the bottom to the surface, which is well reflected in Fig. 10a. The XBT observation section passes through the Batanes Islands (Fig.1), and the vertical distribution of the sea temperature is shown in Fig.10a. Fig.10a illustrates that a low-temperature region exists around 122˚E where the Batanes Islands is located, and the isotherms are convex around 122˚E. This result implies that upwelling possibly occurs in the lee of the Batanes Islands. Upwelling brings nutrients from the seabed to the sea surface, and phytoplankton should increase significantly under photosynthesis. Fig.10b shows that the concentration of chlorophyll-is the highest in the lee of the Batanes Islands, and the highest value can reach 0.1518mgm−3. Then, the concentration of chlorophyll-gradually decreases from low latitude to high latitude, which further confirms upwelling. This phenomenon decreases the SST in the lee of the Batanes Islands. Notably, the upwelling phenomenon is not reflected in Fig.2d because of the low spatial resolution of data.
Although the upwelling decreases the SST in the lee of the Batanes Islands, the area of the cold water caused by the upwelling should be about the size of the Batanes Islands (Heywood, 1990; Dong, 2007; Chang, 2013). Fig.10a shows that the width of cold water is about 0.4˚ in the latitudinal direction, and chlorophyll-only erupts in a small area near the Batanes Islands (Fig. 10b). This result implies that the area of the cold water caused by the upwelling should be about the size of the Batanes Islands. In Section 3.1, the cold water formation in August was not caused by geostrophic heat advection because the temperature gradient ∂/∂and ∂/∂hardly existed in August, as shown in Fig.4. Thus, the geostrophic heat advection·∂/∂and·∂/∂does not play a role in the spatial distribution of SST. The low-temperature area in August in the lee of the Batanes Islands is roughly the same as that of the Batanes Islands, indicating that the possible formation mechanism of the cold water in August may be due to the island wake effect. Our conclusion is that the island wake effect can lead to a low- temperature area about the size of the Batanes Islands, which is different from the cold water phenomenon reported in Section 3.
The inter-annual variation of the cold water range in the lee of the Batanes Islands is used as the study of the annual average of the cold water range. A single-month inter-annual variation study will be carried out in the future work.

Fig.10 (a) XBT vertical profile of temperature (℃; indicated by white contour) and temperature anomaly (℃; indicated by shading) with the zonalmean removed. Solid black lines are the zero contours of temperature anomaly; (b) Spatial distribution of chlorophyll-a concentration.
5 Conclusions
On the basis of satellite observation data and hydrological observation data, the formation mechanism, seasonal variation, and inter-annual variation of the cold water in the lee of the Batanes Islands were studied. Using a mixed-layer temperature equation, we found that the cold water formation in climate is mainly caused by the geo- strophic heat advection on the west and east sides of the Batanes Islands. The low-temperature region in August in the lee of the Batanes Islands is a special case that may be caused by the island wake effect when the geostrophic heat advection does not work. Although the island wake effect can cause a low-temperature region in the lee of the Batanes Islands, its area is about the same size of the Batanes Islands. Thus, the island wake effect cannot lead to the formation of the cold water phenomenon studied in this paper.
The cold water range in the lee of the Batanes Islands has obvious seasonal variation. The cold water range in boreal summer and autumn (boreal winter and spring) is abnormally large (small), except for August. The average value of the cold water range is 21.47˚N. The maximum of the cold water range occurred in July and October, which was 0.6˚ higher than the average, whereas the minimum of the cold water range occurred in March, which was 0.5˚ less than the average. The amplitude of the cold water range variation can reach 1.1˚ on an annual scale. On the basis of the mixed-layer temperature equation, except for August, the seasonal variation of the cold water range is mainly caused by the interaction of geostrophic heat advection and net surface heat flux.
The cold water range in the lee of the Batanes Islands has obvious inter-annual variation. In 2003, 2015, and 2017, the cold water range was abnormally large. In 2015, the maximum positive value was 0.6223˚. In 2008, 2009, 2012, and 2013, the cold water range was abnormally small, and the maximum negative value was 0.675˚ in 2012. On an the inter-annual scale, the amplitude of the cold water range variation can reach 1.3˚. The inter-annual variation of meridional velocity difference between the east and west sides of the Batanes Islands led to one of the cold water range. The difference in meridional velocity between the east and west sides of the Batanes Islands is smaller (larger), and the two warm tongues on the east and west sides of the Batanes Islands is stronger (weaker), which promotes a larger (smaller) cold water range in the lee of the Batanes Islands.
Acknowledgements
SST data were downloaded from Remote Sensing Systems (ftp://ftp.remss.com). The geostrophic current data were downloaded from Copernicus Marine Environment Monitoring Service (http://marine.copernicus.eu/). The Expendable Bathy Thermograph data were downloaded from the Global Temperature and Salinity Profile Program(http:www//.nodc.noaa.gov/GTSPP/gtspp-home.html). Quickscat wind data set and World Ocean Atlas 2013 were downloaded from Asia-Pacific Data-Research Center (http://apdrc.soest.hawaii.edu/). The chlorophyll-concentration data were downloaded from Moderate Resolution imaging spectroradiometer of NASA (https://modis.gsfc.nasa.gov/). The net heat flux reanalysis data were downloaded from the European Centre for Medium-Range Weather Forecasts (https://www.ecmwf.int/). This research was supported by the National Natural Science Foundation of China (No. 41806019), the Natural Science Foundation of Zhejiang Province (No. LY18D060004), the National Programme on Global Change and Air-Sea Interaction (No. GASI-IPOVAI-04), the National Natural Science Foundation of China (Nos. 41976028, 41806219, and 41706193), the Project of State Key Laboratory of Satellite Ocean Environment Dynamics, Second Institute of Oceanography (No. SOEDZZ1805), the National Key R&D Program of China (No. 2019YFD0901305), and in part by the Startup Foundation for Introducing Talent of NUIST.
Caruso, M., Gawarkiewicz, G., and Beardsley, R.,2006. Interannual variability of the Kuroshio intrusion in the South China Sea., 62(4):559-575.
Centurioni, L., Niiler, P., and Lee, D., 2004. Observations of Inflow of Philippine sea surface water into the South China Sea through the Luzon Strait., 34 (1): 113-121.
Chang, M., Tang, T., Ho, C., and Chao, S., 2013. Kuroshio-induced wake in the lee of Green Island off Taiwan., 118 (3): 1508-1519.
Dong, C., McWilliams, J., and Shchepetkin, A., 2007. Island wakes in deep water., 37 (4): 962-981.
Geng, W., Xie, Q., Chen, G., Liu, Q., and Wang, D., 2018. A three-dimensional modeling study on eddy-mean flow interaction between a Gaussian-type anticyclonic eddy and Kuroshio., 74 (1): 23-37.
Geng, W., Xie, Q., Chen, G., Zu, T., and Wang, D., 2016. Numerical study on the eddy-mean flow interaction between a cyclonic eddy and Kuroshio., 72 (5): 1-19.
Gilson, J., Roemmich, D., Cornuelle, B., and Fu, L., 1998. Relationship of TOPEX/Poseidon altimetric height to steric height and circulation in the North Pacific., 103: 27947-27965.
Heywood, K., Barton, E., and Simpson, J., 1990. The effects of flow disturbance by an oceanic island., 48 (1): 55-73.
Jia, Y., and Liu, Q., 2004. Eddy shedding from the Kuroshio bend at Luzon Strait., 60 (6): 1063-1069.
Lien, R., Ma, B., Cheng, Y., Ho, C., Qiu, B., Lee, C., and Chang, M., 2014. Modulation of Kuroshio transport by mesoscale eddies at the Luzon Strait entrance., 119 (4): 2129-2142.
Lu, J., and Liu, Q., 2013. Gap-leaping Kuroshio and blocking westward-propagating Rossby wave and eddy in the Luzon Strait., 118 (3): 1170-1181.
Nan, F., Xue, H., Chai, F., Shi, L., Shi, M., and Guo, P., 2011. Identification of different types of Luroshio intrusion into the South China Sea., 61 (9): 1291-1304.
Nan, F., Xue, H., Chai, F., Wang, D., Yu, F., Shi, M., Guo, P., and Xiu, P., 2013. Weakening of the Kuroshio intrusion into the South China Sea over the past two decades., 26 (20): 8097-8110.
Pujol, M., and Francoise, M., 2019. Product user manual for sea level SLA products. http://marine.copernicus.eu/.
Qiu, C., Mao, H., Liu, H., Xie, Q., Yu, J., Su, D., Ouyang, J., and Lian, S., 2019a. Deformation of a warm eddy in the northern South China Sea., 124: 5551-5564, DOI: 10.1029/2019JC015288.
Qiu, C., Mao, H., Wang, Y., Su, D., and Lian, S., 2019b. An irregularly shaped warm eddy observed by Chinese underwater gliders., 75: 139-148.
Qiu, C., Mao, H., Yu, J., Xie, Q., Wu, J., Lian, S., and Liu, Q., 2015. Sea surface cooling in the northern South China Sea observed using Chinese Sea-wing underwater glider measurements., 105: 111-118.
Qu, T.,2001. Role of ocean dynamics in determining the mean seasonal cycle of the South China Sea surface temperature., 106(C4):6943-6955.
Qu, T.,2002. Evidence for water exchange between the South China Sea and the Pacific Ocean through the Luzon Strait., 21 (2): 175-185.
Qu, T., Girton, J., and Whitehead, J., 2006. Deepwater overflow throughLuzon Strait., 111: C01002, DOI: 10.1029/2005JC-003139.
Sheu, W., Wu, C., and Oey, L., 2010. Blocking and westward passage of eddies in the Luzon Strait., 57 (19): 1783-1791.
Sun, R., Gu, Y., Li, P., Li, L., Zhai, F., and Gao, G., 2016a. Statistical characteristics and formation mechanism of the Lanyu cold eddy., 72 (4): 641-649.
Sun, R., Wang, G., and Chen, C., 2016b. The Kuroshio bifurcation associated with islands at the Luzon Strait., 43 (11): 5768-5774.
Sun, R., Zhai, F., and Gu, Y., 2018. The four patterns of the east branch of the Kuroshio bifurcation in the Luzon Strait., 10 (12): 1-12.
Tian, J., and Qu, T., 2012. Advances in research on the deep South China Sea circulation., 57: 3155-3120.
Wang, D., Xiao, J., Shu, Y., Xie, Q., Chen, J., and Wang, Q., 2016. Progress on deep circulation and meridional overturning circulation in the South China Sea., 59: 1827-1833, DOI: 10.1007/s11430-016-5324-6.
Wang, Q., Zeng, L., Chen, J., He, Y., Zhou, W., andWang, D., 2020. The linkage of Kuroshio intrusion and mesoscale eddy variability in the northern South China Sea: Subsurface speed maximum., 47 (11): 1-9, DOI: 10.1029/2020GL087034.
Wang, W., and Wang, C., 2006. Formation and decay of the spring warm pool in the South China Sea., 33 (2): L02615.
Wang, X., Li, W., Qi, Y., and Han, G., 2012. Heat, salt and volume transports by eddies in the vicinity of the Luzon Strait., 61: 21-33.
Zhang, Z., Zhao, W., Qiu, B., and Tian, J., 2017. Anticyclonic eddy sheddings from Kuroshio loop and the accompanying cyclonic eddy in the northeastern South China Sea., 47: 1243-1259, DOI: 10.1175/JPO-D-16-0185.1.
Zhao, W., Zhou, C., Tian, J., Yang, Q., Wang, B., Xie, L., and Qu, T., 2014. Deep water circulation in the Luzon Strait., 119 (2): 790-804.
Zu, T., Wang, D., Yan, C., Belkin, I., Zhuang, W., and Chen, J., 2013. Evolution of an anticyclonic eddy southwest of Taiwan., 63: 519-531.
. E-mail: sunruili2007@126.com
E-mail: zhanggs@nuist.edu.cn
February 19, 2020;
July 12, 2020;
August 25, 2020
© Ocean University of China, Science Press and Springer-Verlag GmbH Germany 2020
(Edited by Xie Jun)
杂志排行
Journal of Ocean University of China的其它文章
- Numerical Simulation and Risk Analysis of Coastal Inundation in Land Reclamation Areas: A Case Study of the Pearl River Estuary
- Variation of Yellow River Runoff and Its Influence on Salinity in Laizhou Bay
- Preliminary Design of a Submerged Support Structure for Floating Wind Turbines
- Inversion of Oceanic Parameters Represented by CTD Utilizing Seismic Multi-Attributes Based on Convolutional Neural Network
- Trace-Norm Regularized Multi-Task Learning for Sea State Bias Estimation
- 11000-Year Record of Trace Metals in Sediments off the Southern Shandong Peninsula in the South Yellow Sea