Variation of Yellow River Runoff and Its Influence on Salinity in Laizhou Bay
2020-11-30SHIHongyuanLIQingjieSUNJiachengGAOGuandongSUIYiQIAOShouwenandYOUZaijin
SHI Hongyuan, LI Qingjie, SUN Jiacheng, GAO Guandong, SUI Yi, 2), QIAO Shouwen, 2), and YOU Zaijin, 2)
Variation of Yellow River Runoff and Its Influence on Salinity in Laizhou Bay
SHI Hongyuan1), 2), *, LI Qingjie3), SUN Jiacheng1), GAO Guandong4), 5), 6), SUI Yi1), 2), QIAO Shouwen1), 2), and YOU Zaijin1), 2)
1) School of Civil Engineering, Ludong University, Yantai 264025, China 2) Institute of Ports and Coastal Disaster Mitigation, Ludong University, Yantai 264025, China 3) Marine Environmental Monitoring Central Station, SOA, Yantai 264025, China 4) Key Laboratory of Ocean Circulation and Waves, Institute of Oceanology Chinese Academy of Sciences, Qingdao 266071, China 5) Qingdao National Laboratory for Marine Science and Technology, Qingdao 266000, China 6) Center for Mega Science, Chinese Academy of Science, Qingdao 266071, China
Salinity in estuaries has an important influence on sediment deposition, delta formation, and fishery economy. The change of runoff in Yellow River (YR), which is the largest river along the Bohai Sea, has an important effect on the salinity of the sea, particularly in Laizhou Bay. In this study, measured runoff data in Lijin hydrological station from 1950 to 2018 are adopted to examine the change of YR runoff into the sea. The study concludes that the runoff of YR is distributed unevenly throughout the year and the amount of runoff mainly concentrates during the flood season. Results show a decreasing trend at a significant level of=0.95, with a range of −6.17×10⁹m3yr−1. Three groups of runoff are set by using the Finite-Volume Coastal Ocean Model numerical model to analyze the change of salinity in Laizhou Bay. These modeled effects were compared with water level observations made by Bayuquan, Tanggu, and Penglai gauge stations and salinity surveys conducted by Longkou gauge station. Model results and observations of salinity distributions and coastal water level showed good agreement. We can conclude that the distribution of salinity in Laizhou Bay is high in the east and low in the west. Furthermore, it responded quickly to the change of the runoff from YR. Under conditions of high river discharge, the low-salinity zone increased in horizontal direction and reached the bottom in vertical direction.
Yellow River; runoff; salinity; FVCOM; Laizhou Bay
1 Introduction
Freshwater discharge from an estuary into the adjacent water forms an outwelling salinity plume (Xia, 2011). Estuarine stratification plays an important role in estuarine processes, such as vertical gravitational circulation, estuarine secondary circulation, sediment transport, and classification of estuaries (Monismith, 1996; García, 2002; Cheng, 2009; Lin, 2012; Flores, 2017). Many researchers have studied the important role played by freshwater discharge on the salinity stratification in estuary adjacent water; for example, Xia(2007, 2011) simulated the distribution of the salinity plume in Cape Fear River Estuary and Perdido Bay Estuary, respectively. Li and Liu(2019) investigated the intratidal and intertidal variations of salinity in Oujiang River Estuary with an extremely upstream river boundary and large computational domain by adopting Finite-Volume Coastal Ocean Model (FVCOM).
The Yellow River (YR) (Fig.1) is the river with the highest sediment content in the world. Its estuary is a typical terrestrial estuary with a small amount of water, a large amount of sediment, weak tides, and frequent delta evolution (Pang and Jiang, 2003). YR has always been the focus of research attention. In recent decades, under the influence of natural and human factors such as reservoir construction, the runoff of YR has been significantly reduced (Fan, 2009; Zeng, 2017; Yan, 2019); this condition certainly has an impact on the salinity field in the estuary and even the entire Bohai Sea. Zhao(1998) pointed out that the low-salinity areas generated by freshwater entering the sea under a specific geographical environment and the dynamic low-salinity areas formed by the movement of seawater that lead to the migration of diluted water are two types of low-salinity areas with different properties; they also pointed out the important value of low-salinity zone research on ecological changes and marine management. In the Bohai Sea, the low-salinity area has become an important marine fishery economic zone, especially in the estuary.
Owing to the different amounts of runoff into the sea, the range and intensity of the low-salinity area vary, thereby affecting the ecological conditions in the fishery area. Meanwhile, the change of salinity distribution caused by the continuous change of runoff into the sea directly affects the settlement and consolidation characteristics of sediment in the sea (Wang, 2018b). Therefore, salinity also has a significant effect on the formation of the YR Delta.
The huge changes in the water and sediment discharge of YR caused by the water and sediment diversion project is expected to influence the distribution of temperature and salinity in the sea around Laizhou Bay (Li, 2019). According to studies in recent decades, the sharp decrease of the runoff from YR has caused obvious changes in the temperature and salinity in the entire Bohai Sea, and the increase of temperature and salinity (Fang, 2002) has led to changes in the ecological environment. Using the measured data, many researchers (Wu, 2004; Zhang, 2006; Zhao, 2010) have found that the salinity in Bohai Sea, especially in Laizhou Bay, have risen in recent years. Manda and Matsuoka (2006), using a numerical model, also pointed out that the rapid change of YR runoff into the sea would have a strong impact on the salinity of Laizhou Bay. Therefore, further study is necessary on the characteristics of salinity after the water and sediment diversion project.
Previous studies that have provided a foundation for understanding the influence on salinity distribution (Takano, 1955; Beardsley, 1985; Chao, 1988; Garvine, 1987, 1999, 2001; Hickey, 1998; Fong and Geyer, 2002; Whitney and Garvine, 2006; Li, 2008; Marques,2009; Xia, 2007, 2011; Wang, 2018a) still have limitations. Few studies have deeply studied the runoff change characteristics and linked it with salinity distributions. With regard to YR, determining the sensitivity of water exchange to salinity is important. This study analyzes the changes of YR runoff and simulates the salinity changes in Laizhou Bay under different runoffs by adopting FVCOM. This paper is organized as follows: The runoff data and calculation method is introduced in Section 2. The results and discussions of the runoff change and salinity variation are shown in Section 3. The conclusions are presented in Section 4.
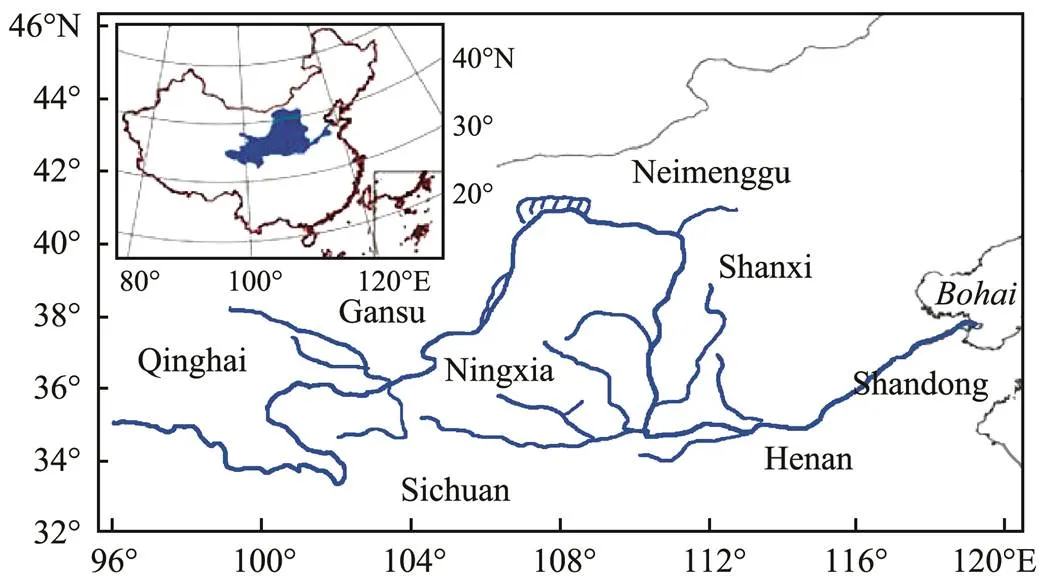
Fig.1 Geographical location of YR Basin.
2 Data and Method
2.1 Runoff Data
The runoff data of YR was obtained from Lijin hydrological station, the last important station before YR enters the Bohai Sea, because the amount of diversion water after the station is relatively small. Thus, this study takes the measured runoff data in the Lijin hydrological station as the runoff into the sea (without deducting the amount of diversion water after Lijin station). The data cover a period of nearly 70 years from 1950 to 2018.
2.2 Simulation Method
2.2.1 FVCOM model and settings
FVCOM is a three-dimensional (3D) regional ocean model with free sea surface and terrain-following. This open-source code was originally developed by Chen(2003) and has been supported and updated by the University of Massachusetts Dartmouth and Woods Hole Oceanographic Institution (Chen, 2006). In vertical direction, the model used the sigma layer or generalized terrain-following coordinate (Pietrzak, 2002). The user can employ the general ocean turbulence model (Burchard, 2002) instead of the default 2.5-level Mellor and Yamada (MY-2.5) turbulence model (Mellor and Yamada, 1982) to determine the vertical turbulent mixing terms. In recent years, FVCOM has been successfully applied in estuaries and coastal system study (, Gedi and Koji, 2004; Aoki and Isobe, 2007; Park, 2014; Yahya Surya, 2019). Through continuous updating, the mode and performance of FVCOM have improved gradually. The model has been widely applied to different scales of flow simulationsuch as marine geology, marine ecology, and ocean forecasting.
The change of YR runoff has the most significant influence on the salinity of Laizhou Bay located south of the Bohai Sea. This study takes Laizhou Bay as the research area affected by YR dilution water. The finite volume approach and unstructured meshes with 3D primitive equations make FVCOM suitable for research on coastal areas (Chen, 2006). The unstructured grid of FV-COM provides topographic flexibility that is adequate for the irregular morphology in YR and adjacent water. The model grid for Bohai Sea consists of 63932 nodes and 127273 elements. The computational grid has a high resolution that varies from approximately 3km at the open ocean boundary to approximately 25m near the coastlines. Land areas of approximately 6km from the nearest coastline have resolutions that vary in the range of approximately 25–300m. A total of 10 uniform vertical layers in a sigma coordinate system are set in the model according to sensitivity analysis.
The water elevation prescribed at the open boundary is predicted tidal elevation by TPXO (http://volkov.oce.orst.edu/tides/tpxo8_atlas.html). The wind is spatially uniform for the entire domain but varies with time. Terrain data in the model adopts GEBCO30 (General Bathymetric Chart of the Oceans) datasets with a high resolution of 30΄΄ for water depth (http://www.bodc.ac.uk/data/online_delivery/gebco/), which can effectively reflect the terrain changes in the Bohai Sea, especially in the middle shoal. The mini-mum water depth of the model is set to 0.5m. The time steps of the external and internal models are set to 10s and 600s, respectively.
The surface forcing data in climatological simulation, such as the monthly average sea surface temperature, salinity, wind stress, and solar radiation are obtained from the COADS05 (Comprehensive Ocean-Atmosphere Data Set) with a resolution of 0.5˚ published by the National Center for Atmospheric Research. The surface forcing data used in inter-annual simulation can be derived from Climate Forecast System Reanalysis dataset of the National Centers for Environmental Prediction. The model is run with a ‘cold start’ from January 1, 2015 to September 31, 2016. A monthly average of the previous year’s results is used for analysis in this study.
To effectively reflect the influence of YR runoff on the salinity distribution in the Bohai Sea, this study set up the following three experimental groups for comparison and analysis: control group with average runoff from 1950 to 1985 (Q1), experimental group adopting the average YR runoff from 1986 to 1996 (Q3), and a group representing the global monthly average runoff from Dai and Trenberth global river flow and continental discharge dataset (Q2). The three groups are arranged as Q1>Q2>Q3 (Fig.2). Taking 1985 as the jumping point of the periodical change of the YR runoff, we find that the amount of runoff changes significantly in the two stages. This change can reflect the influence of the sharp decrease of the runoff on salinity in the YR Estuary and even the entire Bohai Sea.
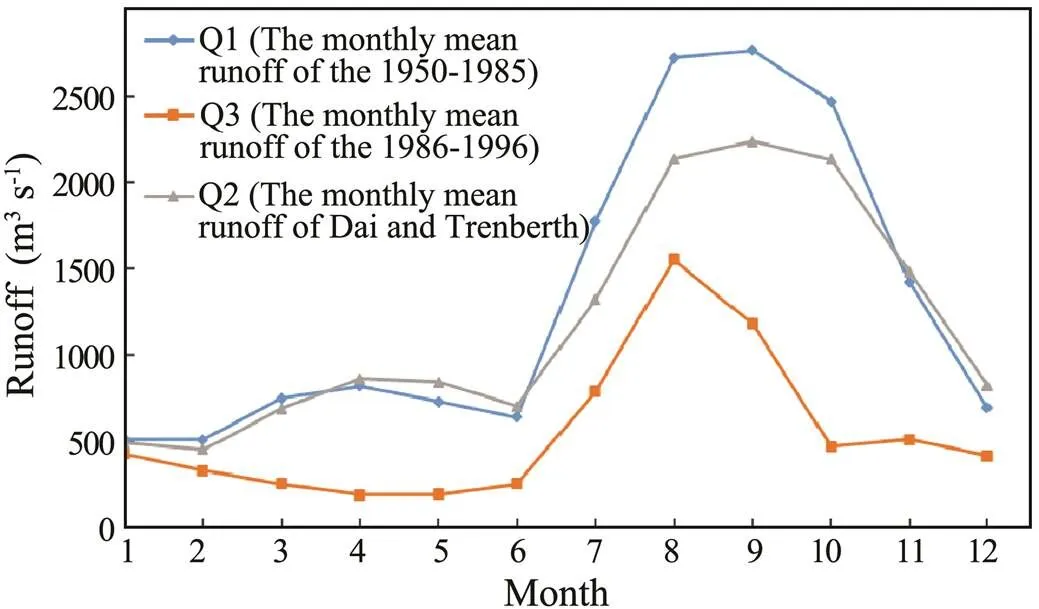
Fig.2 Three groups of YR runoff data input to FVCOM model.
2.2.2 Validation of FVCOM
Time-series data for the surface elevation were obtained by using tide gauges at the three stations: Bayuquan, Tanggu, and Penglai (Fig.3 and Table 1). The comparison of simulated water level and observation data was plotted in Fig.4. According to this comparison, the simulated and observed water levels show good agreement. Correlation coefficients are 0.96 for Bayuquan, 0.97 for Tanggu, and 0.96 for Penglai Gauge.
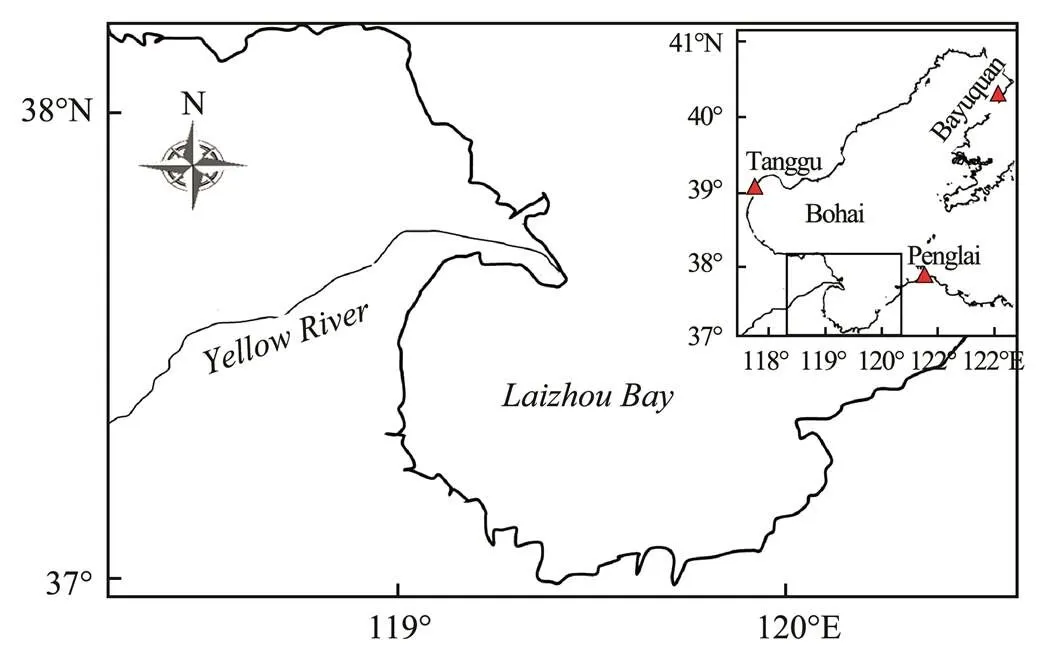
Fig.3 Calculation area of FVCOM and three gauge stations.
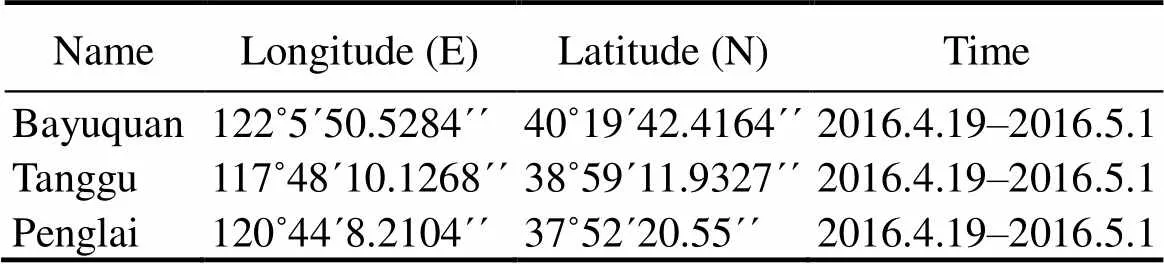
Table 1 Locations of gauge stations and comparison time
The annual temperature and salinity obtained from the control group are compared with the average measured data in Longkou station (Fig.5) to verify the accuracy of the model. For temperature, the model results effectively reflect the seasonal change trend. The temperature is the lowest in January or February in a year, and rises to the highest in August. Although the simulated temperature is slightly higher than the measured temperature in autumn, the overall descend trend from August to December is coincident. For salinity, the results of the model also reflect the seasonal fluctuation trend well, but the overall salinity is approximately 0.5 different from the measured data, and the simulated salinity begins to decrease after July, lagging behind the measured data by one month. In summary, the FVCOM model can accurately simulate the temperature and salinity in the Bohai Sea.
3 Result and Discussion
3.1 Change Characteristics of YR Runoff
The change of YR runoff into the sea in the past 70 years is shown in Fig.5. Referring to the research results of Fan(2009), this study adopted the non-parametric Mann-Kendall test method (Yue, 2002) to analyze the change rule of the YR runoff. Statistical and analysis results are reported in Table 2. As shown in Fig.6 and Table 1, the YR runoff is distributed unevenly throughout a year. The discharge mainly concentrates during the flood season. The average runoff in the flood season accounts for 59.53%, which is slightly smaller than the statistical results of Fan(2009), indicating that the proportion of runoff in the non-flood season increased slightly from 2007 to 2018.
The runoff fluctuated greatly from year to year. The maximum runoff was 973.07×10⁹m3in 1964, and the minimum was 18.61×10⁹m3in 1997, approximately 1/50 of the former. During the non-flood season, the change range of runoff is relatively small. The maximum runoff is 372.06×10⁹m3in 1964, and the minimum runoff is 12.40×10⁹m3in 2002, approximately 1/30 of the former. The YR runoff shows a decreasing trend at a significant level of α=0.95, with a range of −6.17×10⁹m3yr−1, and the decreasing range of runoff during the flood season (−3.96×10⁹m3yr−1) is larger than that during the non-flood season (−2.46×10⁹m3yr−1), accounting for 64.2% of the change throughout the year.
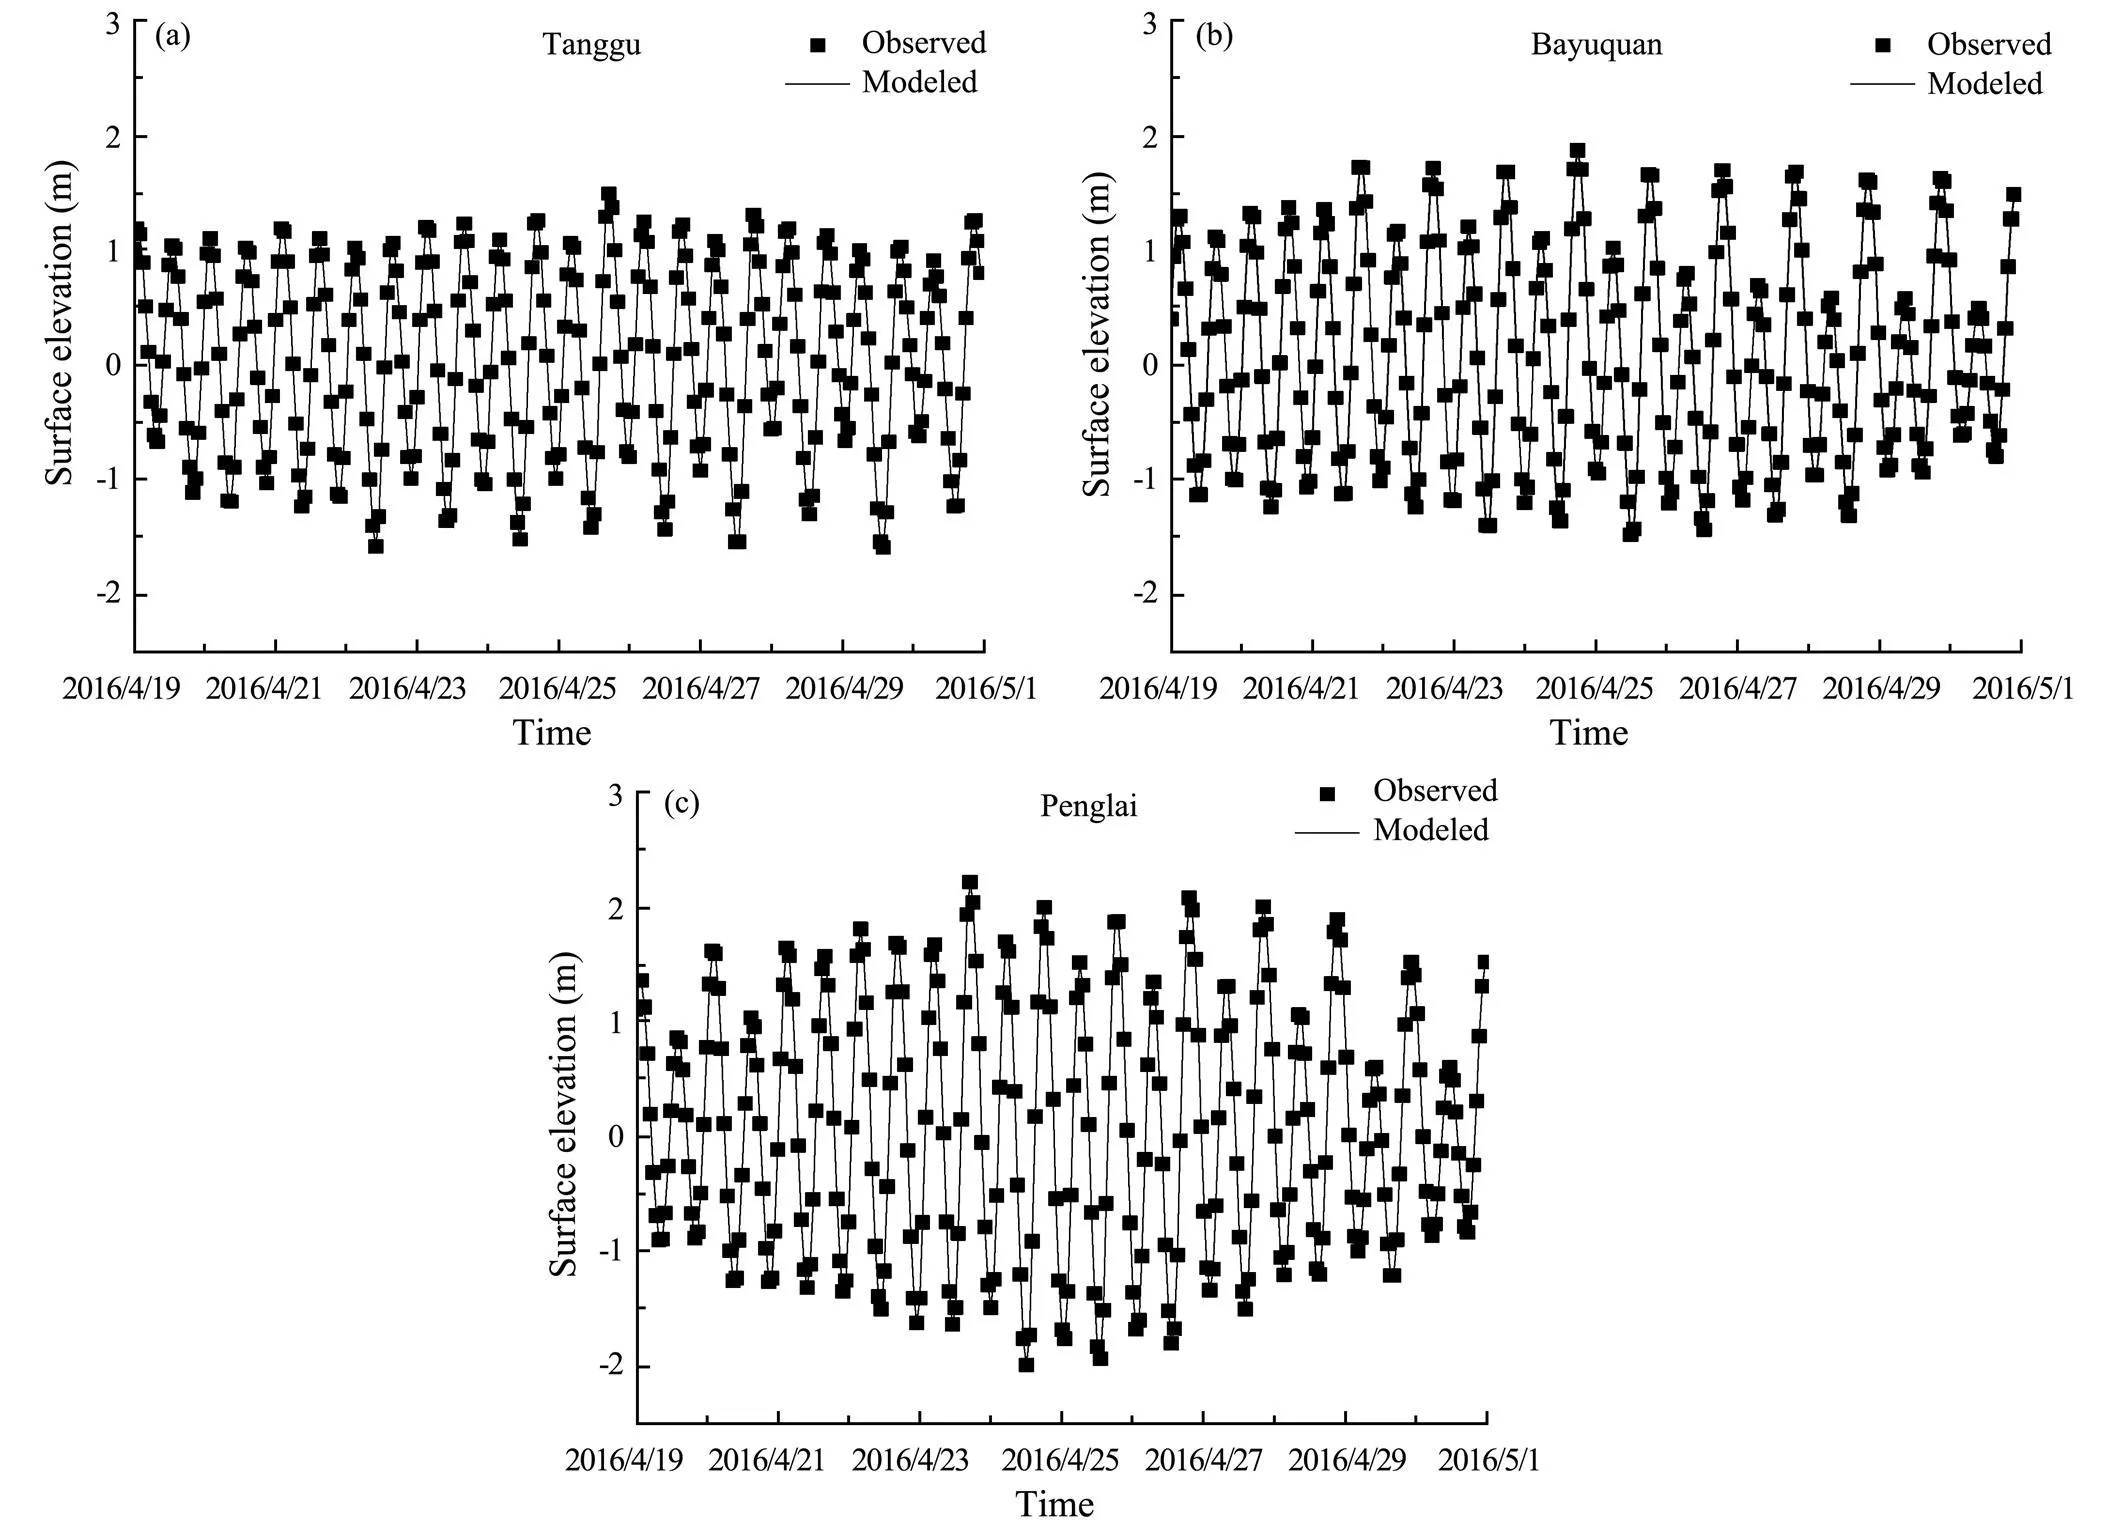
Fig.4 Comparison of water level in three gauge stations.
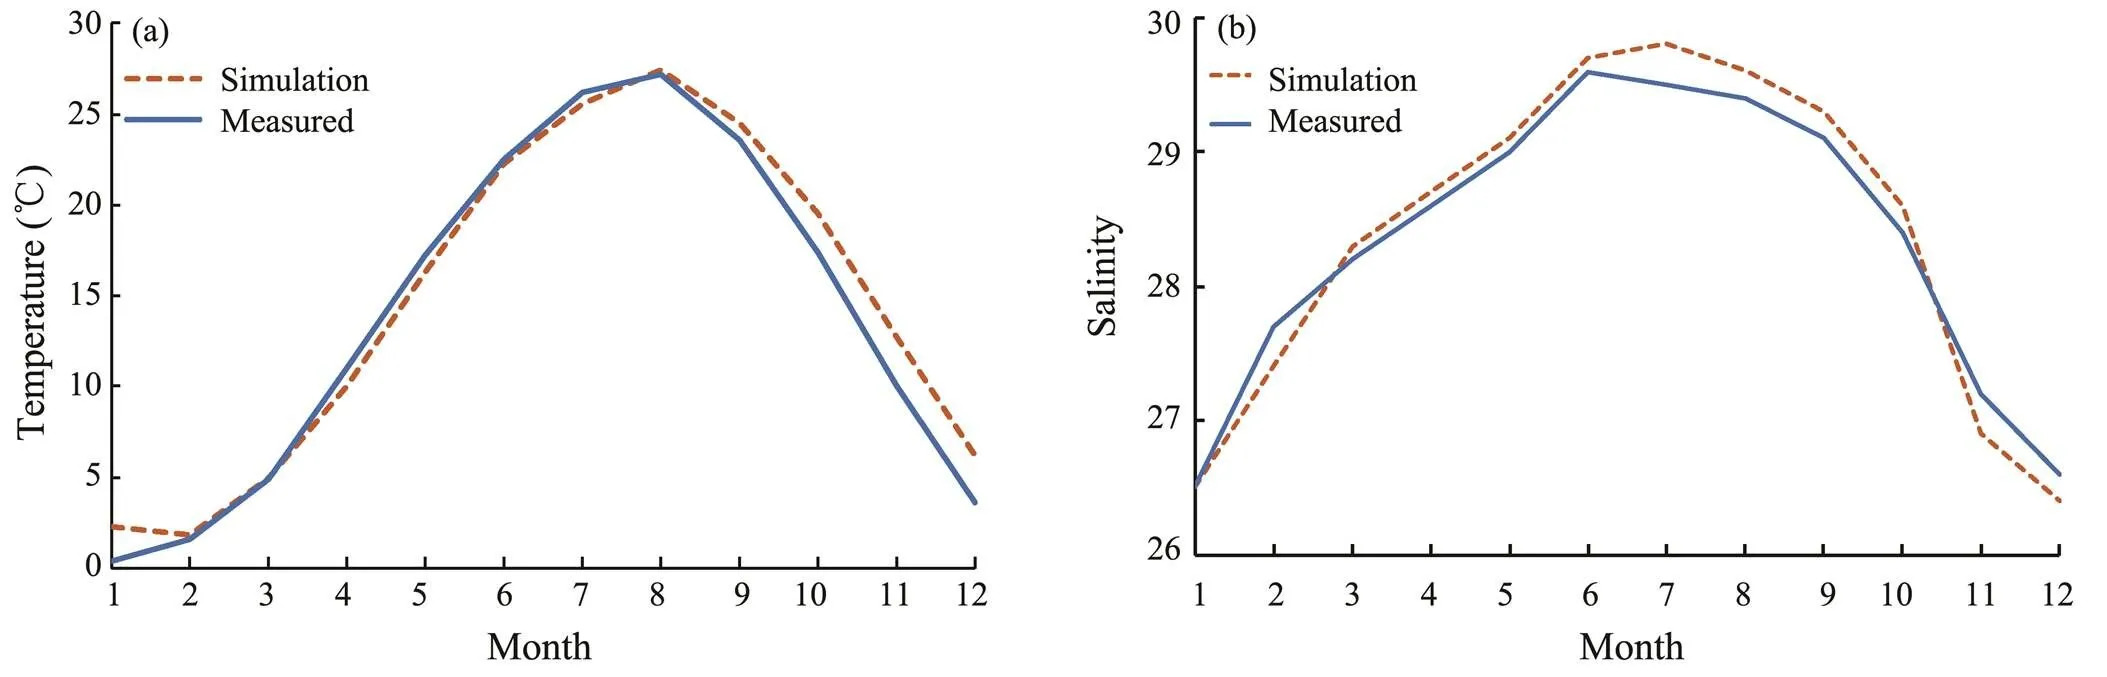
Fig.5 Comparison between simulated and measured temperature and salinity at Longkou station.
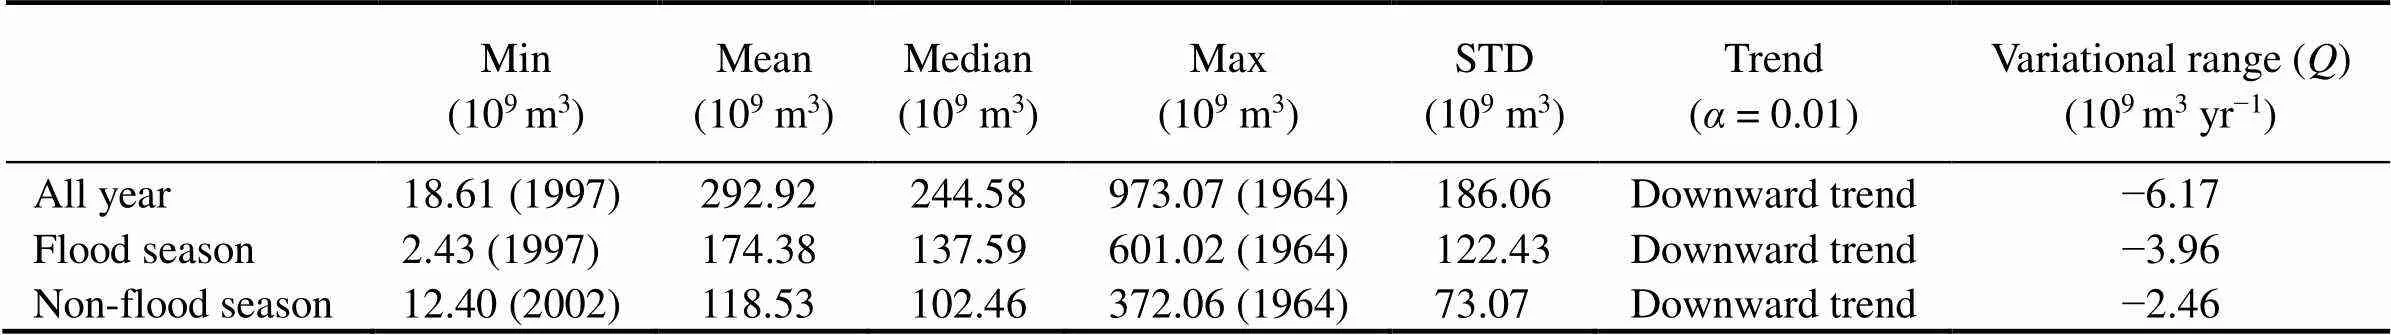
Table 2 Statistical characteristics of annual YR runoff at Lijin station (1950–2018)
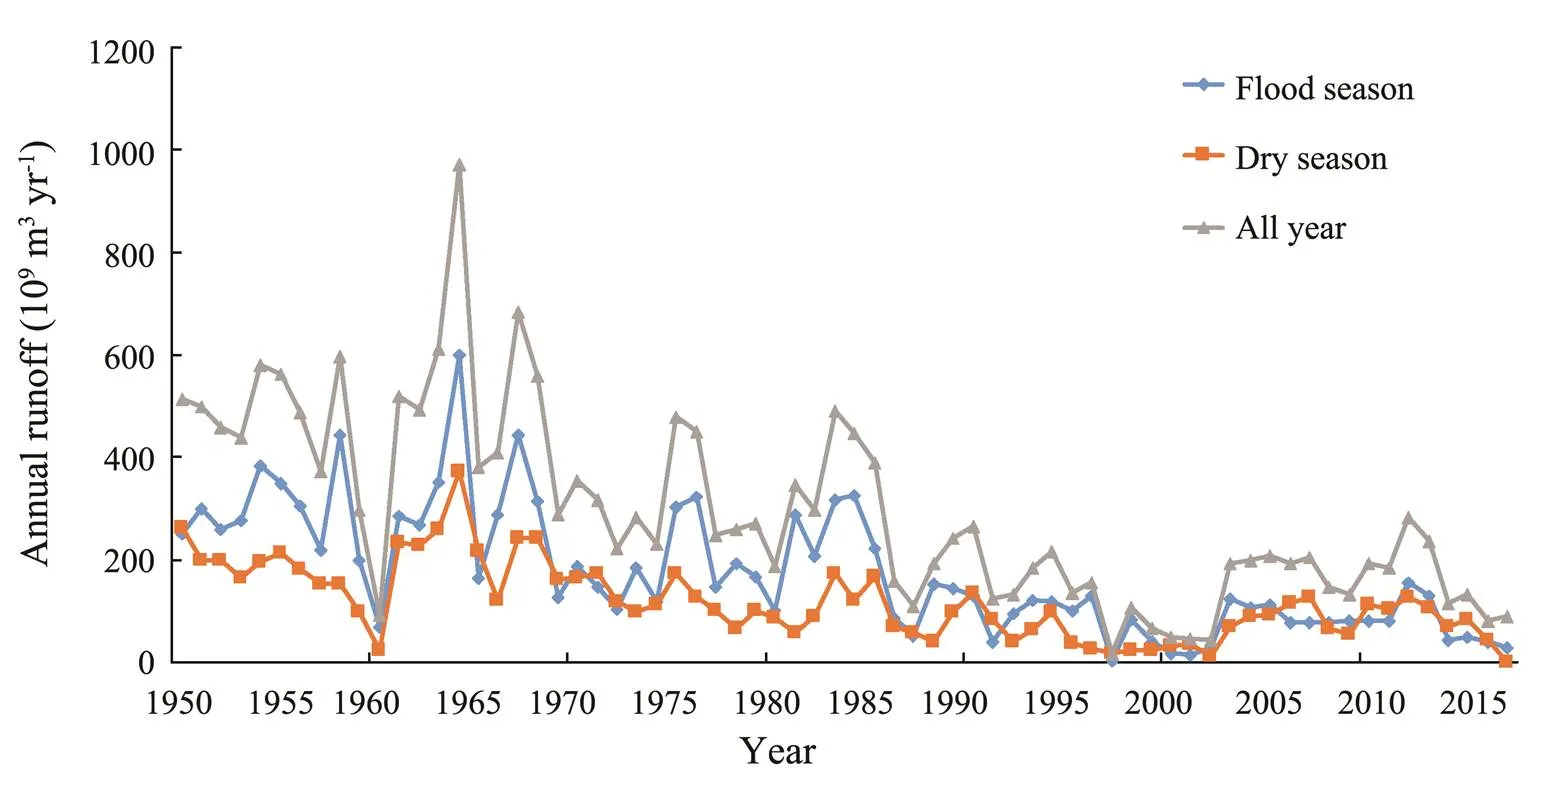
Fig.6 Changes in annual runoff at Lijin station of YR (1950–2018). The flood season occurs from July to October, and the non-flood season is from January to June, and November and December.
3.2 Effect of Runoff on Salinity in Laizhou Bay
3.2.1 Definition of low-salinity zone
For the low-salinity zone, different studies have differ- ent classification standards. In this paper, 28 salinity iso- line is taken as the outer boundary of the influence of YR diluted water, and 27 salinity isoline is taken as the core field. In addition, this study only conducts a qualitative analysis of the climate change of YR diluted water, which can be called average trend change.
3.2.2 Salinity change characteristics with control group in Laizhou Bay
The distribution of residual flows in Laizhou Bay is shown in Fig.7. In this bay, YR runoff strongly influences the water exchange. Freshwater can enter Laizhou Bay along the coast under the influence of the runoff (Fig.7b). Thus, the salinity of Laizhou Bay presents various distribution characteristics in different seasons.
The seasonal surface salinity distribution in Laizhou Bay is shown in Fig.8. In winter (February), Laizhou Bay is influenced by low coastal brine, which causes the low salinity (Song, 1990). During this time, the amount of YR runoff is extremely small, but a large low-salinity zone is found southwest of Laizhou Bay, and 27 salinity isoline occupies most of the bay. Simulation shows that the wide field of the low-salinity area almost exists from December to February or March, and this phenomenon is also mentioned in previous studies (Zhao, 1998). We need to study whether this phenomenon is due to the continuous effect of runoff in the previous year’s flood season or the influence of winter wind. In this study, we use the same model without wind field, and the results showed that the change in the 27 salinity isoline was not extremely large. Besides, only a small residual flow occurs in Laizhou Bay, and the water exchange is slow. Thus, we believe that the continuous effect of runoff in the previous year’s flood season caused the phenomenon in February. In spring (May), the high-salinity water extends from the northeast to the bay, and the entire Laizhou Bay shows high salinity in the east and low salinity in the west. The 27 salinity isoline roughly includes the western and southern areas of Laizhou Bay. At this time, the runoff of YR into the sea increases, and the low-salinity water began to extend outward. In summer (August), due to the increase of the runoff, the salinity in the estuary area drops greatly. The dilutive water (27 salinity isoline) presents two spreading directions: northeast and southeast. The salinity distribution characteristics that are high in the east and low in the west are more obvious. Due to the large evaporation and small freshwater volume in the summer, the salinity of the entire Laizhou Bay is relatively high. In autumn (October), the salinity is the lowest in the entire year, and the direction of YR diluted water is mainly southeast. Under the continuous influence of the abundant runoff of YR, the salinity distribution in the bay is still high in the east and low in the west, and the salinity in most areas of Laizhou Bay is lower than 27.0.
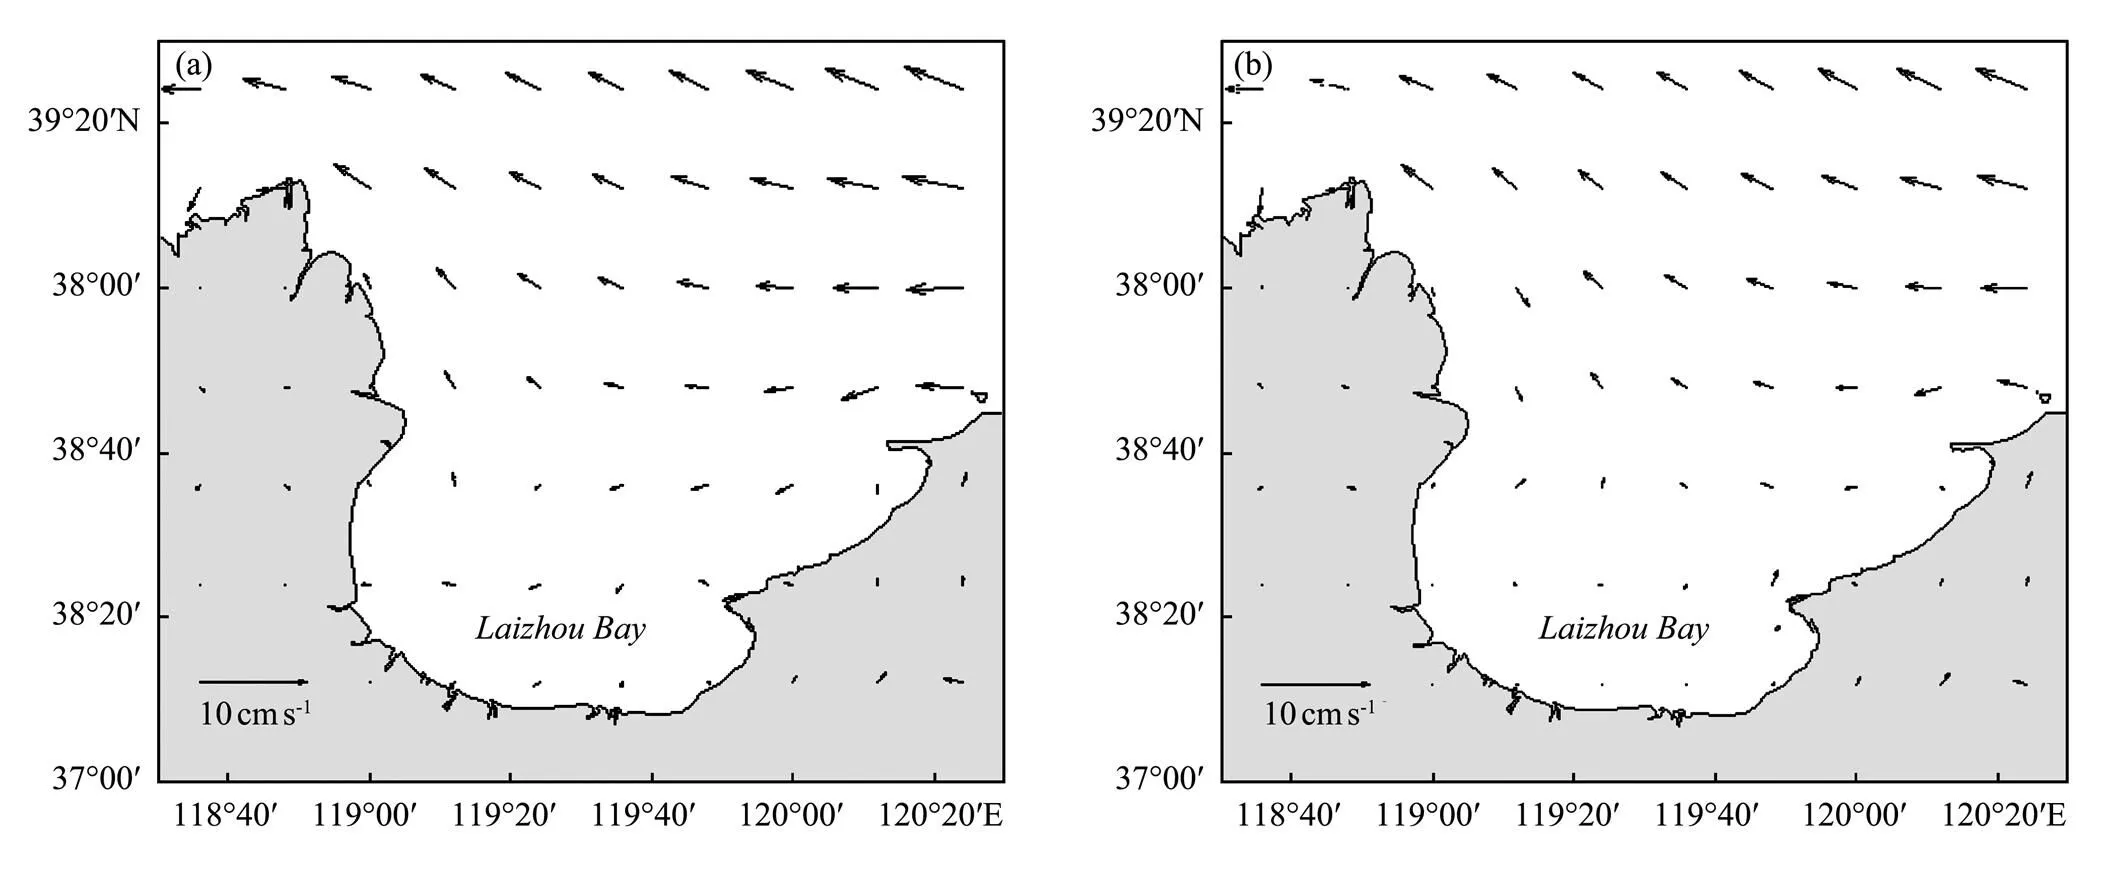
Fig.7 Distribution of residual flow in Laizhou Bay. (a), without runoff; (b), with runoff.
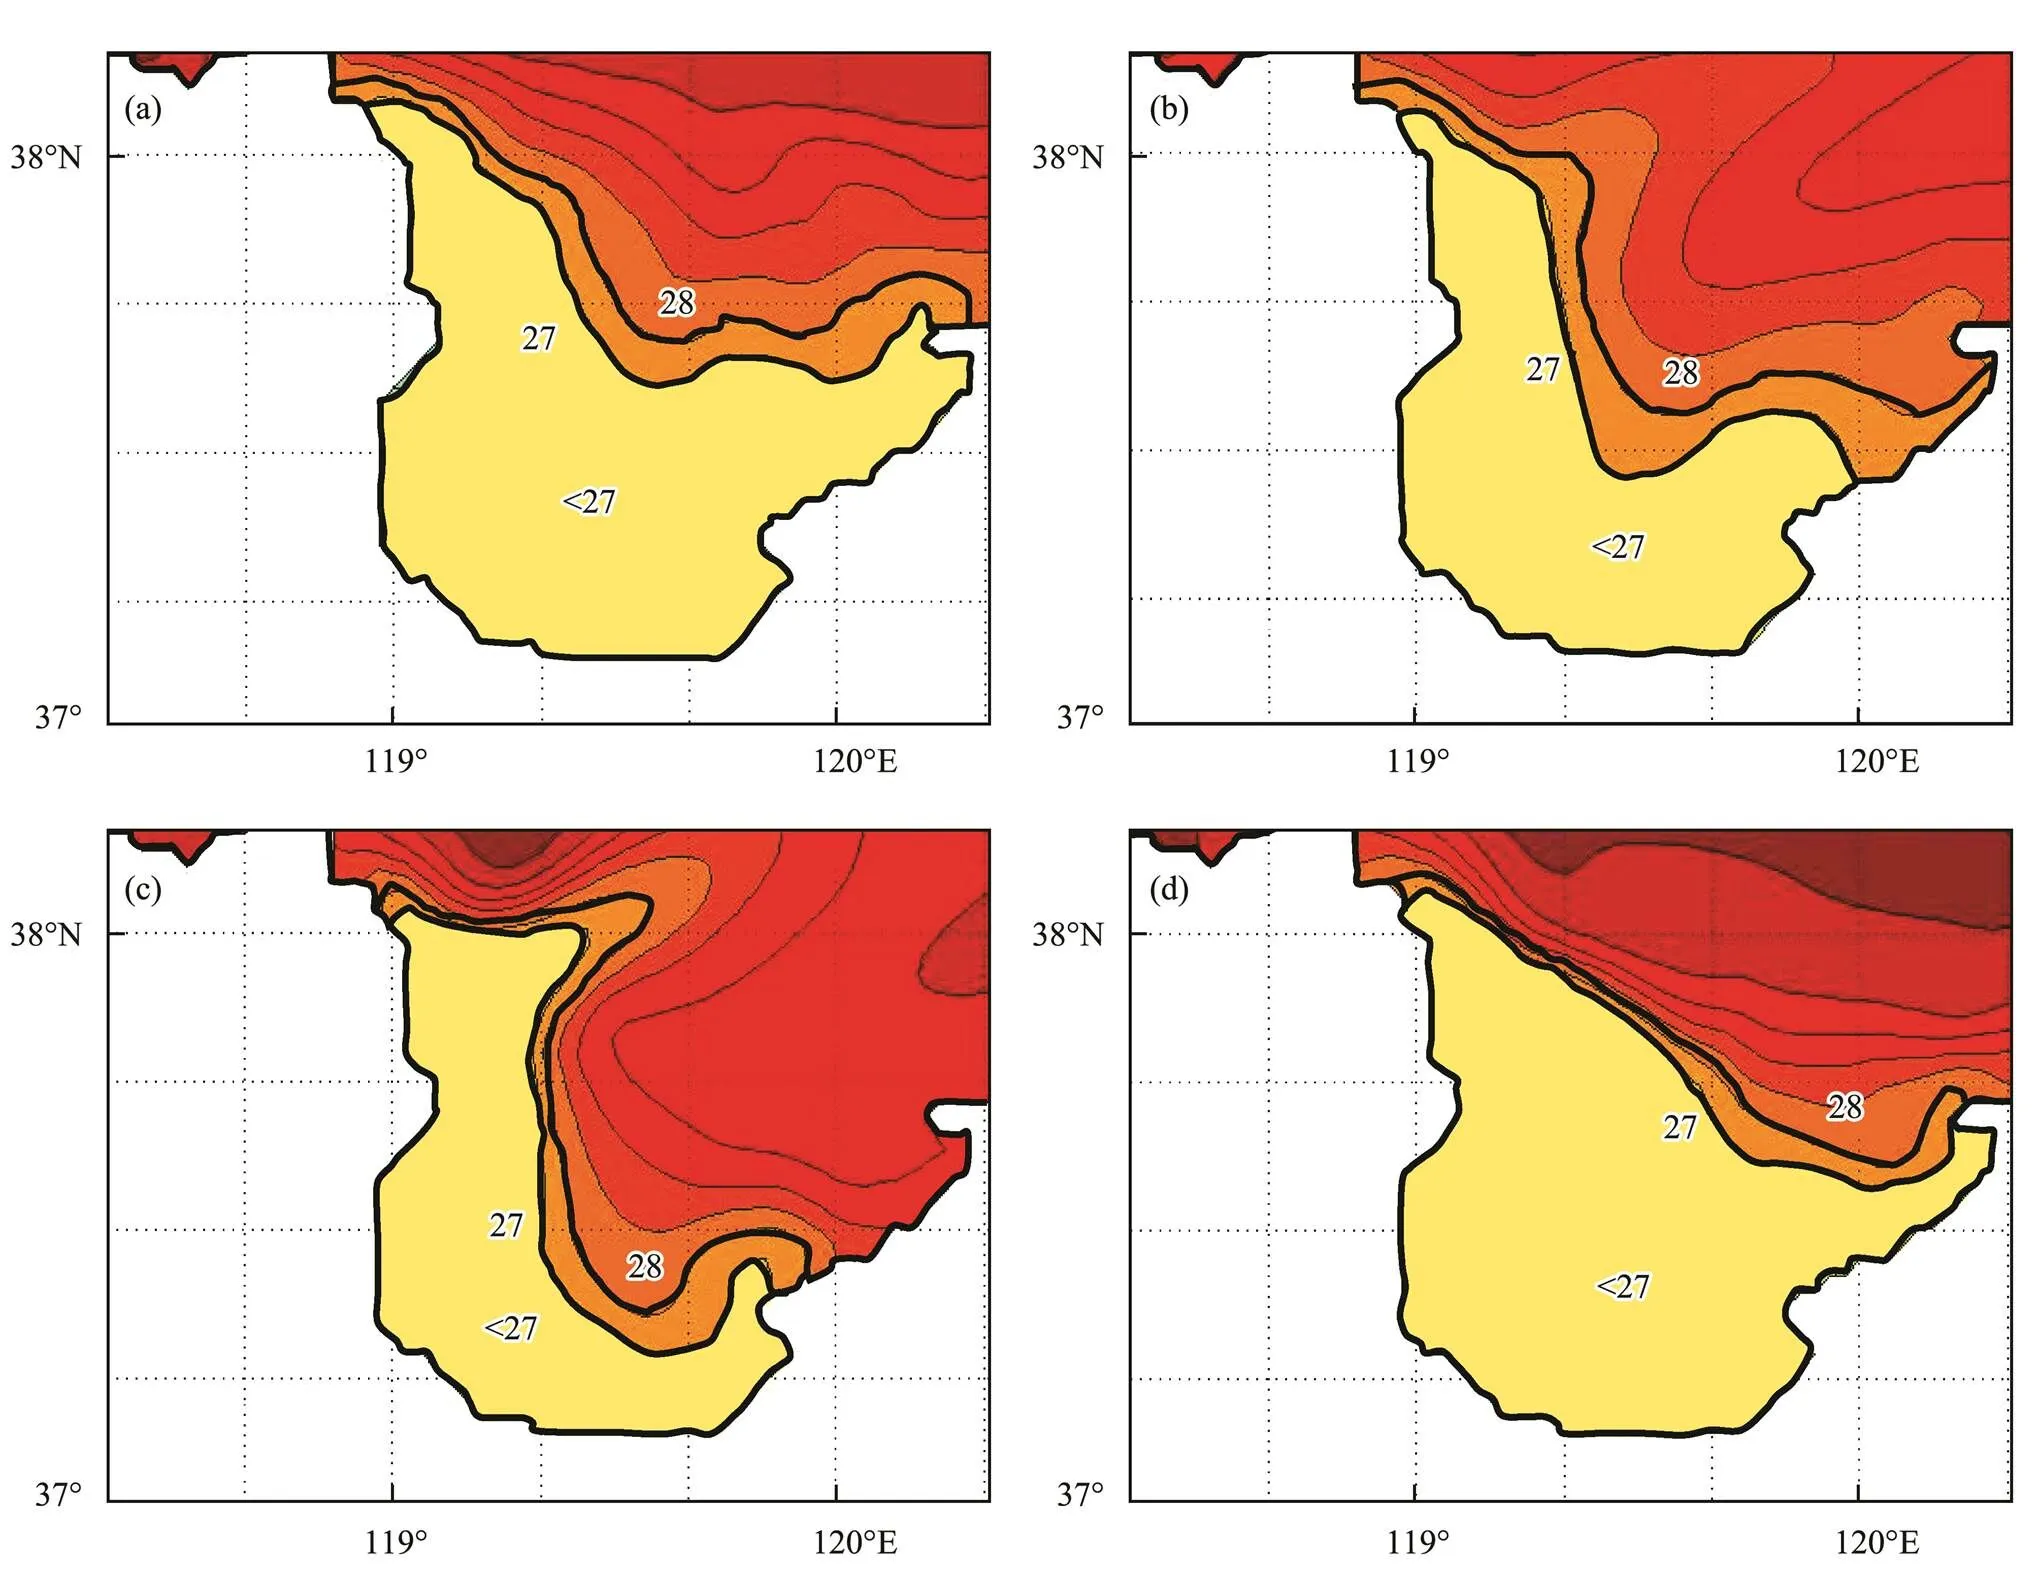
Fig.8 Surface salinity distribution of Laizhou Bay in February (a), May (b), August (c), and October (d).
3.2.3 Salinity change characteristics with experimental groups in Laizhou Bay
Among the three groups of data adopted in the model, Q1 differs slightly from Q2, and minimal difference is observed in the low-salinity area between them. However, Q3 reflects the sharp decline in YR runoff since the abrupt change point of 1985, which can better reflect the impact of the sharp decline of runoff on the low-salinity area in Laizhou Bay.
Taking the flood season (from July to October) as an example, we analyze the variation of the surface low-salinity area in Laizhou Bay under different runoff (Figs.9 and 10). In July, YR runoff into the sea increases. The dilutive water of YR begins to expand in two directions: northeast and southeast. During this period, the salinity distribution in Laizhou Bay is higher in the east and lower in the west. When the runoff decreases but not greatly, the phenomenon of the northeast extension becomes less obvious (Fig.9a). The salinity distribution only changes mini- mally. When the runoff into the sea drops significantly (Fig.10a), the scope of YR diluent water shrinks significantly, and the two spreading directions disappear. The low-salinity area only appears in the YR Estuary. In August, compared with the control group, the changes and differences of the low-salinity area are not obvious when the runoff changes minimally (Fig.9b), but the low-salinity area becomes smaller and is concentrated in the western coast of the bay when the runoff decreases significantly (Fig.10b). In September and October, due to the continuous effect of the runoff from YR into the sea, the low-salinity area expands, but it decreases correspondingly after the sharp decrease of runoff (Figs.10c–10d).
In the vertical distribution of salinity, the halocline in Laizhou Bay is obvious in summer, especially in the YR Estuary, which can reach above 1.0m−1. In this study, taking Q1 as an example (Fig.11), the maximum halocline obtained by simulation is 1.6m−1. In autumn, the intensity of the halocline decreased, but the maximum of salinity variation around the estuary remains above 1.0m−1. With the increase of water depth, the salinity gradually increases, especially in the YR Estuary where the maximum difference of salinity is 8 to 12 between surface and bottom.
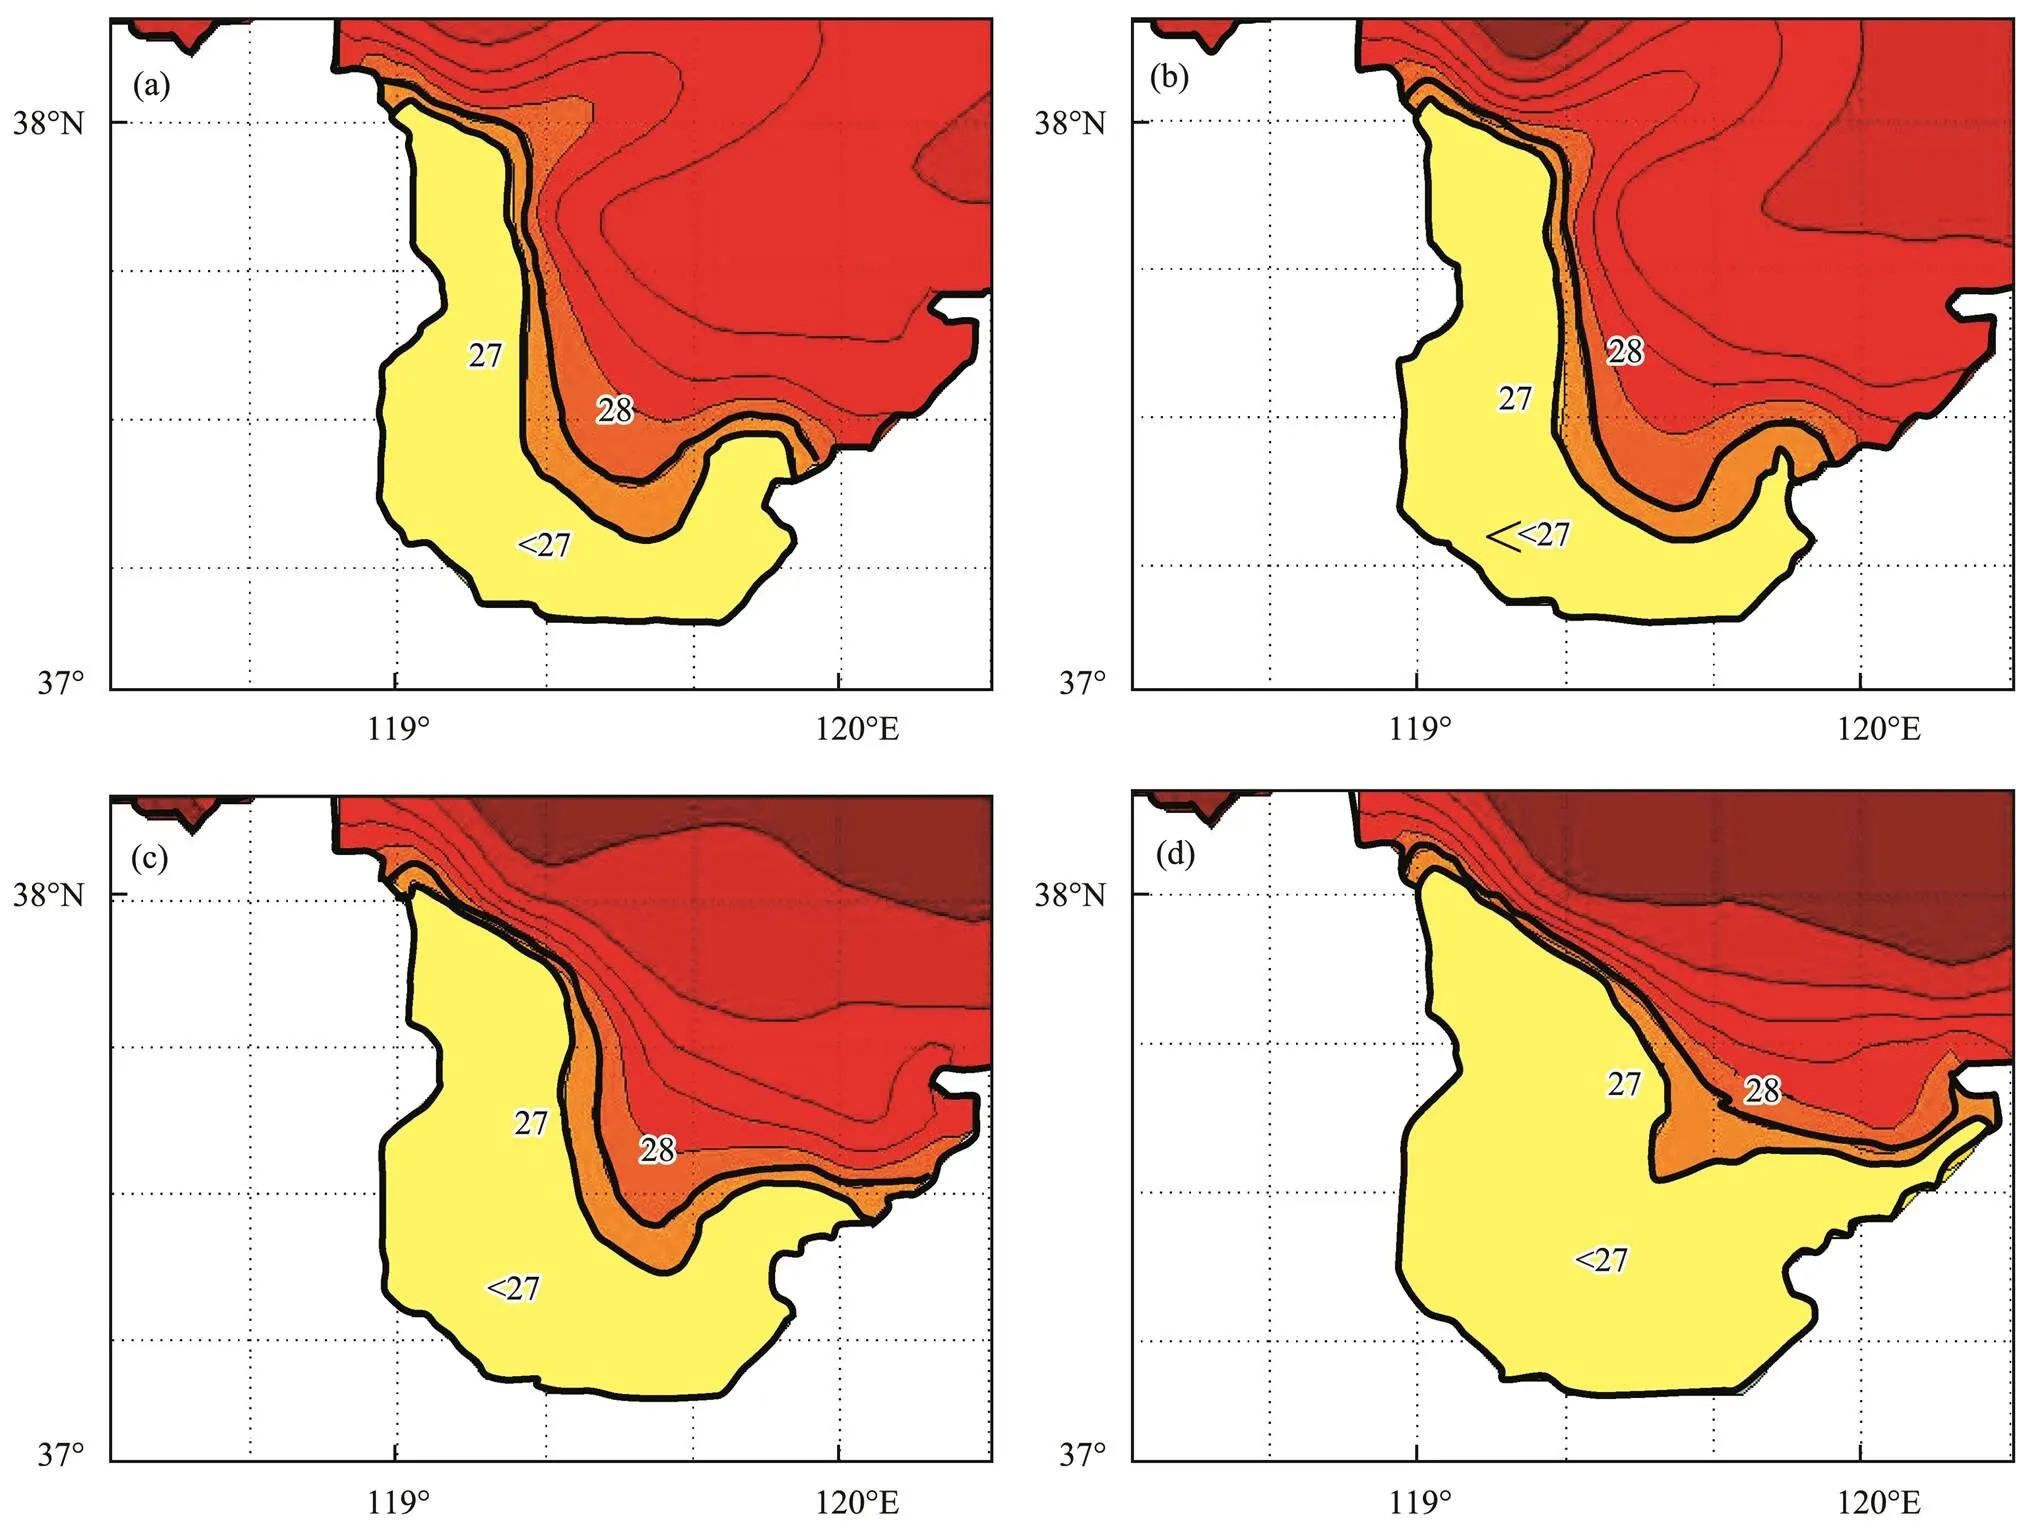
Fig.9 Changes in surface low-salinity area in Laizhou Bay from July to October (a, b, c, d) under Q2.
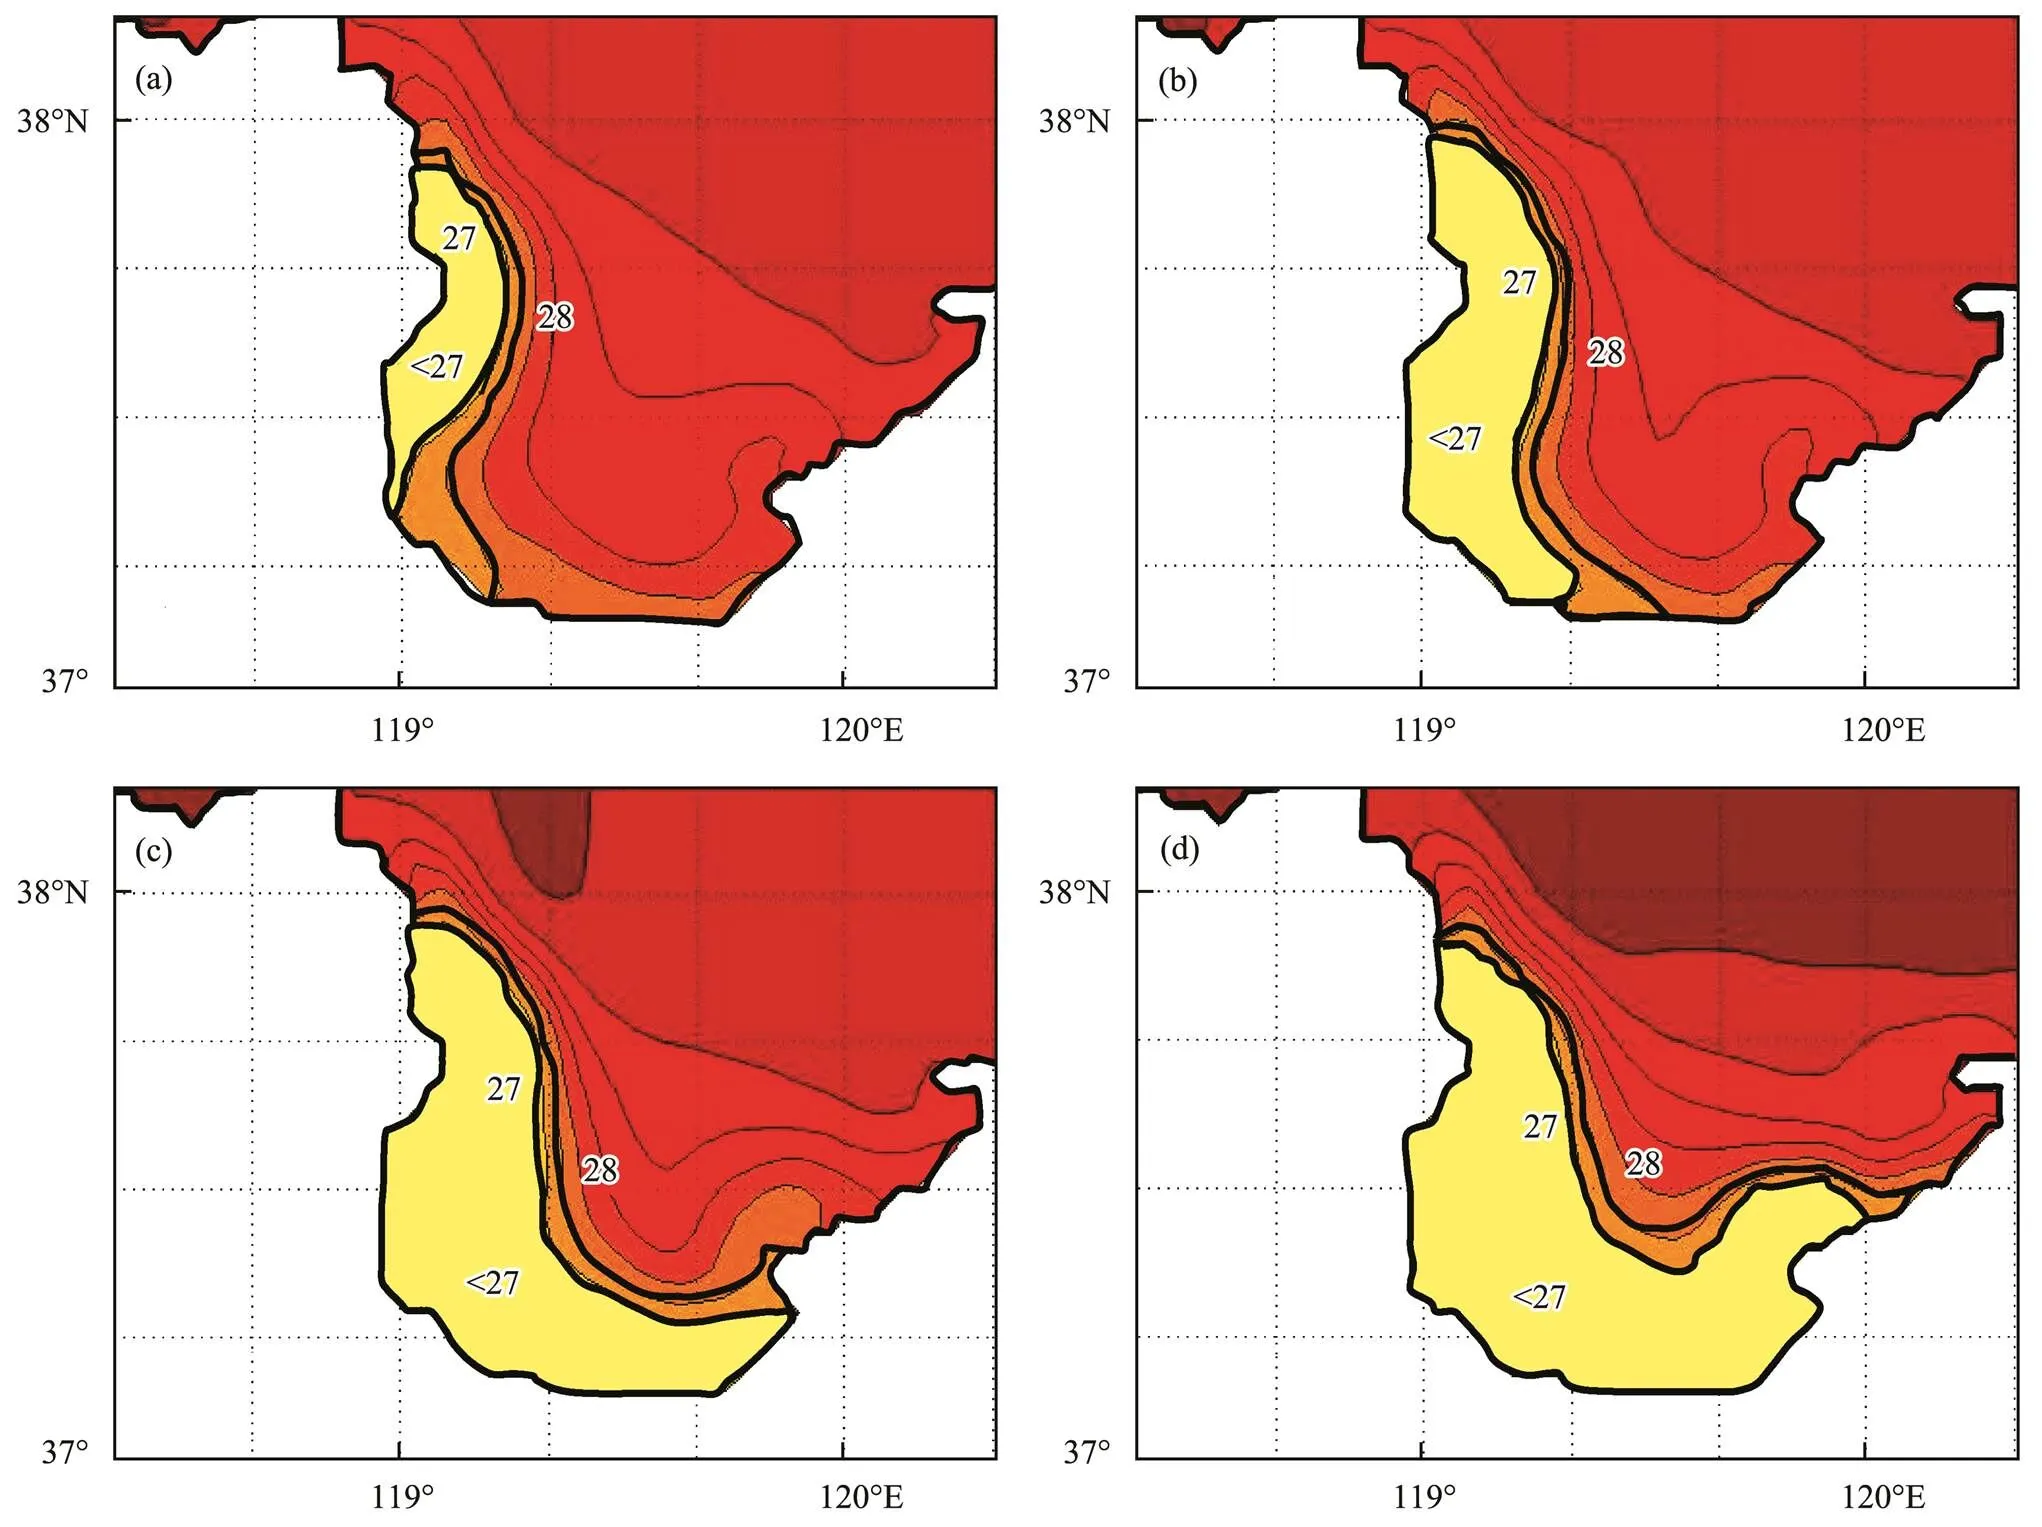
Fig.10 Changes in surface salinity of low-salinity area in Laizhou Bay from July to October (a, b, c, d) under Q3.
Fig.12 shows the change curve of salinity (a) near the YR Estuary (Figs.12a–12b), in the middle (Fig.12b) and (c), eastern (Fig.12c) of the Laizhou Bay under different runoffs. Due to the small runoff into the sea during the non-flood season of YR, the average salinity of Laizhou Bay shows an upward trend from January to June. Since July, YR begins to enter the flood season, and the amount of runoff entering the sea continues to increase, thereby resulting in a gradual reduction of salinity. A large runoff entering the sea means fast decline in salinity. By comparing the three salinity change curves of different sea areas in Fig.12, we can observe that the salinity change trend is coincident under different runoffs. When the YR runoff into the sea is the average of the measured runoff from 1950 to 1985, which is close to the YR runoff in the water-rich period of the 1950s and 1960s, the salinity of Laizhou Bay varies from 22 to 28. When the run off decreases sharply (average of measured runoff from 1986 to 1996), the salinity the bay increases to approximately 30.0. In general, the salinity changes with the change of the runoff, and the slope of salinity becomes very large when the amount of runoff entering the sea suddenly increases during the flood season.
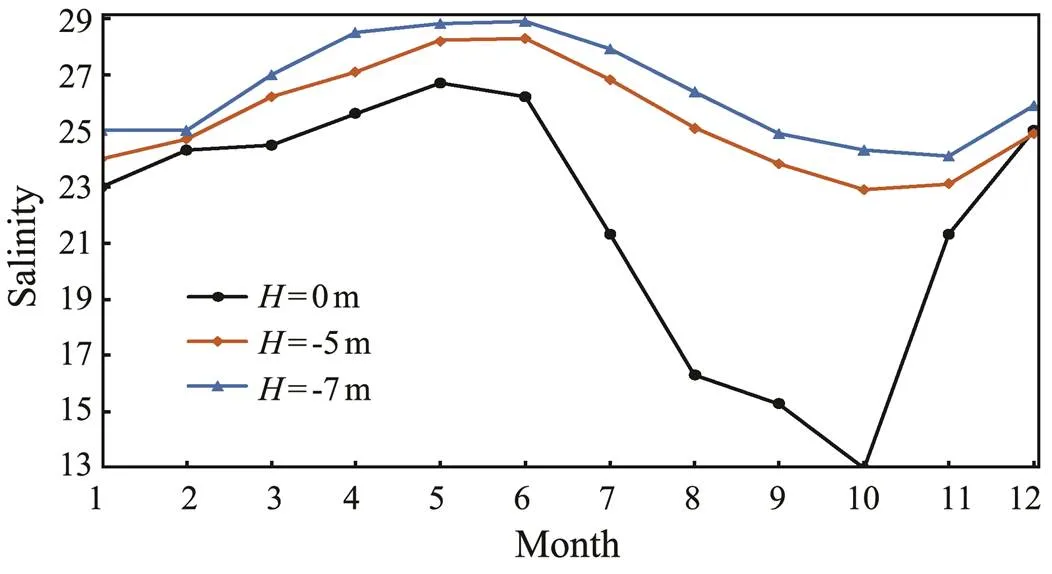
Fig.11 Curves of salinity at different depths near YR Estuary.
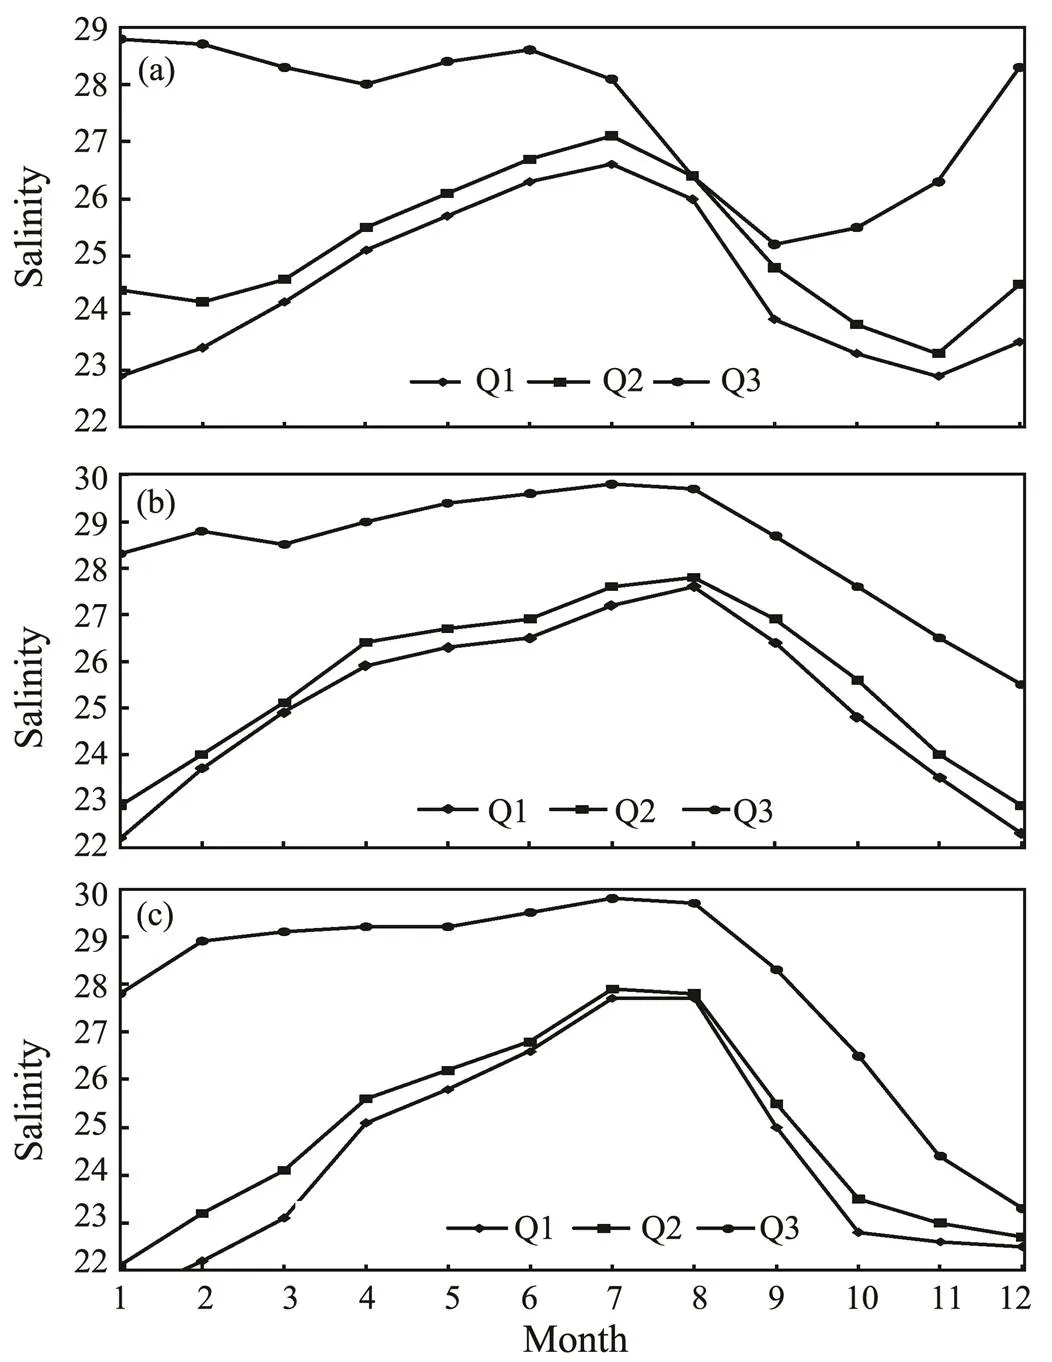
Fig.12 Change of average salinity (a) near YR Estuary, (b) in the middle, and (c) in the eastern part of Laizhou Bay under different runoffs.
Owing to the varying positions of the YR Estuary in different periods and the change of YR runoff entering Lai- zhou Bay, the results presented by this simulation may differ from the actual situation. This chapter only analyzes the influence of YR runoff on the salinity of Laizhou Bay, and finds that the salinity of Laizhou Bay quickly responds to the change of the runoff.
4 Conclusions
The YR runoff into the sea shows a trend of gradual decline, and the runoff is unevenly distributed within a year, showing obvious characteristics of drawdown and flooding periods. In recent years, under unified regulation by the state, YR has achieved continuous flow for 10 years and the amount of water flowing into the sea has increased compared with that in the 1990s. However, the decline trend of runoff has not changed.
The YR runoff shows a decreasing trend at a significant level of α=0.95, with a range of −6.17×10⁹m3yr−1, and the decreasing range of runoff during the flood season (−3.96×10⁹m3yr−1) is larger than that during the non-flood season (−2.46×10⁹m3yr−1), accounting for 64.2% of the change throughout a year.
The distribution of salinity in Laizhou Bay is high in the east and low in the west. The salinity of Laizhou Bay responds quickly to the change of the runoff from YR into the sea. In the vertical distribution, the halocline in Lai- zhou Bay is obvious in summer, especially in the YR Estuary, which can exceed 1.0m−1. Taking Q1 as an example, this study finds that the maximum halocline obtained by simulation is 1.6m−1. In autumn, the intensity of the halocline decreases, but the maximum of salinity variation around the estuary remains above 1.0m−1. With the increase of water depth, the salinity gradually increases, especially in the YR Estuary where the maximum difference of salinity is 8 to 12 between surface and bottom.
As the river with the largest runoff around the Bohai Sea, YR injects a large amount of freshwater and nutrients into the sea every year, forming a good environment suitable for biological growth and development. This condition makes the YR Estuary and its adjacent sea areas good for spawning, hatching, and fishing, especially in the Bohai and Laizhou bays. As one of the important environmental factors of fishery, salinity is bound to affect the development of fishery. The decrease of runoff into the sea weakens the power of low-salinity water along the coast. Moreover, the invasion of high-salinity water outside the sea greatly increases the salinity content of the fishing ground. Therefore, ensuring that the runoff into the Bohai Sea by YR does not decrease sharply is necessary to ensure the survival and reproduction of fish in the coastal waters of the YR Estuary.
Acknowledgements
This study is supported by the National Natural Science Foundation of China (Nos. U1706220, U1806227, U1906231, and 51909114), and the Natural Science Foundation of Shandong Province (No. ZR2019BD016).
Aoki, K., and Isobe, A., 2007. Application of finite volume coastal ocean model to hindcasting the wind-induced sea-level variation in Fukuoka Bay., 63: 333-339.
Beardsley, R. C., Limeburner, R., Yu, H., and Cannon, G. A., 1985. Discharge of the Changjiang (Yangtze River) into the East China Sea., 4: 57-76.
Burchard, H., 2002.. Springer, Berlin, 215pp.
Chao, S., 1988. River-forced estuarine plumes., 18: 72-88.
Chen, C., Beardsley, R. C., and Cowles, G., 2006.. 2nd editon. University of Massachusetts-Dartmouth, Technical Report 06-0602, New Bedford, MA, 315pp.
Chen, C., Liu, H., and Beardsley, R. C., 2003. An unstructured grid finite volume, three-dimensional, primitive equations ocean model: Application to coastal ocean and estuaries., 20 (1): 159-186.
Cheng, P., Wilson, R. E., Chant, R. J., Fugate, D. C., and Flood, R. D., 2009. Modeling influence of stratification on lateral circulation in a stratified Estuary., 39 (9): 2324-2337.
Fan, H., Liu, Y. X., and Huang, H. J., 2009. Long-term trend and change point analysis on runoff and sediment fluxes into the sea from the Yellow River during the period of 1950–2007., 2009 (5): 9-16 (in Chinese with English abstract).
Fang, G. H., Wang, K., Guo, F. Y., Wei, Z. X., Fan, W. J., Zhang, D. S., and Bi, J. S., 2002. Long-term changes and interrelations of annual variations of the hydrographical and meteorological parameters of the Bohai Sea during recent 30 years., 33 (5): 515-525 (in Chinese with English abstract).
Flores, R. P., Rijnsburger, S., Horner-Devine, A. R., Souza, A. J., and Pietrzak, J. D., 2017. The impact of storms and stratification on sediment transport in the Rhine region of freshwater influence., 122 (5): 4456-4477.
Fong, D., and Geyer, W., 2002. The alongshore transport of freshwater in a surface-trapped river plume., 32: 957-972.
García, B., Hickey, B. I., and Kawase, M., 2002. Influence of wind stress and ambient flow on a high discharge river plume., 107 (C9): 3130.
Garvine, R., 1987. Estuary plumes and fronts in shelf waters: A layer model., 17: 1877-1896.
Garvine, R., 1999. Penetration of buoyant coastal discharge onto the continental shelf: A numerical model experiment., 29: 1892-1909.
Garvine, R., 2001. The impact of model configuration in studies of buoyant coastal discharge., 59 (2): 193-225.
Gede, H. I., and Koji, A., 2004. Numerical study on tidal currents and seawater exchange in the Benoa Bay, Bali, Indonesia., 33: 90-100.
Hickey, B. M., Pietrafesa, L. J., Jay, D. A., and Boicourt, W. C., 1998. The Columbia River plume study: Substantial variability in the velocity and salinity field., 103 (C5): 10339-10368.
Li, C., Walker, N., Hou, A., Georgiou, I., Roberts, H., Laws, E., McCorquodale, J., Weeks, E., Li, X., and Crochet, J., 2008. Circular plumes in Lake Pontchartrain estuary under wind straining., 80 (1): 161-172.
Li, N., Lou, A. G., Zhang, X. Q., Liu, Y. L., and Wang, X. K., 2019. Three dimensional numerical simulation of temperature and salinity in the Bohai Sea based on MIKES., 2019 (2): 1-9 (in Chinese with English abstract).
Li, Y., and Liu, J., 2019. A numerical study on salinity stratification at the Oujiang River Estuary, China., 38 (11): 40-50.
Lin, W. B., Wang, Y. G., Ruan, X. H., and Xu, Q., 2012. Modeling residual circulation and stratification in Oujiang River Estuary., 26 (2): 351-362.
Manda, A., and Matsuoka, K., 2006. Changes in tidal currents in the ariake sound due to reclamation., 29 (4): 645.
Marques, W., Fernandes, E., Monteiro, I., and Möller, O., 2009. Numerical modeling of the Patos Lagoon coastal plume, Brazil., 29: 556-571.
Mellor, G. L., and Yamada, T., 1982. Development of a turbulence closure model for geophysical fluid problems., 20: 851-875.
Monismith, S. G., Burau, J. R., and Stacey, M. T., 1996. Stratification dynamics and gravitational circulation in northern San Francisco Bay. In:. Hollibaugh, T., ed., American Association for the Advancement of Science Pacific Division, Washington, D.C., 123pp.
Pang, J. Z., and Jiang, M. X., 2003. On the evolution of the Yellow River–I. Hydrographic characteristics., 2003 (3): 1-13 (in Chinese with English abstract).
Park, Y. G., Kim, H. Y., Hwang, J. H., Kim, T., and Park, S., 2014. Dynamics of dike effects on tidal circulation around Saemangeum, Korea., 102: 572-582.
Pietrzak, J. J., Jakobson, B., Burchard, H., Vested, H. J., and Petersen, O., 2002. A three-dimensional hydrostatic model for coastal and ocean modeling using a generalized topography following coordinate system., 4: 173-205.
Song, W. X., Jiang, T. L., and Liu, J. J., 1990. Temperature and salinity characteristics in Laizhou Bay., 8 (4): 41-46.
Takano, K., 1955. A complementary note on the diffusion of the seaward flowing off the mouth., 11: 147-149.
Wang, D., Shao, S. D., Li, S. W., Shi, Y., Arikawa, T., and Zhang, H. Q., 2018a. 3D ISPH erosion model for flow passing a vertical cylinder., 78: 374-399.
Wang, Y. M., Gao, P., Mu, X. M., and Zhao, G. J., 2018b. Relationship between the shape of the Yellow River delta and the runoff-sediment flux since 1973., 43 (5): 39-45 (in Chinese with English abstract).
Whitney, M., and Garvine, R., 2006. Simulating the Delaware Bay buoyant outflow: Comparison with observations., 36: 3-21.
Wu, D. X., Mou, L., Li, Q., Bao, X. W., and Wan, X. Q., 2004. Characteristics of long-term salinity variation in Bohai Sea and possible leading factors., 14 (2): 191-195 (in Chinese with English abstract).
Xia, M., Xie, L., and Pietrafesa, L. J., 2007. Modeling of the Cape Fear River estuary plume., 30 (4): 698-709.
Xia, M., Xie, L., Pietrafesa, J., and Whitney, M. M., 2011. The ideal response of a Gulf of Mexico estuary plume to wind forcing: Its connection with salinity flux and a Lagrangian view., 116: 1-14.
Yahya Surya, M., He, Z., Xia, Y., and Li, L., 2019. Impacts of sea level rise and river discharge on the hydrodynamics characteristics of Jakarta Bay (Indonesia)., 11 (7): 1384.
Yan, M., He, L., Wang, Y. J., Liu, W., Wang, S. J., Pei, L., Zheng, M. G., and Sun, L. Y., 2019. Temporal and spatial variation of flood-conveying and sediment transporting capacity of the lower reaches of the Yellow River during 1950–2015., 26 (4): 1-7 (in Chinese with English abstract).
Yue, S., Pilon, P., and Cavadias, G., 2002. Power of the Mann-Kendall and Spearman’s rho tests for detecting monotonic trends in hydrological series., 259 (1): 254-271.
Zeng, M., Sun, X. G., and Fan, D. J., 2017. Numerical simulating on sediment transportation in the estuary and its adjacent areas during the water and sediment regulation period of the Yellow River., 47 (4): 81-92 (in Chinese with English abstract).
Zhang, H. L., Yang, J. Q., and Cui, W. L., 2006. Status of salinity changes and the effect on marine environments and ecosystem in Laizhou Bay., 25 (Supp.1): 11-14 (in Chinese with English abstract).
Zhao, J. P., Shi, M. C., and Li, S. X., 1998. Characteristics of salinity in low salinity zone and Bohai Sea., 40: 249-258 (in Chinese with English abstract).
Zhao, P., Jiang, W. S., Mao, X. Y., Gao, H. W., and Guo, X. Y., 2010. Salinity changes and influencing factor in the Laizhou Bay from 2000 to 2005., 41 (1): 12-23 (in Chinese with English abstract).
. Tel: 0086-535-6651761
E-mail: hyshi@ldu.edu.cn
December 2, 2019;
February 25, 2020;
March 8, 2020
(Edited by Xie Jun)
杂志排行
Journal of Ocean University of China的其它文章
- Numerical Simulation and Risk Analysis of Coastal Inundation in Land Reclamation Areas: A Case Study of the Pearl River Estuary
- Cold Water in the Lee of the Batanes Islands in the Luzon Strait
- Preliminary Design of a Submerged Support Structure for Floating Wind Turbines
- Inversion of Oceanic Parameters Represented by CTD Utilizing Seismic Multi-Attributes Based on Convolutional Neural Network
- Trace-Norm Regularized Multi-Task Learning for Sea State Bias Estimation
- 11000-Year Record of Trace Metals in Sediments off the Southern Shandong Peninsula in the South Yellow Sea