Radiomics of rectal cancer for predicting distant metastasis and overall survival
2020-10-29MouLiYuZhouZhuYongChangZhangYuFengYueHaoPengYuBinSong
Mou Li, Yu-Zhou Zhu, Yong-Chang Zhang, Yu-Feng Yue, Hao-Peng Yu, Bin Song
Abstract
Key words: Radiomics; Rectal cancer; Overall survival; Distant metastasis; Computed tomography
INTRODUCTION
More than 1.8 million cases of colorectal cancer were diagnosed in 2018 worldwide, making it the third most prevalent malignancy around the world. In terms of morbidity, colorectal cancer accounts for approximately 9.2% of cancer-related deaths worldwide, similar to that of stomach and liver cancer[1]. In up to 70% of patients with rectal cancer (RC), surgical removal of the primary tumor is successful. However, local recurrence and distant metastases are commonly detected in approximately 30% of RC patients, often within 3 years after surgery[2-4]. The overall prognosis becomes poor once distant metastases have developed, thus demonstrating the importance of prompt diagnosis and treatment of RC[5]. Some patients may be at a higher risk of developing adverse outcomes post-surgery. In these patients, alternative and adjunctive therapies, such as chemotherapy, radiotherapy, or other targeted therapies, may be needed to minimize the risk of developing distant metastases[6]. Hence, improved patient outcomes may be feasible by identifying unfavorable prognostic characteristics that could hinder the overall survival of patients. In return, personalized treatment strategies could be implemented to achieved improved outcomes in patients with RC[7]. Recently, the American Society of Clinical Oncology guidelines outlined the need for newer surveillance technologies to better characterize and detect rectal tumors during the early stages of the disease, which could aid in risk stratification and subsequent surveillance[8].
Currently, there is no universal list of clinicoradiologic prognostic factors used for the detection of RC patients more likely to benefit from treatment. While the TNM classification system is widely utilized for staging cancer in the clinic, it has certain pitfalls that limit its clinical utility in RC[9]. While TNM considers the degree of cancer invasion, the involvement of surrounding lymph nodes, and metastatic spread of the tumor[10], it does not consider the importance of spatial heterogeneity. Spatial heterogeneity is an important characteristic of RC, as it indicates high cell density, hemorrhage, and necrosis[11].
Radiomics can provide a comprehensive overview of intratumor heterogeneity by extracting multiple quantitative features from medical images. A wide array of parameters can be utilized to assess and quantify the degree of heterogeneity at relevant scales, such as skewness, entropy, kurtosis, and uniformity. Radiomic analysis has been successfully utilized to predict survival outcomes in other diseases[12-14]. When integrated with the clinicopathologic features, the radiomics signature is superior to that of a single biomarker, in terms of prognostic value[15-17]. Hence, in the current study, the aim was to compare the predictive abilities, in terms of distant metastases and 3-year OS, of a radiomics signature and clinicoradiologic risk model in patients with RC.
MATERIALS AND METHODS
Patients
This study was approved by the medical ethics committee of our institution (No. 2019-1159; date: December 26, 2019). Patient approval or informed consent for the review of medical images was waived by the committee due to the retrospective nature of the study.
The primary cohort of this study comprised an evaluation of the institutional database for medical records from October 2012 to December 2015 to identify patients with histologically-confirmed RC, who underwent curative surgery alone. A total of 148 patients (76 males and 72 females; mean age: 59.7 ± 11.7 years; age range: 27-94 years) were enrolled in our study according to the following inclusion criteria: (1) Patients with histologically-confirmed rectal adenocarcinoma who were treated with curative resection alone; (2) Preoperative enhanced computed tomography (CT) was performed within 1 mo before resection; (3) Follow-up was conducted for at least 3 years; and (4) T-stage, N-stage, and tumor grade were confirmed by pathology. The exclusion criteria were as follows: (1) Patients who received neoadjuvant or postoperative chemoradiotherapy; (2) Patients who presented distant metastasis at the time of diagnosis; (3) Patients who failed to undergo follow-up; (4) Lack of preoperative CT images; and (5) Poor CT image quality. The patients were allocated to a training or validation set at a ratio of 7:3, based on the scanning date. The early data before the 70thpercentile scanning date were allocated to the training set, while the other data were allocated to the validation set. The patient recruitment pathway is shown in Figure 1.
The baseline clinical characteristics and pathological data of each patient, including age, sex, tumor size on CT, pathological TNM stage, histological grade, antigen Ki-67, circumferential resection margin, number of distant metastasis, and follow-up time were all derived from medical records, as shown in Table 1.
这一期,我们来学习古诗文的第九个字——理。说起古诗文,人们大多感受明显的是儿女情长,其实,在古诗文中也有很多哲理的闪光。只是其中需要更高的思想素养才能发掘,让我们一起来发掘一下古诗文中的哲理。
CT examinations
Enhanced CT was performed using a 128-channel multidetector CT scanner (Simens, SOMATOM Definition AS+) with the following scanning parameters: Tube voltage of 120 kV, tube current of 200-210 mA, and slice thickness of 2.0 mm. With the mass injection (dose: 1.2 mL/kg; injection rate: 3 mL/s) of iodine contrast agent (300 mg/mL), the portal venous phase images (30 s after the trigger) were obtained.
Reference standard for pathology
All 148 patients had histopathologically-verified RC, which was diagnosed with resected surgical specimens. The pathological confirmatory report was acquired from electronic medical records. Samples were processed using standard procedures, fixed in formalin, embedded in paraffin, and stained with hematoxylin and eosin (HE).
Follow-up
All patients were followed for at least 3 years after surgery (3-mo intervals in the first year; every 6 mo in the following 2 years). The minimum postoperative follow-up period was 1 mo for metastasis (three cases had liver, lung, and bone metastases,respectively), and 11 mo for OS.
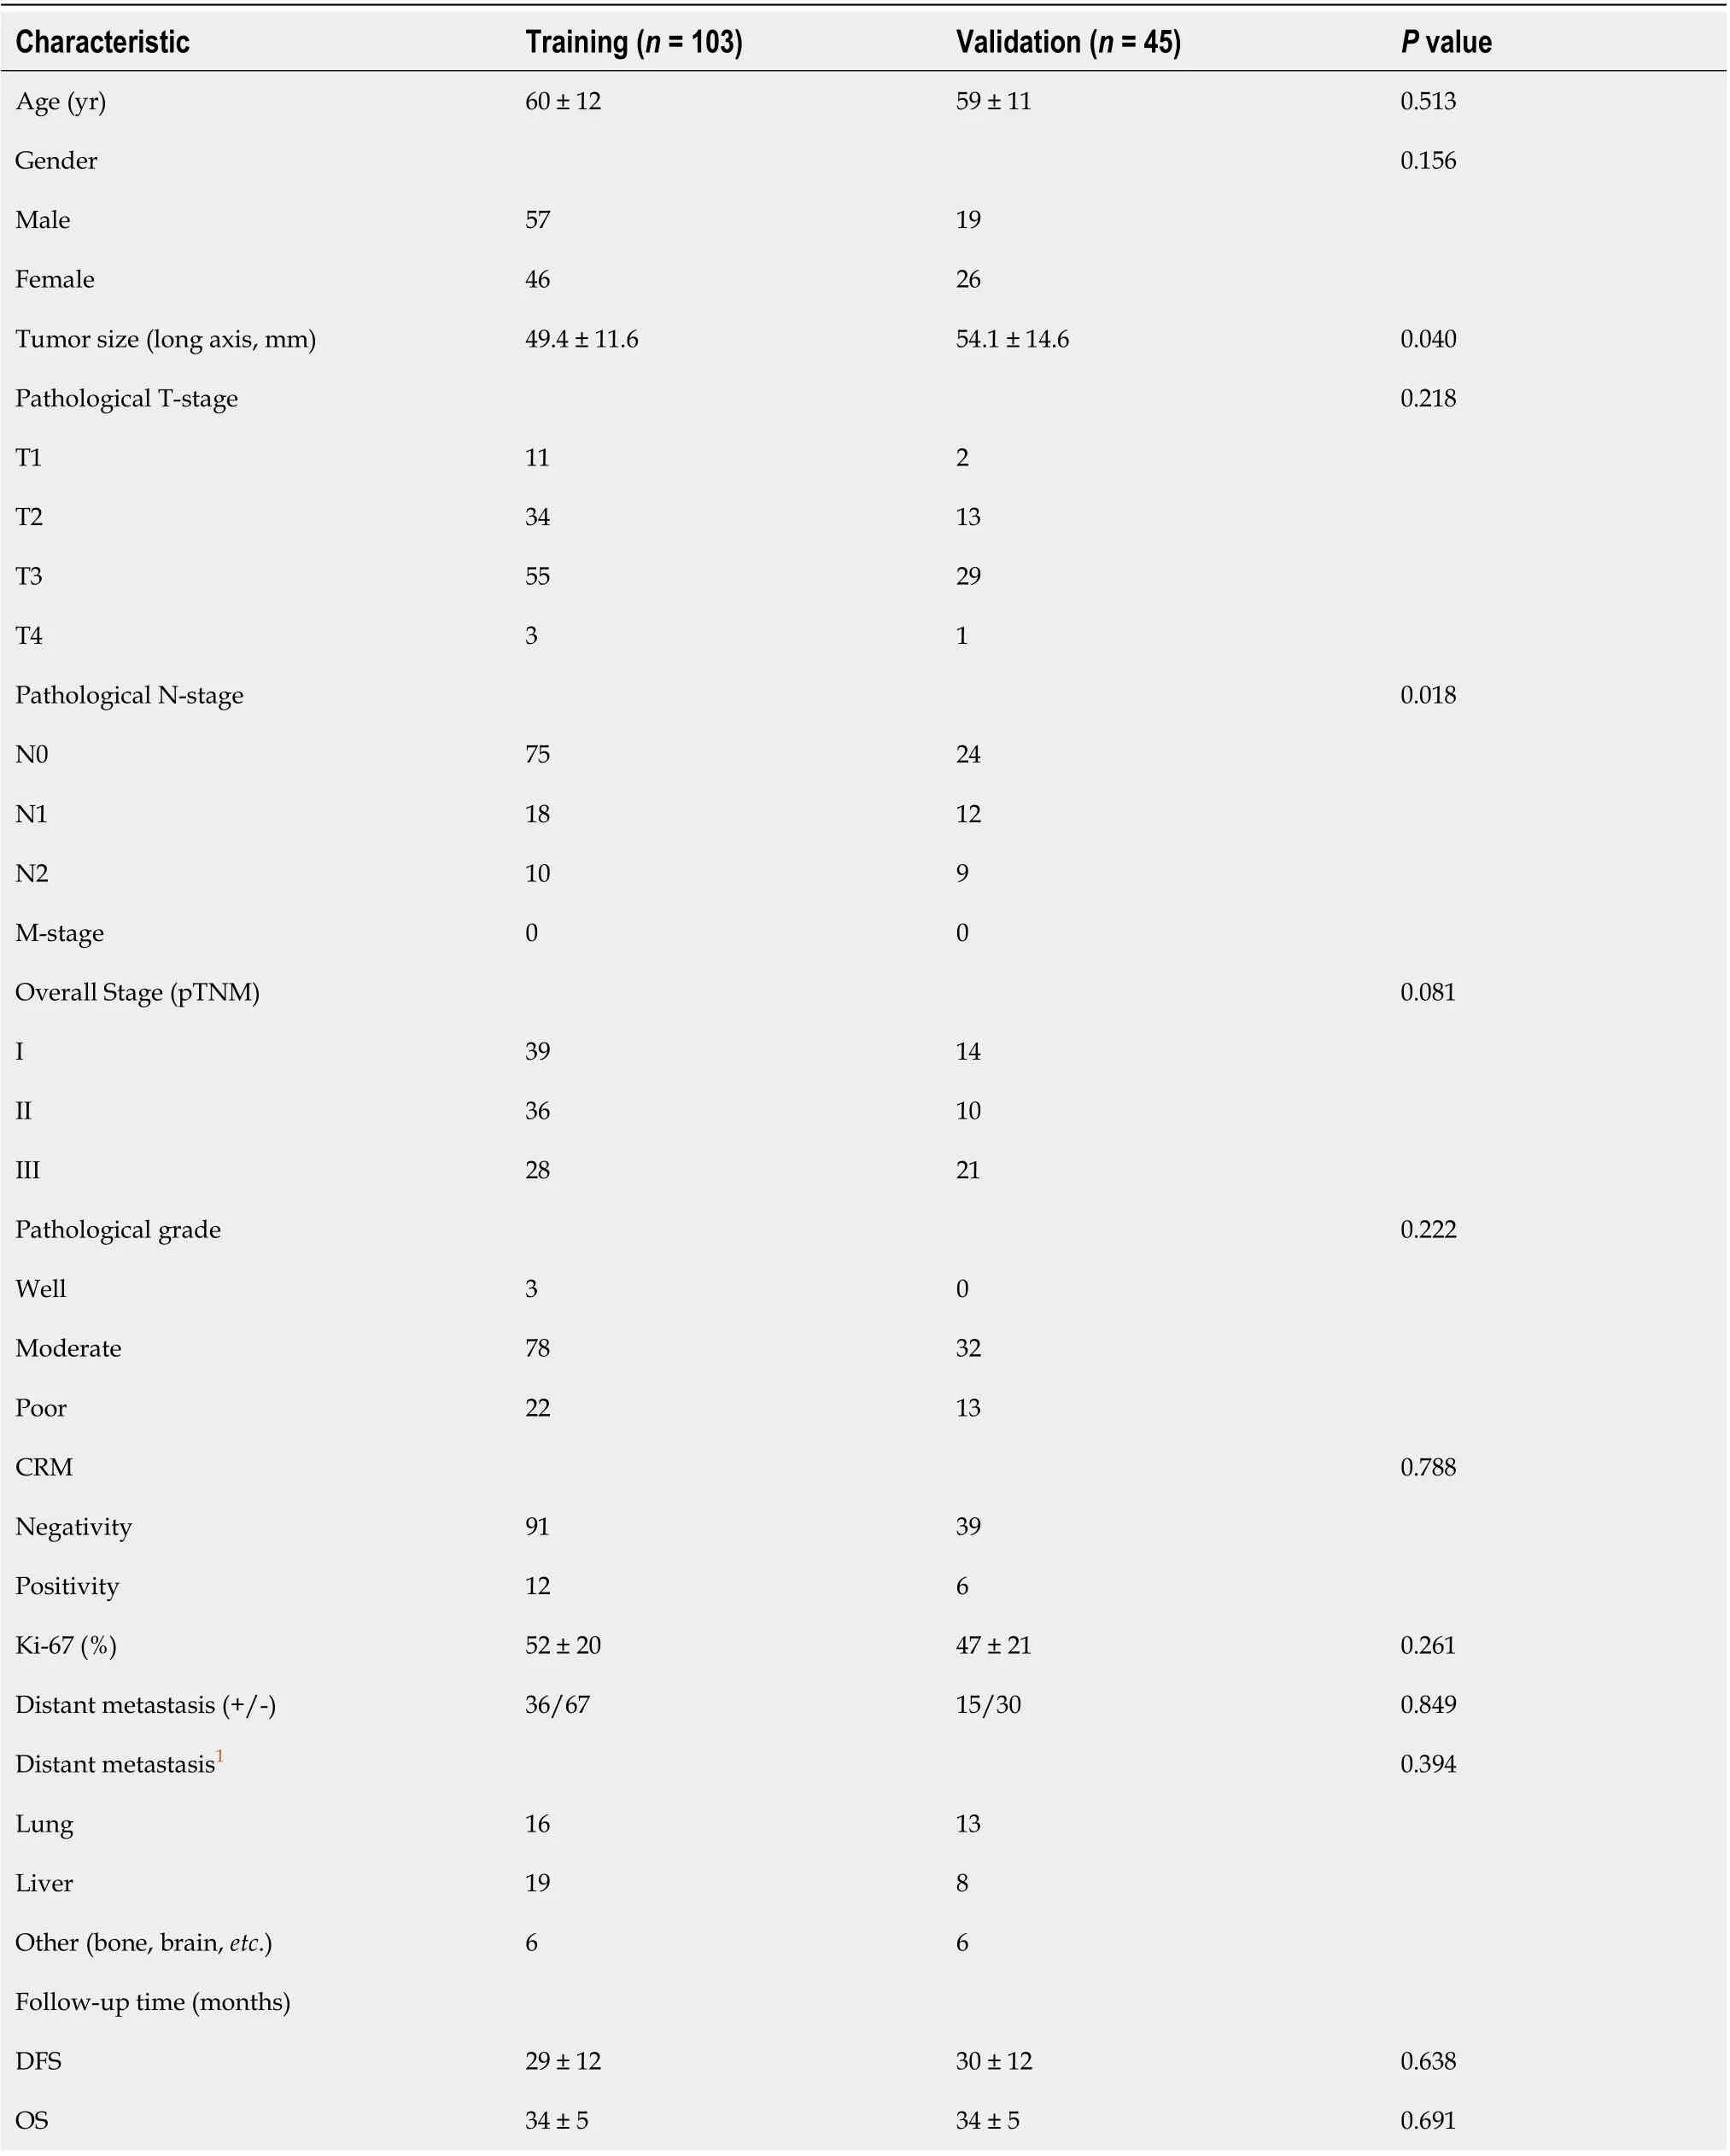
Table 1 Patient and tumor characteristics in the training and validation sets
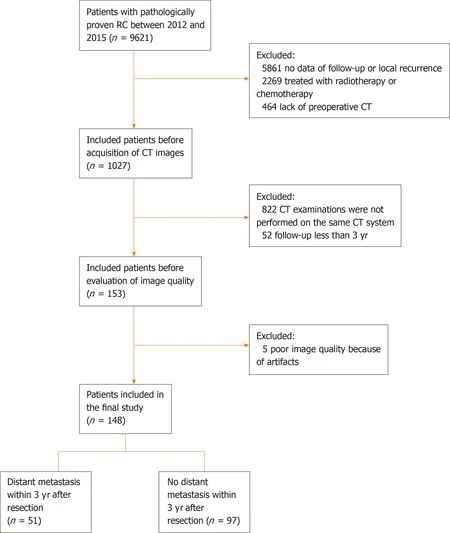
Figure 1 Flow chart of the recruitment pathway for patients included in the study. CT: Computed tomography.
The endpoint of this study was 3-year OS, defined as the time between the surgery and the date of the patient’s death. Local recurrence was defined as recurrence in the pelvis, and distant metastasis as recurrence at sites other than the pelvis. All distant metastatic cases were diagnosed by a multidisciplinary team based on clinical examinations, serum carcinoembryonic antigen levels, chest and abdominopelvic CT, abdominopelvic magnetic resonance imaging, endoscopy, and biopsy. Follow-up information was recorded in the database.
Texture feature extraction
A radiologist with 7 years of experience in RC imaging used the ITK-SNAP software (open source, www.itk-snap.org) for the three-dimensional (3D) manual segmentation of the primary tumor, as shown in Figure 2. The region of interest was carefully placed in an area that avoided the intestinal lumen, calcification, blood vessels, and necrosis. In all, 396 quantitative radiomic features of three types (first-order, second-order, and higher-order) were calculated and extracted automatically using the in-house Artificial Intelligence Kit software (GE Healthcare). First-order features are calculated from the pixel intensity histogram to quantify tumor intensity characteristics. Second-order features based on the co-occurrence matrix or run-length matrix account for the location of the pixels and analyze texture in a specific direction. Higher-order features, such as contrast, compare differences and relationships between multiple pixels.
Model building and evaluation
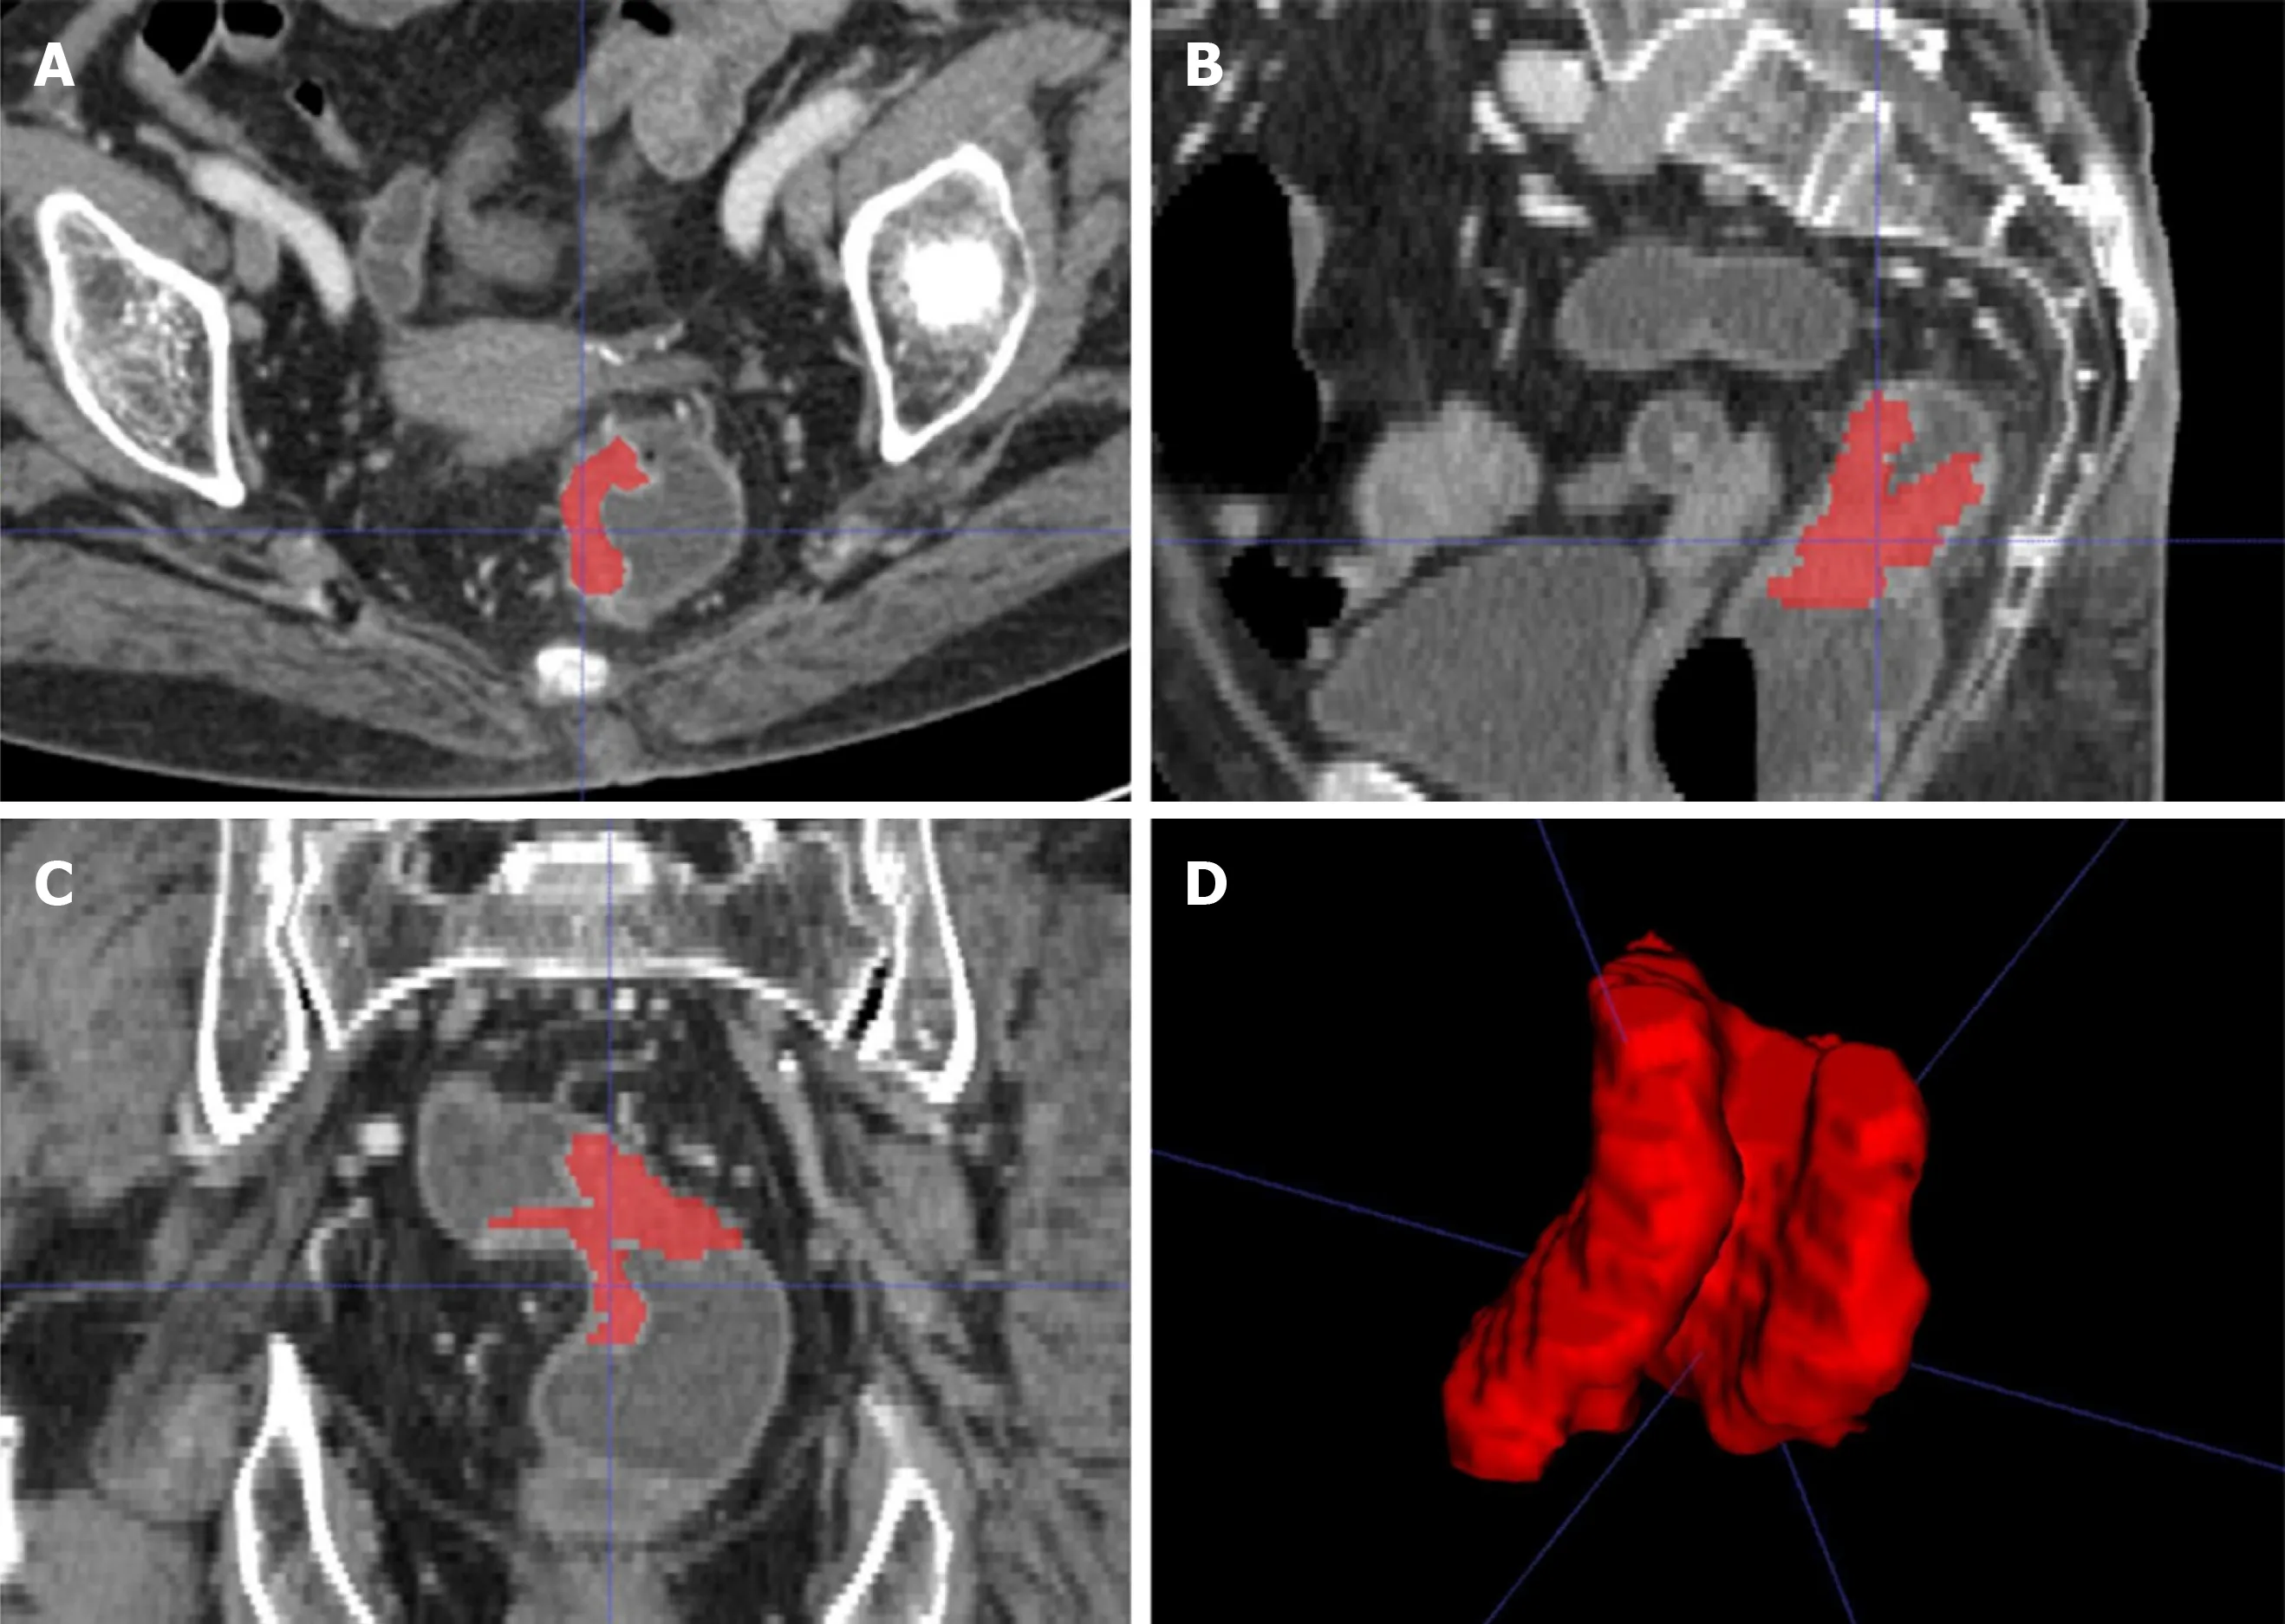
Figure 2 A 58-year-old woman with rectal cancer. A-C: Representative manual segmentation of the whole lesion in the axial, sagittal, and coronal enhanced computed tomography images. Red lines represent the delineations of the regions of interest used to derive the radiomic features; D: Three-dimensional volumetric reconstruction of the segmented lesion.
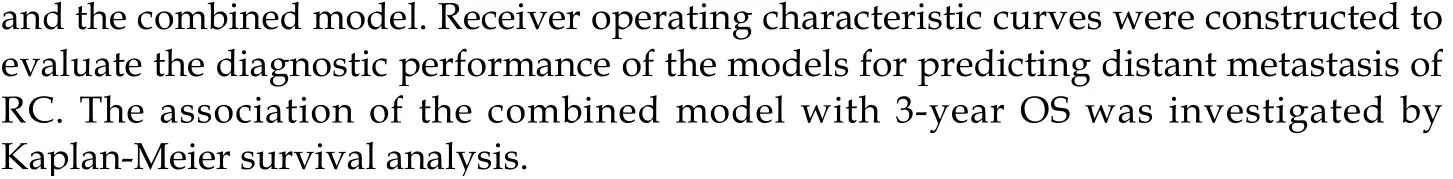
Before selecting features, the redundant features needed to be eliminated. When the Pearson correlation coefficient of any two features was higher than 0.6, one of them was selected at random, and the rest could be treated in the same manner. Then, the least absolute shrinkage and selection operator (LASSO) regression analysis was performed to identify the most useful prognostic features. The LASSO regression is a variable selection method for linear regression models. The LASSO does this by imposing a constraint on the model parameter (λ) that causes regression coefficients for some variables to shrink toward zero. Variables with a regression coefficient equal to zero are excluded from the model. Variables with non-zero regression coefficients are selected by the LASSO. After that, z-score transformation was used to standardize all selected features. The CT images of 30 patients were segmented twice by the same radiologist to calculate intraclass correlation coefficients for assessing the stability of the features. Radiomic features with an intraclass correlation coefficient > 0.75 were included in the analysis. Each radiomic feature was assessed by univariate logistic regression, and statistical significance was assumed at a confidence level of 0.2 to avoid missing important features. Features withP< 0.2 in univariate logistic regression analysis were entered into the multivariate analysis. A nomogram was generated for model visualization. Receiver operating characteristic curves for each model were constructed to evaluate the performance for predicting distant metastasis of RC. The association of the predicting models with 3-year OS was investigated by Kaplan-Meier survival analysis.
Statistical analysis
All statistical analyses were performed using R software (version 3.6.1, R Foundation for Statistical Computing, Vienna, Austria), Statistic Package for Social Science version 21 (Statistic Package for Social Science Inc., Chicago, IL, United States), Stata 15.0 (Stata Corp LLC, Lakeway Drive College Station, United States), and Medcalc 15.2.2 (Medcalc Software, Ostend, Belgium). Differences between the training and validation sets were assessed by the chi-square test, Mann-Whitney test, andt-test. Survival curves were compared by the log-rank test.P< 0.05 was considered statistically significant.
RESULTS
A total of 148 patients were enrolled in our study, of whom 51 had distant metastases, 26 died, and 122 survived to the date of the last follow-up visit at 3 years post-surgery (Table 2).
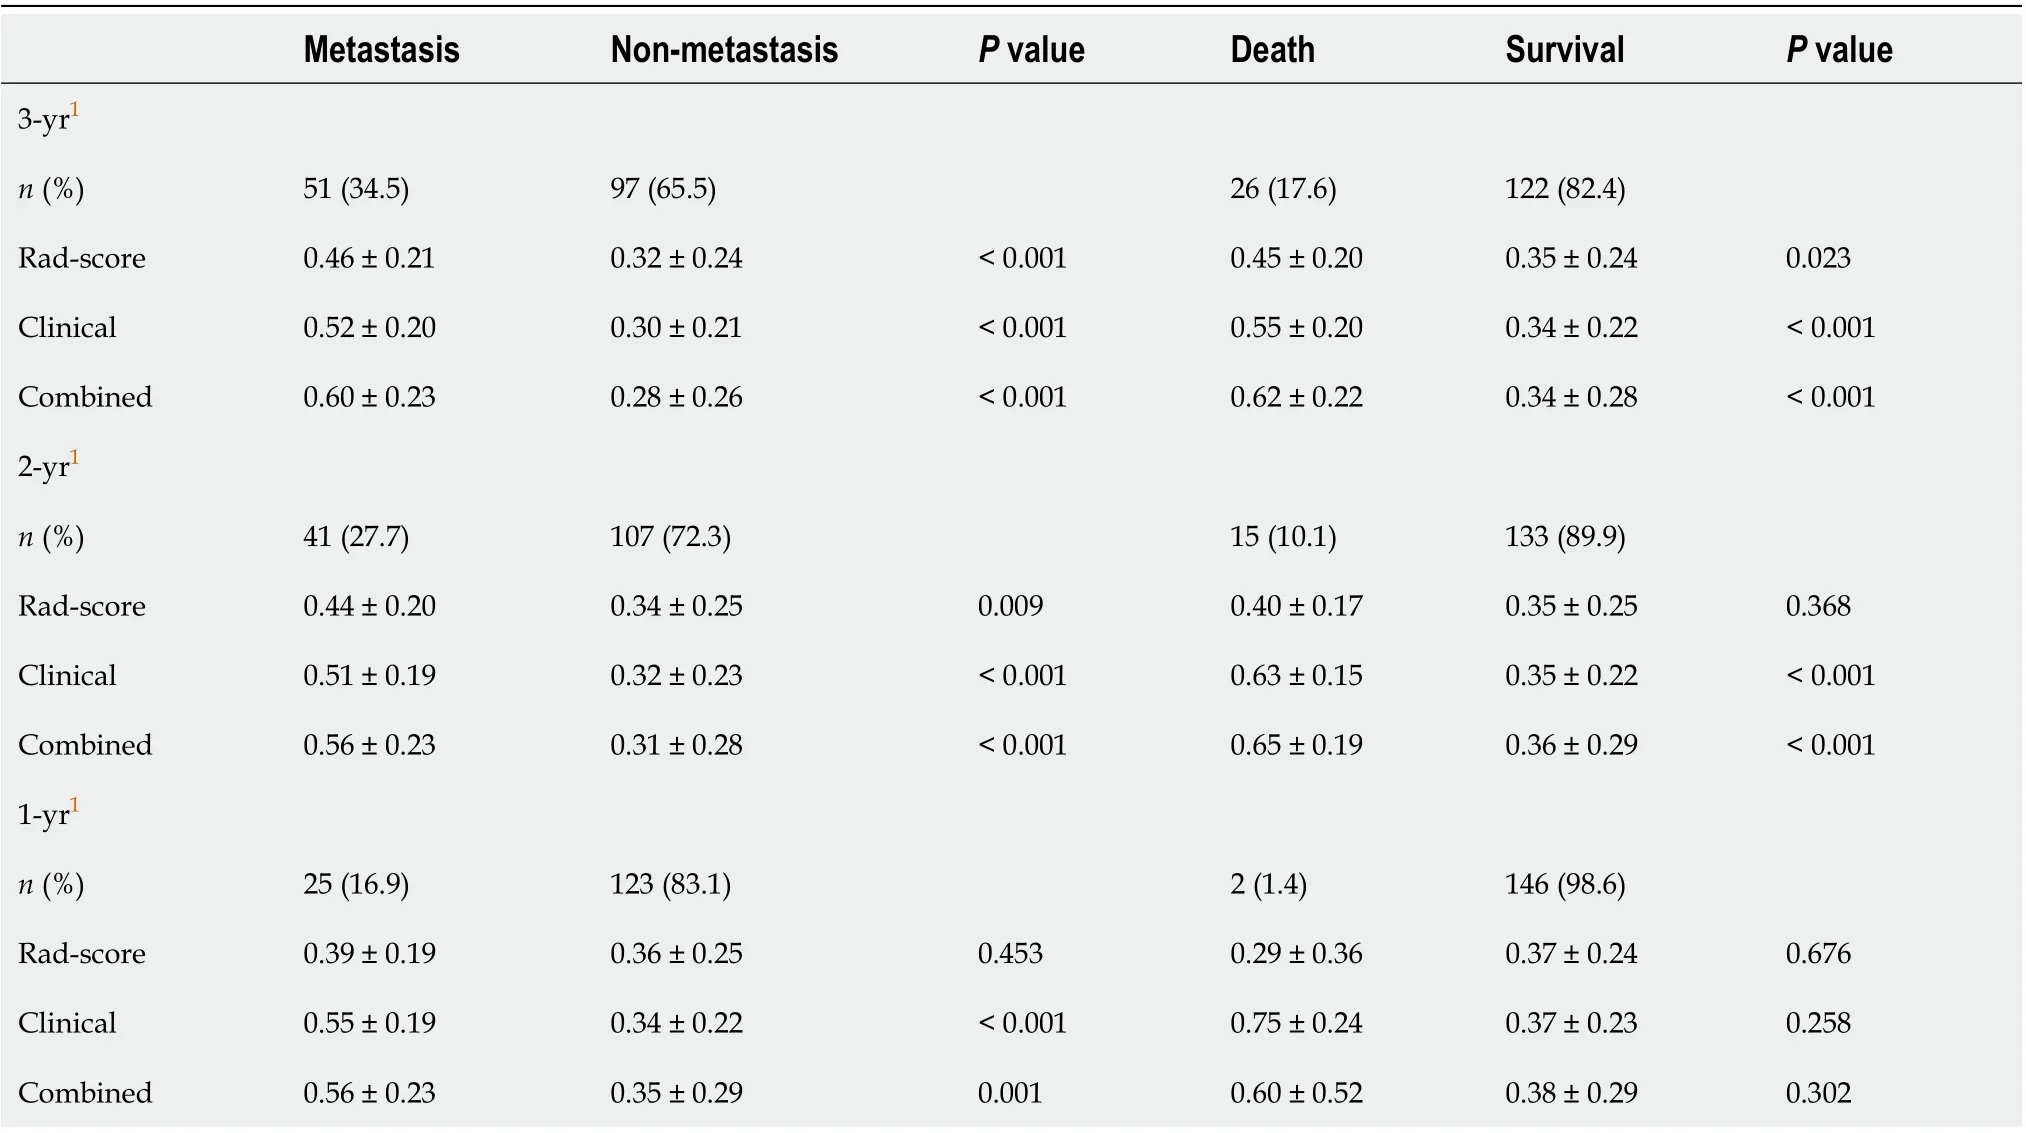
Table 2 Comparison of the models between the metastasis group and the non-metastasis group, and between the death group and the survival group
Feature selection and model building
A total of 17 radiomic features remained after removing the redundant features. Two features, “MaxIntensity” and “RelativeDeviation”, were selected by the LASSO method from the remaining features (Figure 3). To avoid missing important features, another feature “Inertia_AllDirection_offset7_SD” was selected by the univariate logistic regression (P= 0.192). These three features were presented in this calculation formula: Rad-score = 1/{1 + EXP [-(-0.649 - 0.786 × MaxIntensity - 0.868 × Inertia_AllDirection_offset7_SD - 2.743 × RelativeDeviation)]}. The radiomics signature (Rad-score), which consisted of three selected features, was statistically different between the metastasis and non-metastasis groups (Rad-score = 0.46 and 0.32, respectively;P< 0.001), as shown in Table 2.
For clinical features, pathological T-stage and N-stage were selected by the univariate logistic regression analysis (P< 0.001 andP= 0.002, respectively). The clinicoradiologic risk model was built by the multivariate logistic regression analysis, using the formula 1/{1 + EXP [-(-6.199 + 1.368 × T-stage + 0.738 × N-stage + 4.673 × Rad-score)]}. The results of the combined model were significantly different between the metastasis and non-metastasis groups by 3 years after surgery (P< 0.001), as shown in Table 2. The Hosmer-Lemeshow test yielded no statistical significance (P= 0.280 and 0.151 for the Rad-score and combined model, respectively), which suggested that there was no evidence of lack of fit.
A nomogram to predict the distant metastasis of RC was generated for the combined model visualization (Figure 4). The nomogram could be used by locating the score for each variable on the corresponding axis, adding the points together for all of the variables, and drawing a line from the total number of points to the risk axis, which allows for the determination of distant metastasis risk. Higher total scores were associated with a greater risk of distant metastasis. The contributions of these variables to the Rad-score and the combined model were measured by the value of the standardized logistic regression coefficient (Figure 5). The contribution of “MaxIntensity” to the Rad-score, and that of “T-stage” to the combined model were greater than those of the others.
Classification results
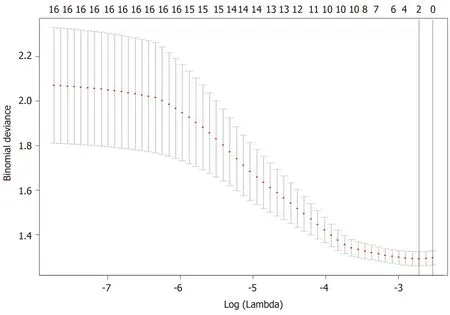
Figure 3 Feature selection using the least absolute shrinkage and selection operator regression model. Dotted vertical lines were drawn at the optimal values (two features were selected) by using the minimum criteria and one standard error of the minimum criteria (i.e., the 1-SE criteria).
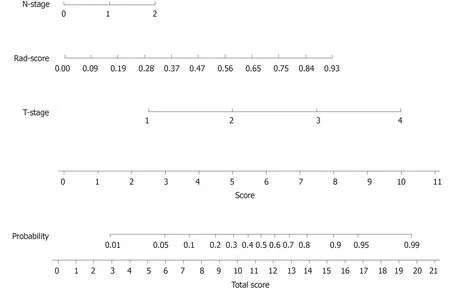
Figure 4 Developed radiomics nomogram. The radiomics nomogram was developed in the training cohort, with the Rad-score, T-stage, and N-stage incorporated.
In the case of only considering the Rad-score, the resulting area under the curve (AUC) was 0.709 (95%CI: 0.612-0.795). Improved prediction of distant metastases could be achieved by combining the radiomic features from preoperative CT images with the clinical features. The AUCs of the clinical model (T-stage combined with N-stage) and the combined model were 0.782 (95%CI: 0.689-0.857) and 0.842 (95%CI: 0.757-0.906), respectively (Table 3 and Figure 6). There was a significant difference in AUCs between the Rad-score and combined model in the training cohort (AUC = 0.709vs0.842,P= 0.005), which was confirmed using the validation cohort (AUC = 0.687vs0.802,P= 0.020). We found that the clinical variables had higher classification contributions than Rad-score to build the combined model. This finding was consistent with the higher standardized logistic regression coefficient of T-stage than that of the Rad-score (Figure 5). Moreover, the AUC value of the clinical model was also higherthan that of the Rad-score. Even so, the Rad-score greatly helped to increase the AUC value from 0.782 to 0.842 (Table 3 and Figure 6). In the subgroups of the receiver operating characteristic analysis, the AUC of the combined model decreased in the 1-year (distant metastasis occurred in the first year after surgery) and 2-year (distant metastasis occurred within 2 years after surgery) subgroups (Table 3).
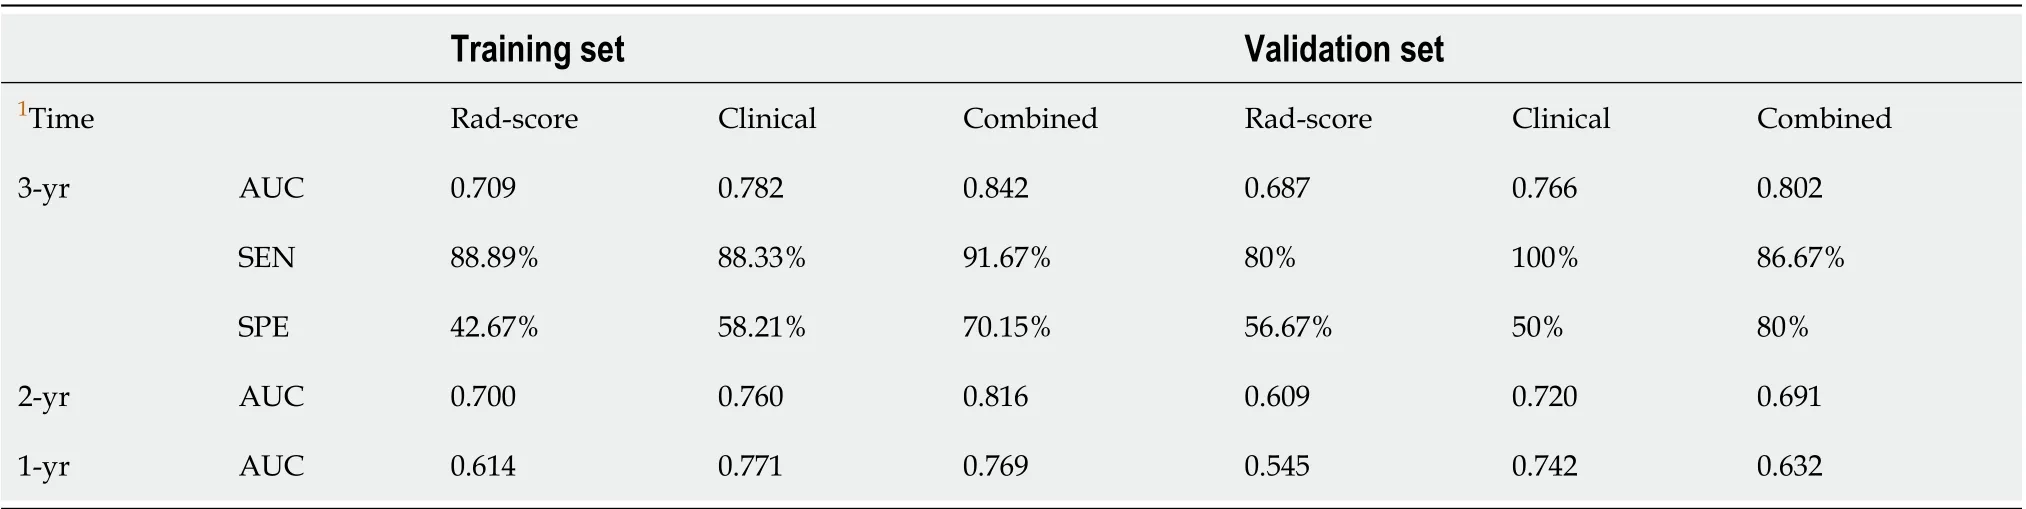
Table 3 Diagnostic performance of the three models in both training and validation cohorts
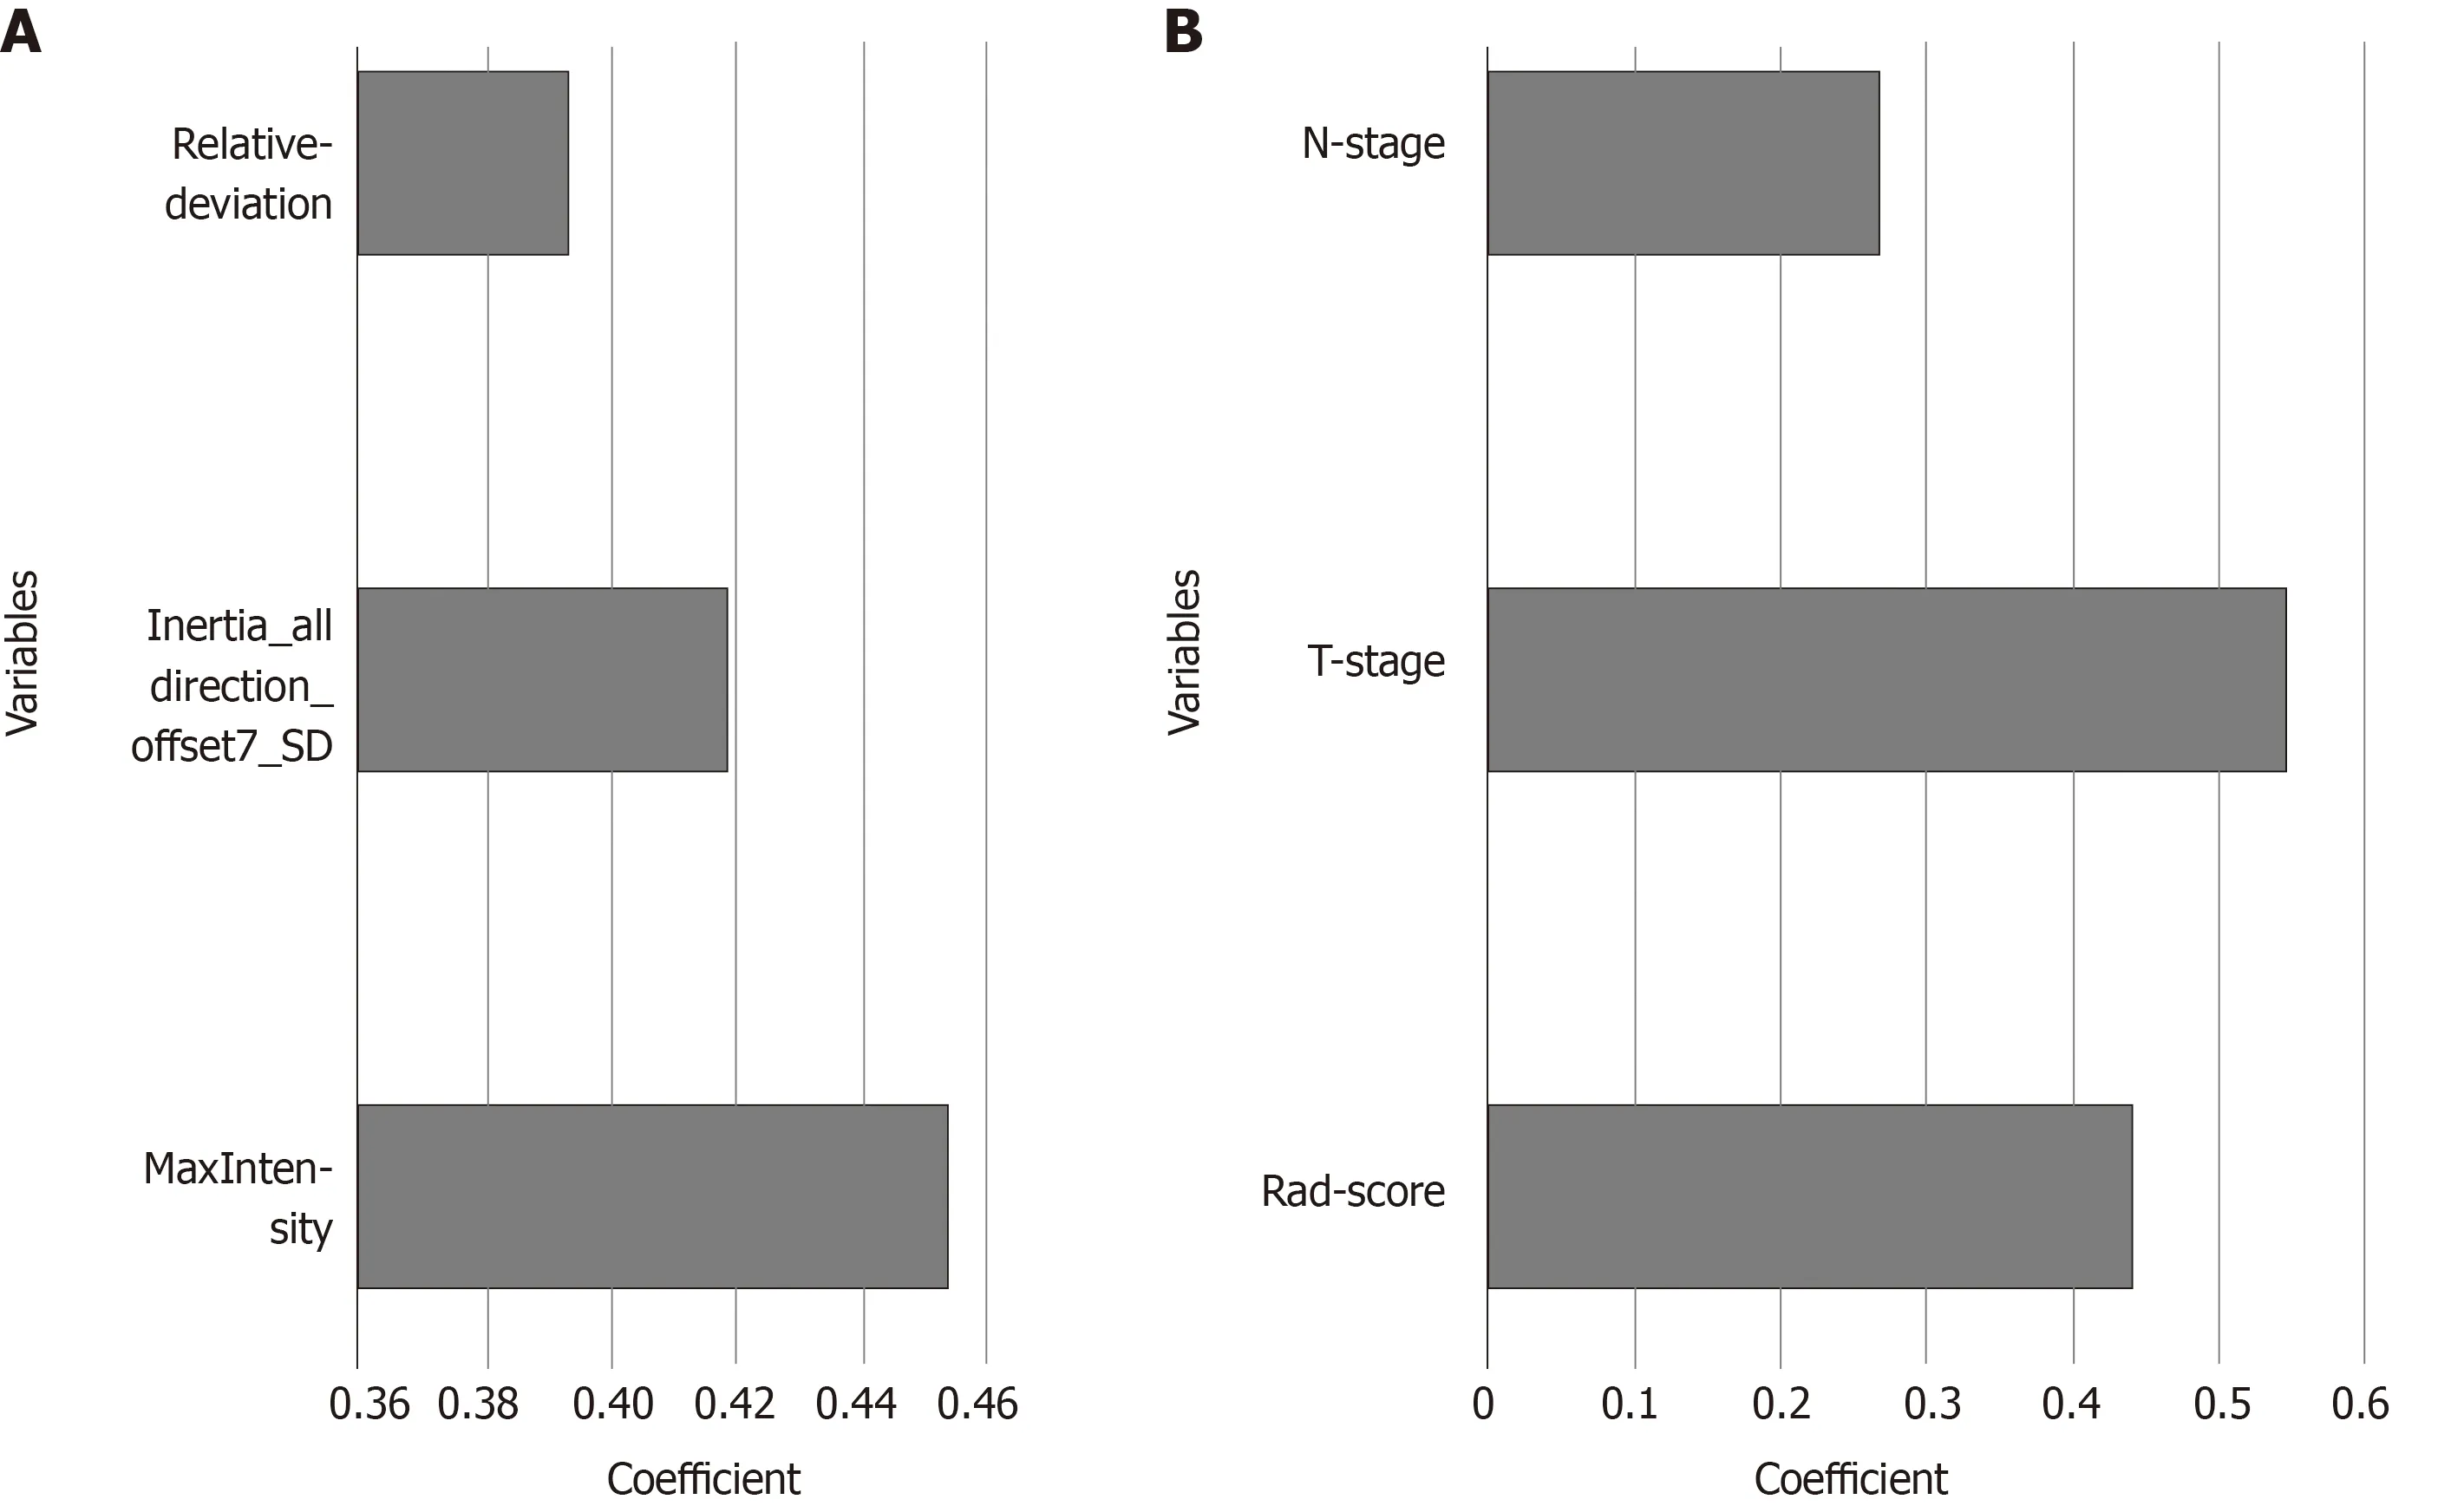
Figure 5 Histogram showing the contribution of each variable to the models. A: the Rad-score; B: the combined model. The contributions of the variables were measured by the values of the standardized logistic regression coefficients.
Assessment of the combined model for OS
Using the clinicoradiologic risk model, stratified analyses were performed for the whole set, training set, and validation set to evaluate the association with OS. As shown in Figure 7, the grouping results of the combined model were significantly associated with OS in the whole, training, and validation groups (P< 0.0001,P= 0.0001, andP= 0.0137, respectively). Although there was a lack of statistical significance for stage III in the stratified subgroup analysis, according to the overall pathological stage, the low-risk group displayed a longer OS than the high-risk group (P< 0.001,P= 0.0194, andP= 0.1401 for stages I, II, and III, respectively), which was significant in terms of individualized treatment (Figure 8)[18].
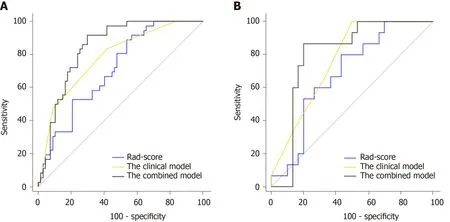
Figure 6 Receiver operating characteristic curves of the models in the training and validation cohorts. A: In the training set, the combined model [area under the curve under the curve (AUC) = 0.842] achieved a better performance than the Rad-score (AUC = 0.709) and the clinical model containing Tstage and N-stage (AUC = 0.782); B: In the validation set, the AUCs of the Rad-score, the clinical model, and the combined model were 0.687, 0.766, and 0.802, respectively.
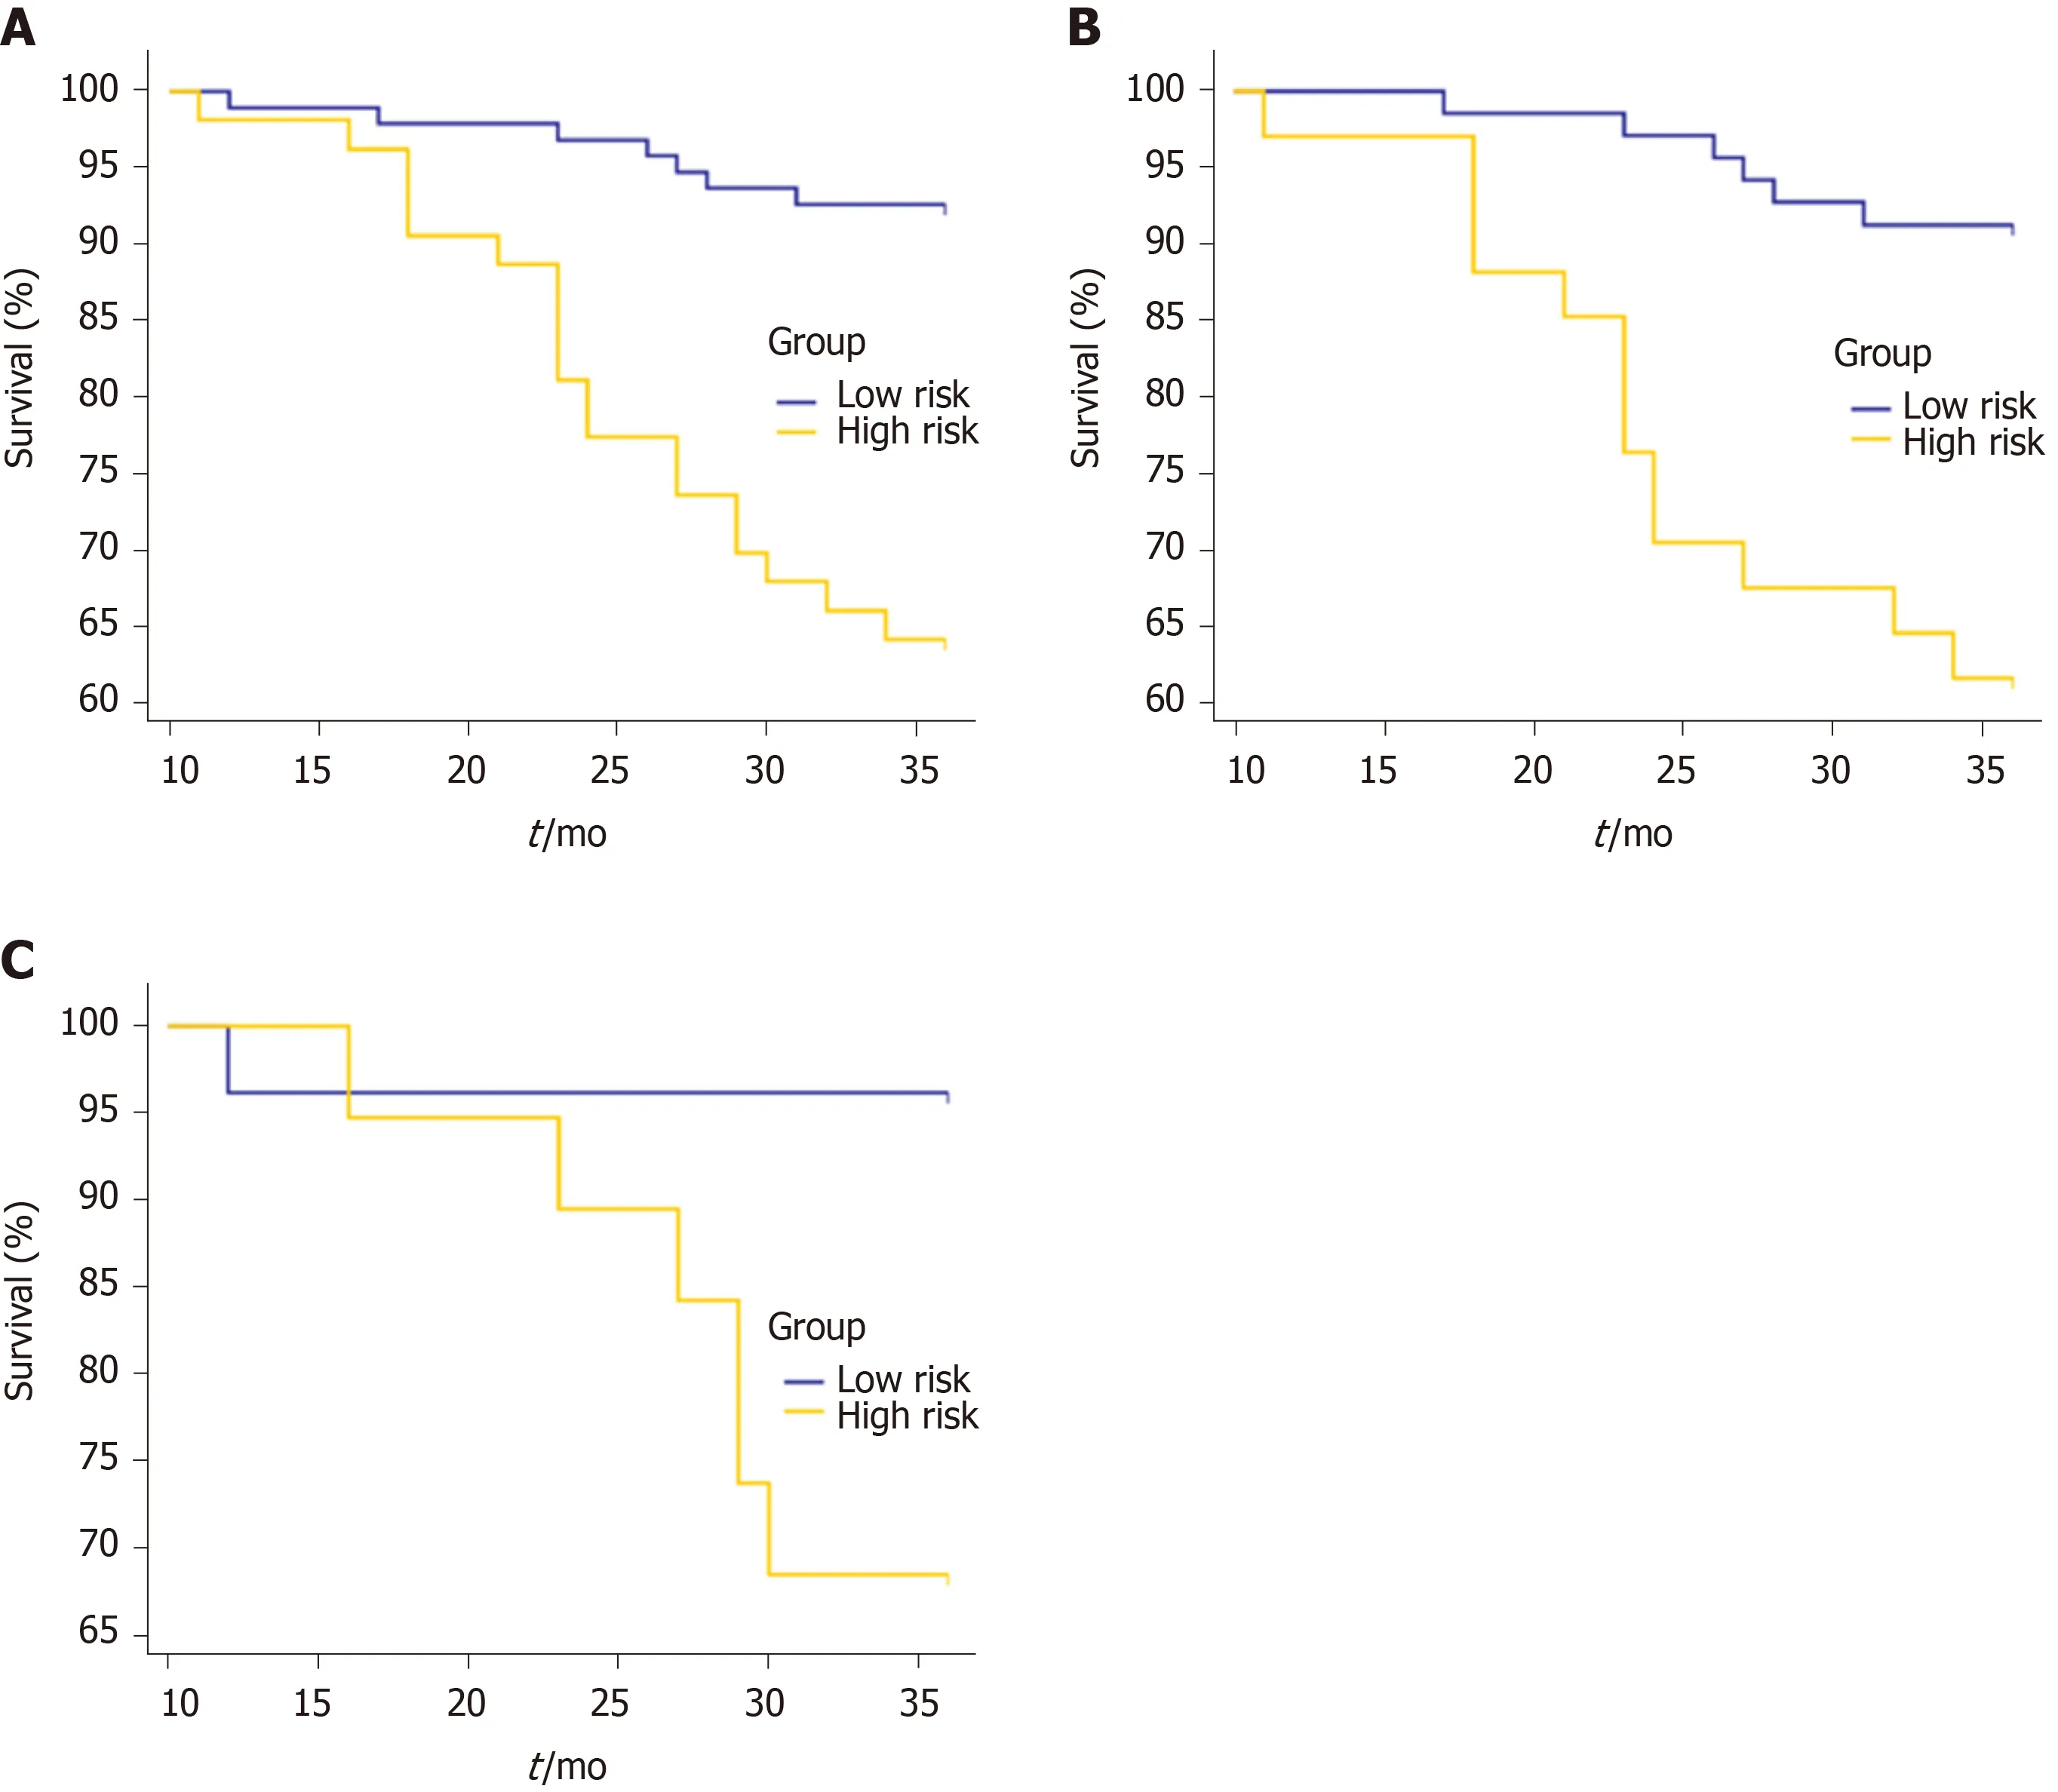
Figure 7 Kaplan-Meier curves for overall survival stratified by risk group, as identified by the combined model. A: The whole set. P < 0.0001; B: The training set. P = 0.0001; C: The validation set. P = 0.0137.
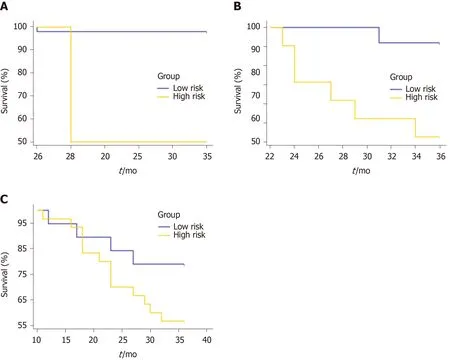
Figure 8 Overall survival curves for the low- and high-risk groups classified according to the combined model in the subgroups of the overall pathological stage. A: Stage I. P < 0.001; B: Stage II. P = 0.0194; C: Stage III. P = 0.1401.
DISCUSSION
In this study, we developed and validated a clinicoradiologic risk model that showed potential for predicting distant metastasis of RC within 3 years after surgery, which had a better prognostic performance than Rad-score (P= 0.005 and 0.020 for the training cohort and validation cohort, respectively). The combined model was used to stratify patients into low-risk and high-risk groups for the analysis of 3-year OS. The results showed that OS rates between low- and high-risk groups were significantly different in the training cohort, which was verified in the validation cohort.
Compared with traditional image explanation, which is qualitative or subjective, radiomic analyses permit high-throughput extraction of radiomic features that can quantify differences between tissues invisible to human eyes. Recently, the use of radiomics has appeared as a potential technique for constructing decision-support models based on high-throughput quantificational characters extracted from medical images. Radiomics-based prognosis prediction models have been reported for advanced nasopharyngeal carcinoma[19], early-stage non-small cell lung cancer[20], and RC[12-14]. In their pioneering retrospective studies about the prognosis of RC[12-14], robust models and strong independent prognostic factors have been developed for the prediction of OS in patients with RC. Our results were consistent with previous studies, suggesting that radiomics could help predict the prognosis of patients with RC. The building methods between our study and those of previous studies were similar (machine learning), and all these studies lacked external validation. However, there were still some differences that need to be explained. For the follow-up time, Wanget al[13]followed the patients for 5 years, and Lovinfosseet al[12]for 4 years, which were longer than the time in the current study. These authors[12-14]focused on predicting the prognosis in locally advanced RC patients treated with neoadjuvant chemoradiation followed by surgery, which is different from our current study. Different chemoradiotherapy regimens might influence the prognostic evaluation of patients with RC. Moreover, the sample sizes of these two studies[12,14]were less than ours.
In terms of feature selection, several relationships were uncovered between the specific features and their ability to predict distant metastasis. For the radiomic features included in this study, the first-order features show an excellent auxiliary classification effect, accounting for two of the three specified radiomic features. In the clinical features, we found that T-stage and N-stage had high standardized logistic regression coefficients, indicating the contribution to the combined model. This finding is consistent with the consensus that pathological T-stage and N-stage are very important for predicting the distant metastasis of RC. The histological grade, circumferential resection margin, Ki-67 score, and tumor diameter did not present enough predictive power for distant metastasis and prognosis. Subsequently, we integrated the Rad-score into a nomogram with clinical risk factors, and constructed a useful tool for individualized evaluation of distant metastasis and OS in patients with RC.
In our study, only patients who did not receive chemoradiotherapy were selected for the analysis of prognosis. On the one hand, the variables caused by the different intensive chemoradiotherapy methods can be controlled. On the other hand, we could build a novel model to stratify the high-risk patients. This was in step with the current trends toward personalized medicine[21]. Considering individualized evaluation of patients with RC of different stages, the subgroup survival analysis was performed. The low-risk groups had longer OS than the high-risk groups, which was statically significant between stage I and II (P< 0.001 andP= 0.0194, respectively). However, there was no statistically significant difference for stage III (P= 0.1401). We speculate that this might be related to the small sample size of this study.
There are several limitations to this study. The first limitation is the relatively small sample size. Second, even if we controlled therapeutic methods to surgery alone, inevitable bias may exist due to the retrospective design of this study. Therefore, prospective and external validation studies are required in future studies. Third, all of the CT images were obtained from a single institution. In the future, multicenter verification is necessary to extend the versatility of the experimental results.
CONCLUSION
In conclusion, this study describes a combined model that incorporates a radiomics signature and clinical risk factors. The model can aid in the individualized prediction of distant metastasis and prognosis in patients with RC.
ARTICLE HIGHLIGHTS

Research results
A total of 51 (34.5%) patients had distant metastases, while 26 (17.6%) patients died, and 122 (82.4%) patients lived at least 3 years post-surgery. The values of both the Rad-score and the combined model were significantly different between the distant metastasis group and the non-metastasis group (0.46 ± 0.21vs0.32 ± 0.24 for the Radscore, 0.60 ± 0.23vs0.28 ± 0.26 for the combined model;P< 0.001 for both models). Predictors contained in the combined model included the Rad-score, pathological Nstage, and T-stage. The combined model showed good discrimination, with an area under the curve of 0.842 and 0.802 for the training set and validation set, respectively. For the survival analysis, the combined model was associated with an improved OS in the whole cohort and the respective subgroups.
Research conclusions
This study presents a novel model, visualized in a nomogram, that can be used to facilitate individualized prediction of distant metastasis and 3-year OS in patients with RC.
Research perspectives
Radiomics may change the practice of medicine, particularly for patients with RC. However, there are challenges to be overcome before its routine implementation including challenges related to sample size, model design, and the lack of robust multicenter validation set. Therefore, prospective multicenter studies of a larger size are needed to externally validate our proposed model in the future.
杂志排行

World Journal of Gastroenterology的其它文章
- Bowel function and quality of life after minimally invasive colectomy with D3 lymphadenectomy for rightsided colon adenocarcinoma
- Treatment repurposing for inflammatory bowel disease using literature-related discovery and innovation
- Effects of denosumab treatment in chronic liver disease patients with osteoporosis
- Neutrophil to lymphocyte ratio and albumin bilirubin grade in hepatocellular carcinoma: A systematic review
- Liver fat accumulation measured by high-speed T2-corrected multi-echo magnetic resonance spectroscopy can predict risk of cholelithiasis
- Exploring the food-gut axis in immunotherapy response of cancer patients