Influence of active constrained layer damping on the coupled vibration response of functionally graded magneto-electro-elastic plates with skewed edges
2020-10-27VinysHrursmpthNguyenThoi
M. Vinys , D. Hrursmpth , T. Nguyen-Thoi
a Nonlinear Multifunctional Composites Analysis and Design (NMCAD) Laboratory, Department of Aerospace Engineering, Indian Institute of Science,Bangalore, 560012, India
b Division of Computational Mathematics and Engineering, Institute for Computational Science, Ton Duc Thang University, Ho Chi Minh City, Viet Nam
c Faculty of Civil Engineering, Ton Duc Thang University, Ho Chi Minh City, Viet Nam
Keywords:
ABSTRACT This article makes the first attempt in assessing the influence of active constrained layer damping(ACLD)treatment towards precise control of frequency responses of functionally graded skew-magneto-electroelastic (FGSMEE) plates by employing finite element methods. The materials are functionally graded across the thickness of the plate in terms of modest power-law distributions. The principal equations of motion of FGSMEE are derived via Hamilton’s principle and solved using condensation technique. The effect of ACLD patches are modelled by following the complex modulus approach (CMA). Additionally,distinctive emphasis is laid to evaluate the influence of geometrical skewness on the attenuation capabilities of the plate. The accuracy of the current analysis is corroborated with comparison of previous researches of similar kind. Additionally, a complete parametric study is directed to understand the combined impacts of various factors like coupling fields,patch location,fiber orientation of piezoelectric patch in association with skew angle and power-law index.
1. Introduction
A novel class of composite materials known as functionally graded materials (FGMs) emerged to fulfil the high demands of improved structural performance requirements. The effective properties or functional performance of these materials exhibit variation in one or more spatial direction. In other words, the material properties of FGMs are non-homogeneous and are position dependent. Hence, such materials are designed to provide predictable properties by virtue of their discrete constituents. In contrast to the conventional materials,FGMs display a better ability to control deformation, dynamic response, multifunctionality etc.which are beneficial to vibration control of the structures. Due to these advantageous properties, FGMs are the potential candidates for various complex engineering applications such as military,automotive, biomedical application, semiconductor industry,manufacturing industry and general structural elements in thermal environments.
Magneto-electro-elastic(MEE)composites are the combination of piezoelectric (PE) and piezomagnetic (PM) phases, where in a triple energy conversion among magnetic,electric and elastic fields can be observed. Further, MEE materials display high degree of magneto-electric coupling which cannot be seen in individual phases. Therefore, it is very crucial to assess the associated electromagnetism phenomenon either experimentally or with the aid of sophisticated computational techniques [1,2]. The topological textures and concentration of Barium Titanate and Cobalt Ferrite have a direct impact on the operative material properties associated with the degree of coupling exhibited by the MEE entities[3,4]. This advantage can be used extensively for the creation of various devices where couplings among the said phases are needed. Also, through the sensitivity analysis [5] the performance optimization can also be achieved effectively. The functionally graded magneto-electro-elastic (FGMEE) materials can further intensify the desirable characteristics of their individual phases.For instance,the MEE structures exhibit high electric properties on the piezoelectric side while the magnetic behavior is taken care by the piezomagnetic phase.
To this end, many pioneers have devoted themselves to evaluating the mechanical responses of homogeneous as well as functionally graded MEE structures. Among them, a significant contribution was made by Pan and his associates in developing the exact solutions to facilitate the natural vibrational analysis of multilayered MEE plates [6,7]. Lage et al. [8] implemented partial mixed layer-wise finite element (FE) methods and explored the frequency response of MEE plates. Moita et al. [9] assessed the vibrational features of MEE plates utilizing the higher-order shear deformation theory. Meanwhile, a variety of computational practices have proven to be effective in the evaluation of the static and natural vibration characteristics of MEE plates. These include, the approximate solution method [10], finite elements methods[11-18],mesh-less method[19]and state-space approach[20-24]among others. Furthermore, numerous layer-wise models also aid the accurate analysis of MEE structures[25-29].Also,the machine learning techniques can also prove to be effective in assessing the vibration control and energy harvesting of coupled MEE structures in the near future [30,31].
Emphasizing more on the compositionally graded MEE materials, Pan and Han [32] presented an exact solution for the FGMEE rectangular plate. Also, Huang et al. [33] presented methodical solutions to assess the behavior of FGMEE plane beams. Bhangale and Ganesan [34] investigated the vibrational behavior of FGMEE plates using finite elements method. Wu and Tsai [35] probed the static response of doubly curved FGMEE shells subjected to various forms of loading through an asymptotic approach. Li et al. [36]considered the influence of uniform load on FGMEE circular plate in their work. Sladek et al. [37] evaluated the bending response of FGMEE circular plate by employing a meshless method.Meanwhile,Kiran et al. [38] assessed the free vibrations and static behavior of porous MEE plates. Stepped functionally graded MEE structures were built and their static behavior was studied for varying compositions of Barium Titanate and Cobalt Ferrite[39-43].
It is well known that the hazardous vibrations experienced by a structure may have an adverse effect on the performance and service period. These undesirable oscillations can be effectually dampened by embedding a monolithic piezoelectric patch provided with an external voltage to the host structure. The piezoelectric patch performs the function of a sensor or an actuator or both [44]. This combined arrangement to negate the vibrations is designated as active constrained layer damping (ACLD) treatment.Nonetheless, greater attenuation capabilities are witnessed in patches composed of epoxy matrices with inclusions of piezoelectric fibers (1-3 PZC) when compared to the monolithic piezoelectric patch [45]. In addition to this functionality, the 1-3 PZC requires a lower control voltage.The ACLD treatment is comprised of the 1-3 PZC patch in combination with a visco-elastic layer.The former serves as the constraining layer with the latter, as the constrained layer. Therefore, it is obligatory that the viscoelastic layer dispels high energy through enhanced shear deformations.
Various studies have upheld the cause of ACLD treatments in the vibrational damping of the structures. Controlling the frequency response of composite plates through incorporation of vertically reinforced 1-3 PZC patch were validated by Ref. [46]. They also suggested a model to gauge the impact of the ACLD usage on FGMs[47-49], laminated [50-52] and sandwiched plates [53,54]. Their study proved that ACLD treatments can provide remarkable attenuations of linear and non-linear vibration of structures. The frequency behavior of composite plates and doubly-curved shells subjected to ACLD treatment were impacted by geometric skew as mentioned by Kanasogi and Ray [55]. Kattimani and Ray [56]adopted this unique technique to MEE structures.They carried out similar investigations on FG and multiferroic magneto-electroelastic plates [57,58]. Whereas, Vinyas [59,60] proposed an FE based method to probe the regulated linear frequency behavior of skewed MEE plates consisting of multiple layers.
Very minimal works have been carried out to gauge the impact of ACLD treatments on functionally-graded skew magneto-electroelastic (FGSMEE) plates. To the best of the author’s awareness, the current work is the first of its kind in evaluating the damped frequency response of FGSMEE plates subjected to the ACLD treatment. This makes the requirement of the present study to be an inevitable one. Therefore, an FE formulation is presented with the assistance of the Hamilton’s principle. The damping abilities of ACLD treated FGSMEE plates are thoroughly investigated to assess the major influences of geometric parameters like skew angles,patch positions and material parameters such as power-law index and coupling fields.
2. Problem statement
In this study, the controlled response of functionally graded skew magneto-electro-elastic (FGSMEE) plate has been evaluated.To this end,the ACLD treated FGSMEE plate with length a,width b,and thickness H is considered along x-, y- and z-axes of Cartesian coordinates, respectively and illustrated in Fig.1. hvand hpcorrespond to the thickness of the visco-elastic and 1-3 PZC layers,respectively.The skewed edge of the FGSMEE plate and the angle of alignment of the piezoelectric fibres of the 1-3 PZC patch are given by λ and α, respectively.
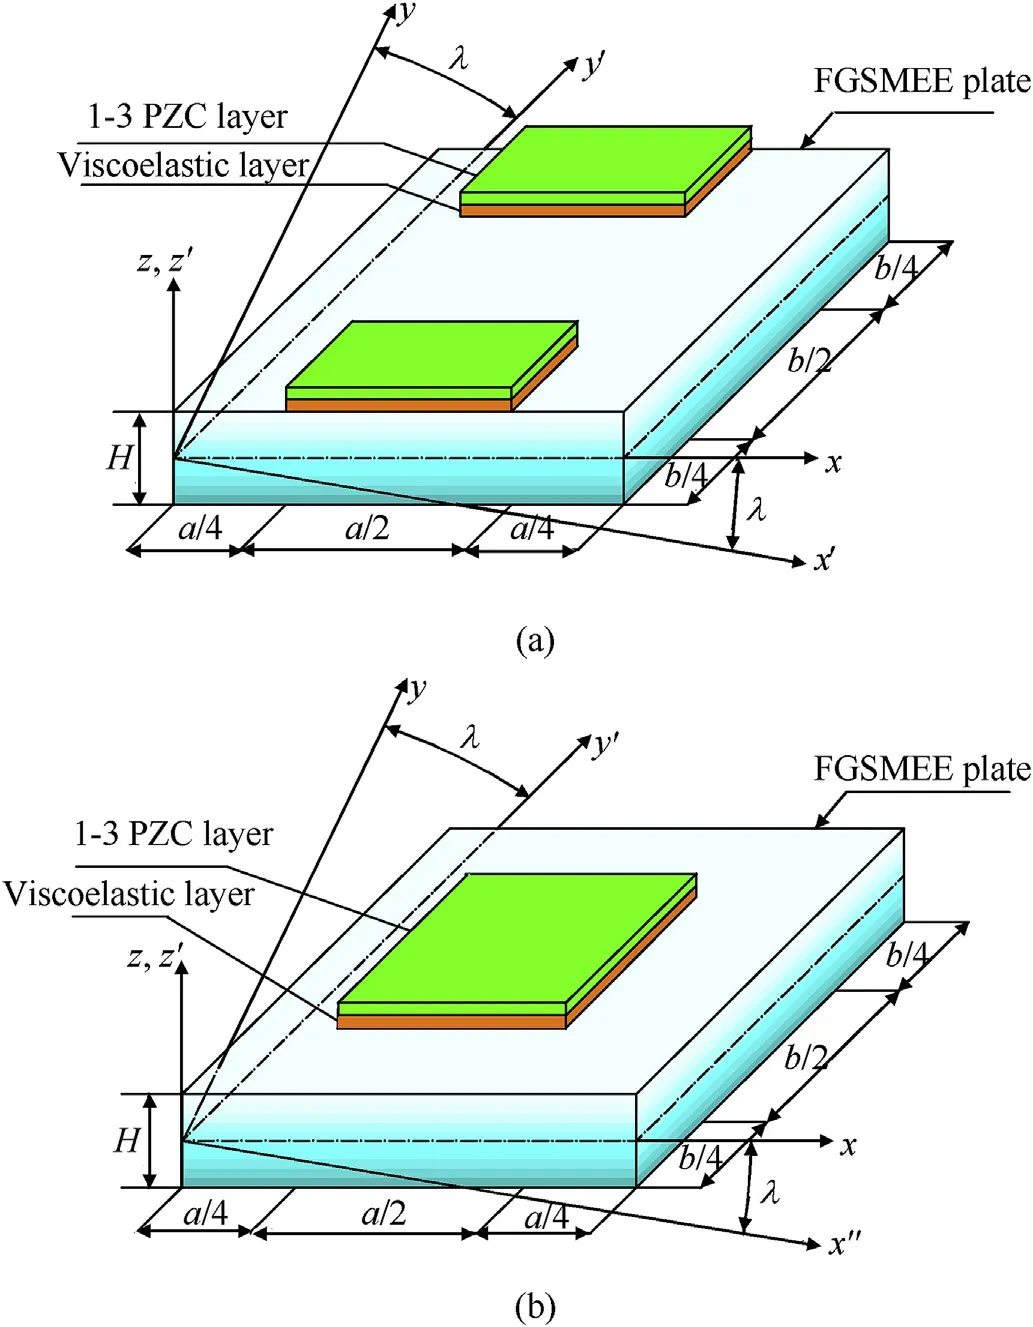
Fig.1. FGSMEE plate with (a) edge ACLD patch (b) centre ACLD patch.
2.1. Material properties and methods
The present research considers functionally graded magnetoelectro-elastic materials (FGMEEM). The coupled constitutive equations of FGMEEM as a function of z-coordinate can be represented as follows [57]:

in which, superscript fg signifies that the materialis functionally graded.Thematerial propertiesrepresentthe elastic coefficient matrix.correspond to the magnetostrictive co-efficient matrix and piezoelectric co-efficient matrix, respectively.arethe dielectricand electromagnetic coefficients, respectively. The perpendicular electric displacement and the magnetic induction components are Dzand Bz, respectively. Ezand Hzare the transverse electrical and magnetic field components, respectively. The various coefficient matrices appearing in Eq. (1) are illustrated in Appendix-A.
A simple-power law distribution is assumed to depict the variation of the effective material properties along the thickness of FGSMEE plate, as a function of volume fraction and constituent material properties.Further,the variation of the volume fraction is governed by the power-law index ‘r’. Two forms of FG material property distribution are considered for evaluation. One being,Barium Titanate rich Bottom (B-rich) and the other Cobalt Ferrite rich Bottom (F-rich). The notation B-rich bottom suggests that the bottom layer of the FGSMEE plate is purely piezoelectric(PE)which smoothly and continuously varies to the pure piezomagnetic(PM)phase at the top layer. Analogously, the vice-versa of this arrangement holds good for ‘F rich Bottom’. Encapsulating all these, the effective material properties of the FGSMEE plate can be illustrated as follows [57]:
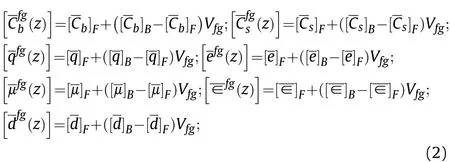
where, the subscripts B and F denote pure PE and PM phases,respectively. Also, Vfgis the volume fraction of the functionally graded layer which can be given by,

here, r is the power-law index.
Further, h1and h2are the z-coordinate of the bottom and top surfaces of FGSMEE plate, respectively. The material properties of 1-3 PZC, pure PM and pure PE phases are mentioned in Table 1.Meanwhile, the constitutive equations of the 1-3 PZC layer of the ACLD patch can be mentioned as follows [57]:

The material property matrices of Eq. (4) are illustrated in Appendix-A (Eqs. (A-2) and (A-3)).
The visco-elastic layer of the ACLD patch is modelled via complex modulus approach (CMA) [61]:

where,G’,η and ν are the storage modulus,loss factor and Poisson’s ratio of the viscoelastic layer, respectively.
As the elastic waves propagate several magnitudes slower than electro-magnetic waves, a quasi-static approximation of electromagnetic fields can be considered [28,29]. Hence, the distribution of Ezand Bzthrough the FGSMEE plate is linked to the electric (φ)and magnetic scalar potentials (ψ) according to the Maxwell’s electromagnetic equations as given below

The variation of φ and ψ across the thickness is assumed to be linear as the thickness of the plate is small. It can be illustrated as follows:

where,φ andψ are the electric and magnetic potential at the top surface of FGSMEE plate,respectively.
2.2. Kinematics of FGSMEE plate deformations
The Layerwise shear deformation model used to govern the kinematic deformations can be represented as follows [59]:

in which, u and v are the axial displacements along x- and y-,respectively. Meanwhile, the terms u0and v0represent the translational displacements of any point lying on the mid-surface along x-and y-axes,respectively.The generalized rotations of the normal to mid-plane of the substrate, viscoelastic layer and piezoelectric patch about the y-axis are denoted by θx, κxand γx, respectively.Similarly θy, κyand γyrepresents the same about the x-axis. The displacement continuity condition between the adjacent continua can be satisfied with the help of the singularity function denoted within the brackets.
To accomplish effective vertical actuation of ACLD treatment and to enhance the accuracy of the results, a higher order transverse displacement model is assumed in the present analysis,which was neglected in Kanasogi and Ray[55].

Table 1Material properties corresponding to BaTiO3 - CoFe2O4 and 1-3 PZC patch ([55,59]).

where,w0refers to the transverse displacement at any point on the reference plane,θzand κzare the generalized displacements representing the gradients of the transverse displacement in the FGSMEE substrate plate and the viscoelastic layer,respectively with respect to thickness coordinate.
The generalized displacement components are categorized as follows:

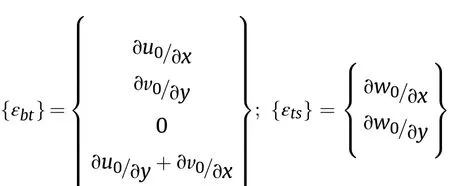
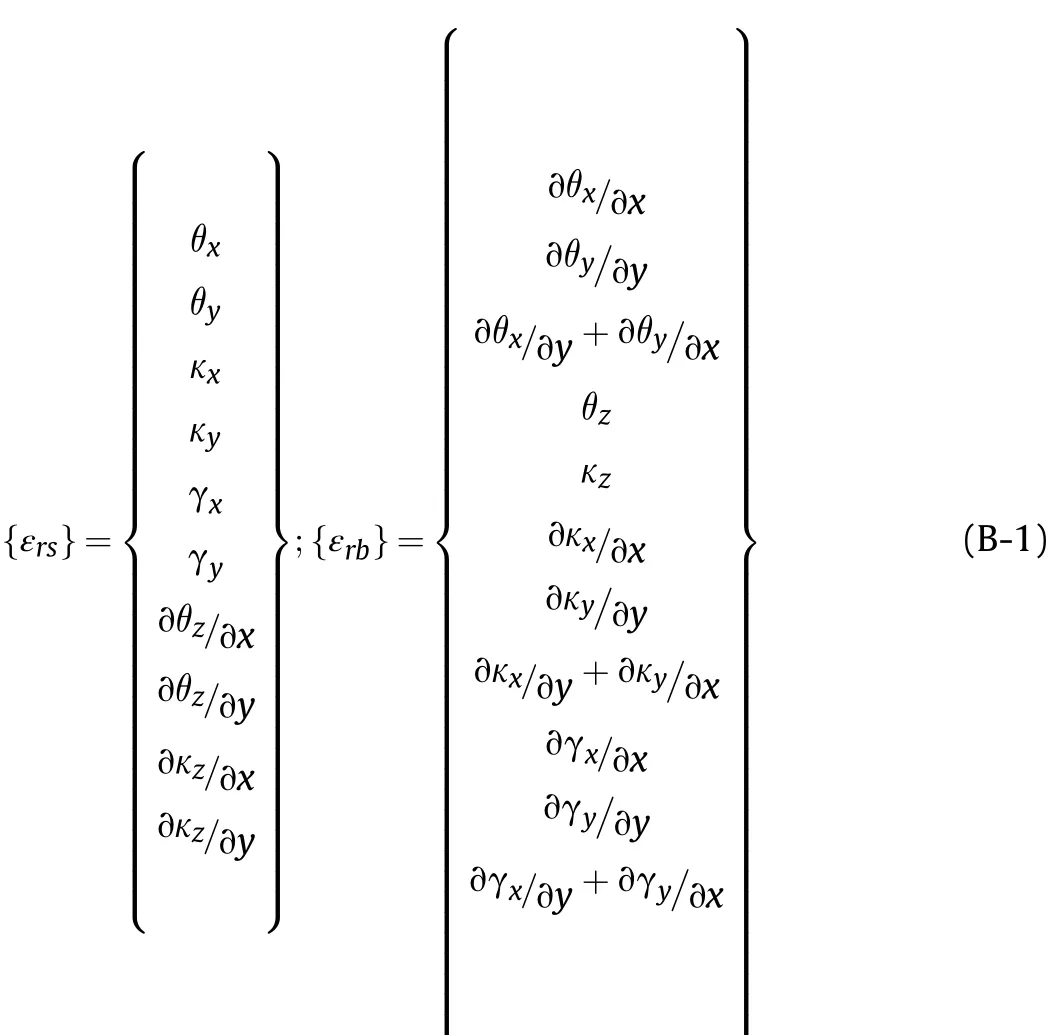
The strain vectors can be classified as the shear strain vector{εs}comprising of transverse shear strains and the bending strain vector{εb}constituting of in-plane shear strain and normal strains,which can be illustrated as follows:


where,the superscripts P and V is correspond to the 1-3 PZC layer and viscoelastic layers of ACLD patch, respectively. The different strain-displacement sub matrices along with the various transformation matrices [Z1] to [Z5] mentioned in Eqs. (12) and (13) are shown in Appendix (Eq. (B-2)).
2.3. Finite element formulation
In order to model the geometry of FGSMEE plates, an eight noded isoparametric quadrilateral element is used.The generalized degrees of freedom can be represented as follows:

where, εx, εyand εzare the normal strains along x-, y-and z-axes,respectively.Further,εxyis the in-plane shear strain;εxzand εyzare the transverse shear strains.The strain vector{εb}corresponding to any point lying in FGSMEE plate and 1-3 PZC layer,respectively can be shown as follows:

Similarly, transverse shear strain vectors {εs} associated with the different layers of ACLD treated FGSMEE plate can be depicted as follows:
Further, using displacement approximations, the generalized displacement vectors{dt} and {dr}, electric potential φ and magnetic potential ψ at any point within the element can be represented in terms of the nodal displacement vectorsandnodal electric potential {φe} and nodal magnetic potentialrespectively, as follows:


in which, Niis the natural coordinate shape function associated with the ith node of the eight noded isoparametric quadrilateral element used. [Nt], [Nr], [Nφ] and [Nψ] are the shape function matrices. Itand Irare identity matrices.
The electric and magnetic fields depicted in Eq.(6)can hence be expressed as follows:

Considering the above FE quantities, the strain-displacement relationship can be established by

where, the different [Bi] matrices (i = tb, rb, ts and rs) are given in the Appendix-B (Eq.(B-3)).Therefore Eqs. (12)and (13)can be rewritten as

2.4. Governing equations
The governing equations of motion for ACLD treated FGSMEE plate are derived by considering first variations of total potential energy(δTp)and kinetic energy(δTk)and employing the Hamilton’s principle as follows [59]:

The total potential energy (δTp) of the overall system can be given by,

where, δTpS, δTpVand δTpPare the potential energy of the FGSMEE substrate, the viscoelastic layer and the 1-3 PZC patch,respectively. Further, each term can be expressed as follows[48,49]:

Since the thickness of the viscoelastic layer considered is very small compared to the thickness of other layers and its axial elastic constants are much lower than that of the other layers, the strain energy of this layer corresponding to the normal strains is negligible.
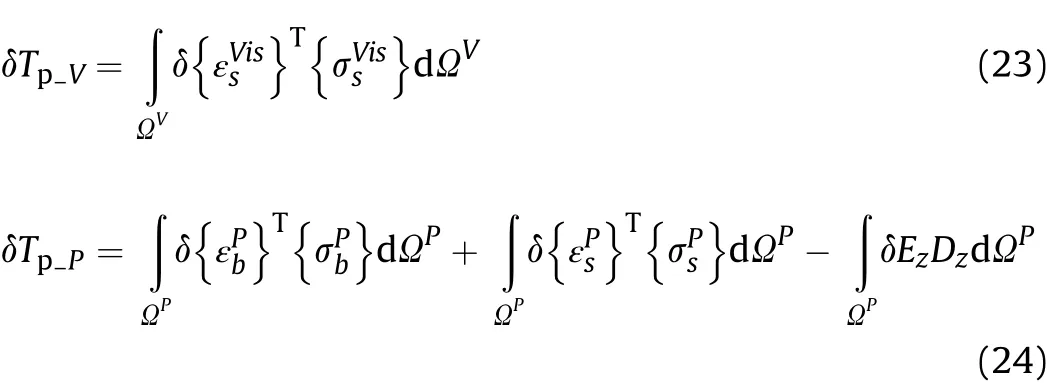
in which, Ωk, ΩVand ΩPrepresents the volume of the FGSMEE substrate layer,viscoelastic and 1-3 PZC patch,respectively.Qφand Qψare the surface electric and magnetic charge densities, respectively. Further, {f} is the traction load vector and V refers to the voltage supplied to 1-3 PZC patch.
By substituting the constitutive equations (Eq. (1)), straindisplacement relations (Eq. (19)) and other FE parameters (Eqs.(14)-(17)) in Eq. (21), the total potential energy can be re-written as follows:
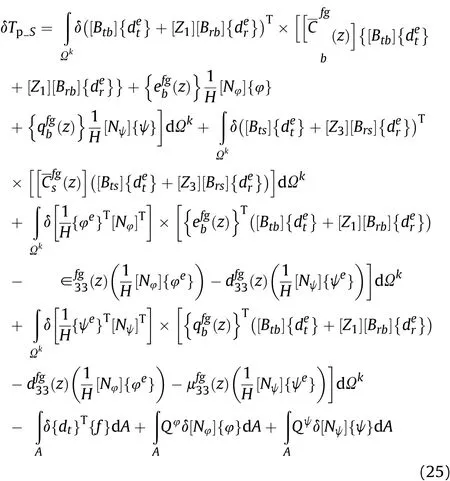
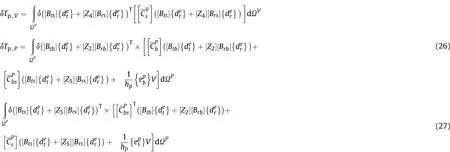
Assigning different rigidity matrices, stiffness matrices and force vectors, Eqs. (25)-(27) can be represented as follows:

The explicit representation of various coupled stiffness matrices and force vectors appearing in Eq. (28) are depicted in Appendix-C.Analogously, the kinetic energy of the typical element of ACLD-FGSMEE plate can be given by,

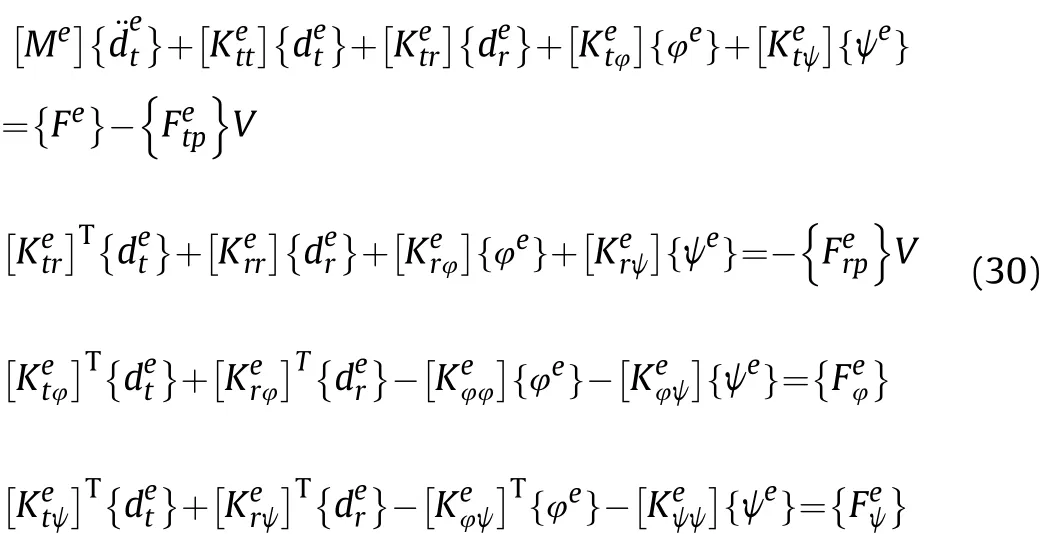
The elemental equations of motion for the overall ACLD treated FGSMEE plate is obtained through condensation technique [59]:
2.5. Skew boundary transformation
The transformed displacement components of the nodes lying on the skew edges with respect to transformed axes x’-,y’-and z’-can be represented as follows:


Further, [Lt] and [Lr] the transformation matrices which can be expressed as [59].
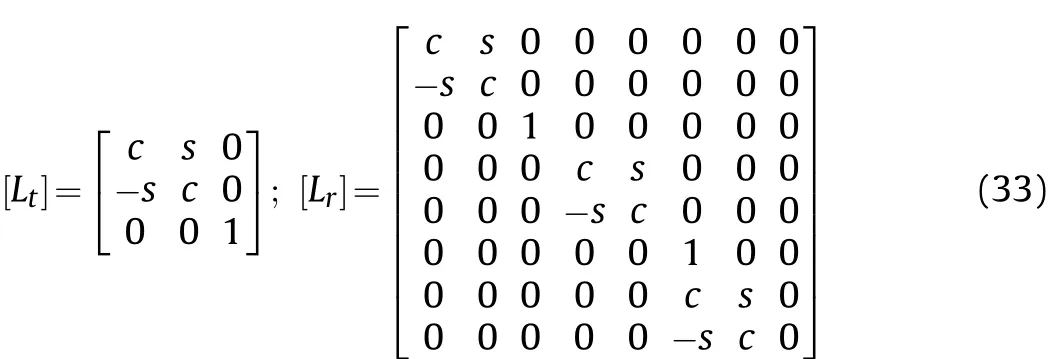
where, c=cos λ and s = sin λ. With this transformation, the coupled elemental stiffness matrices having atleast one node existing on the transformed skew edge may be given by
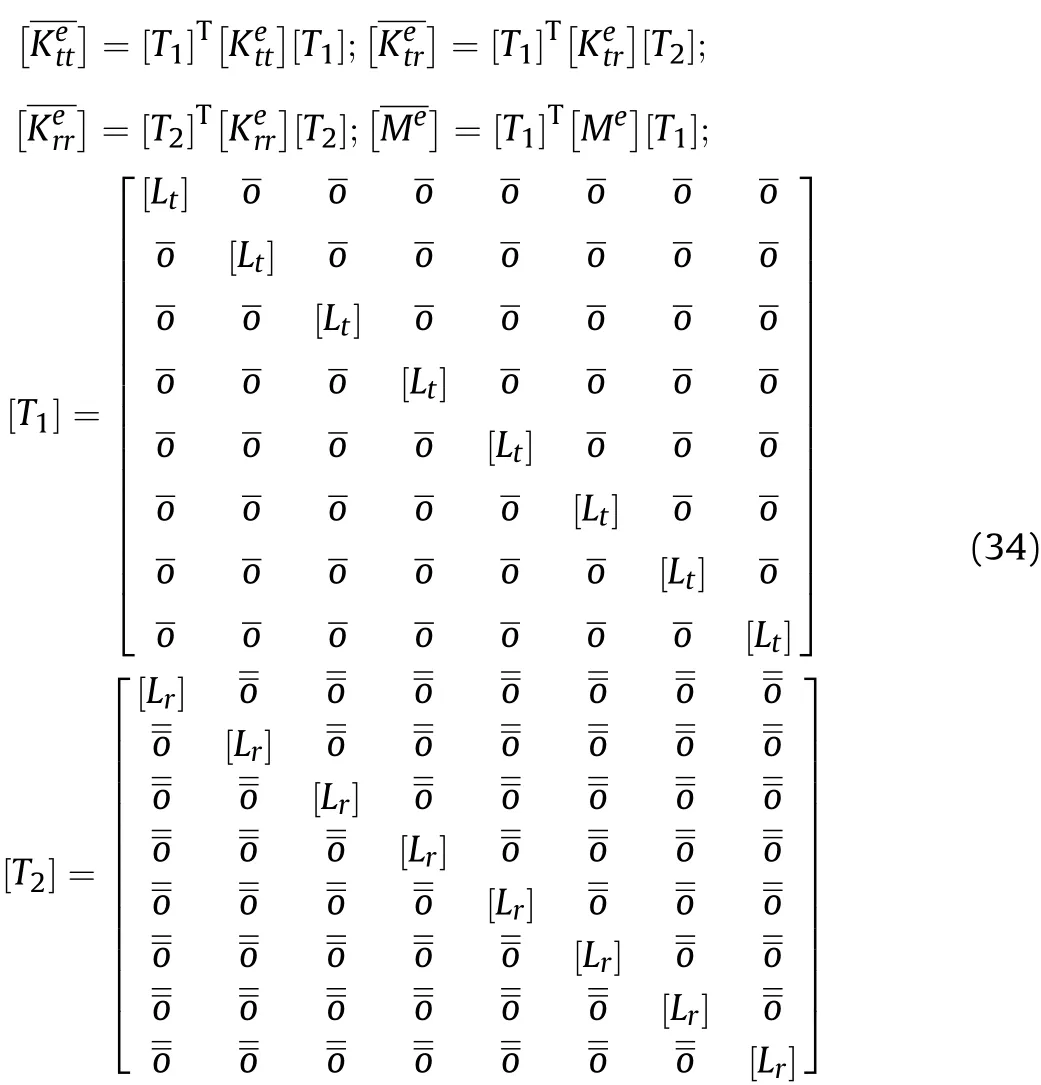
Once the transformations have been carried out, the coupled equilibrium equation of motion of ACLD-FGSMEE plate can be expressed in the global form as follows [57,59]:
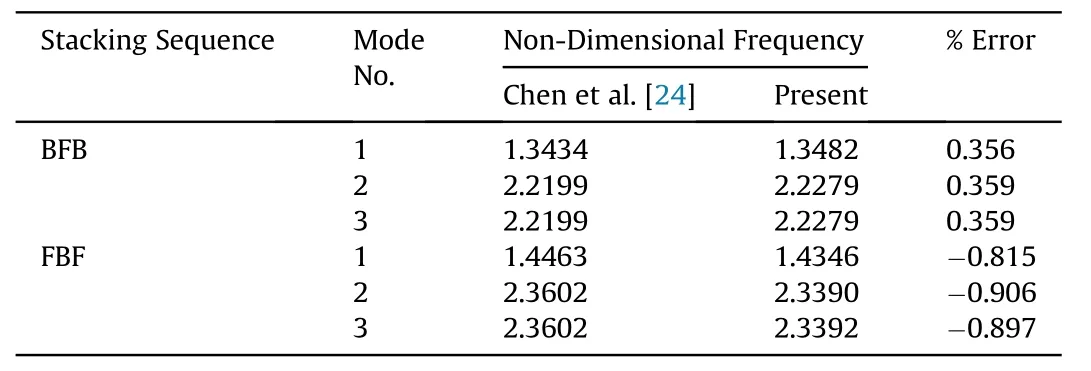
Table 2Corroboration of the natural frequencies utilizing the present FE formulation.
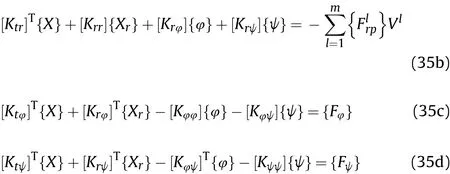
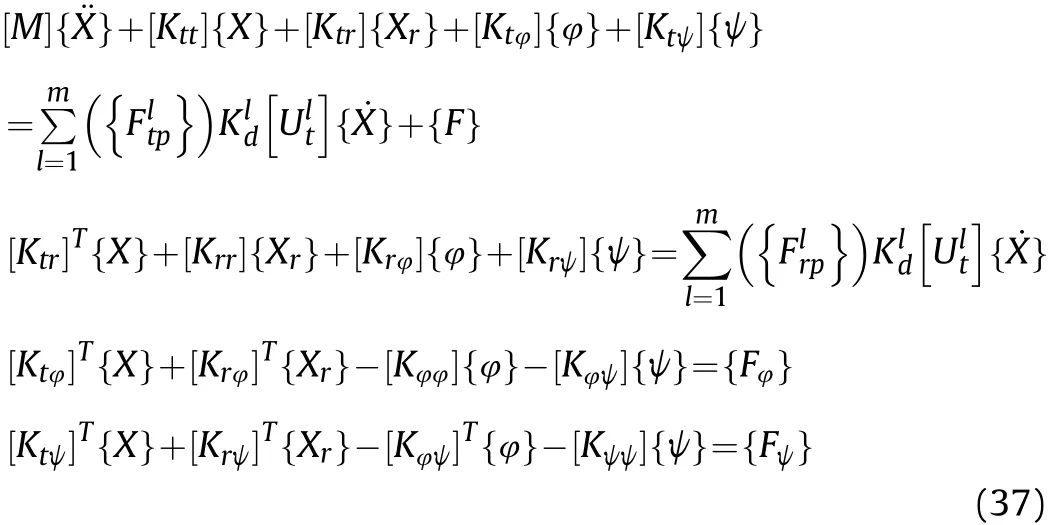
where, [M] is the global mass matrix; [Ktt], [Ktr] and[Krr] are global elastic stiffness matrices; [Ktφ] and [Krφ] are the global coupled electro-elastic stiffness matrices; [Ktψ] and [Krψ] are coupled magneto-elastic stiffness matrices; [Kψψ] and [Kφφ] magnetic and electric stiffness matrices, respectively; {F} and is the mechanical force vectors; {Fφ} and {Fψ} are the electrical force vector and magnetic force vector, respectively. Meanwhile, m denotes total number of patches and Vlindicates the magnitude of the voltage applied to the lth patch.
Further, for the closed-loop model, a simple derivative control law has been adopted. Therefore, control voltage can be explicitly expressed in terms of the derivative of global nodal degrees of freedom as follows:

3. Results and discussion
This section presents a series of illustrations are to clarify the effect of ACLD treatment on the controlled linear frequency behavior of FGSMEE plates through the FE formulation derived in the previous section.A converged 10×10 FE mesh discretised by an eight noded isoparametric quadrilateral element is utilized in this study.The present analysis considers the geometry of the FGSMEE plates to be a = b = 0.5 m; and a/H = 100. In order to facilitate numerical evaluation, the thicknesses of 50.8 μm and 250 μm are assigned to the visco-elastic layer and the 1-3 PZC layer, respectively.An actuating force of 2 N is applied at(a/2,b/4 Cos λ,H/2)to excite the first few modes of the FGSMEE plate. In addition, the details of viscoelastic layers can be illustrated as follows [61]:
Complex shear modulus,G = 20(1+i)MN/m2;Poisson’s Ratio,ν = 0.49; Density, ρv= 1140 kg/m3. Meanwhile, the skew boundary constraints enforced in the present analysis can be illustrated as follows:

Table 3Non-dimensional frequency parameter for the clamped-clamped laminated composite skew plate(a/h = 10).

3.1. Verification of the FE model
The results obtained through the FE formulation proposed in the present work are verified for its correctness with the previous published articles. In this regard, the FGSMEE plate is reduced to layered MEE plate. Therefore, the material properties are reduced to homogeneous material by setting the power-law index to 0 and∞to obtain homogeneous B and F layer,respectively.A comparison is made between the results obtained for layered MEE plates through the current FE formulation and the results mentioned by Chen et al. [24]. In this regard, the ACLD effect is neglected. The similarity between the compared results is reflected in Table 2.An extended verification is illustrated in Table 3 to justify the procedure adopted for skew edge transformation. To this end, the numerical problem of skew composite plates posed in Ref. [55] is resolved once again via present method. The effectiveness of this formulation is evident from the minimal discrepancies between the results as shown in Table 3. Therefore, an extension of the current formulation can be made to assess the FGSMEE plates with ACLD.
The effect of skewness on the frequency response of the plates is illustrated in Fig. 2(a) and (b). It is crucial to point out that a remarkable reduction in the transverse deflection (w) and the control voltage can be noticed with increasing skew angles. The reason is due to the fact that with higher skewness of the plate,the plate area reduces which inturn enhances the stiffness of the plate.According to the diagrams,it can also be observed that among the two forms of functional gradation considered,‘B’rich bottom yields a lesser magnitude of the transverse deflection(w)and the control voltage in contrast to‘F’rich bottom.It may be due to the fact that the excitation load is applied on the top surface of the plate and for FGSMEE plate made of ‘B’ rich bottom, the stiffness gradually increases towards the top surface as the percentage of‘F’with higher elastic coefficient improves. In turn the resistance to deflection rises.Therefore,a slightly greater attenuation capacity is witnessed for FGSMEE plate made of‘B’rich bottom.Based on the figure,it can be concluded that FGSMEE with a higher skew angle and ‘B’ rich bottom material distribution results in higher attenuation of frequency response and requires minimal control voltage to accomplish it.
Fig. 3(a) and (b) are devoted to plot the disparities in the deflection w and requisite control voltages of FGSMEE plates with different power-law indices. As witnessed in these figures, the increasing power-law index‘r’,results in an effective improvement in the attenuation capability. As the power-law index ‘r’ improves,the predominant influence of pure piezomagnetic phases(F)in the overall FG composition increases. Therefore, the stiffness of the FGSMEE plate enhances which reduces the deflection of the plate.It holds good for both ‘B’ rich bottom and ‘F’ rich bottom material distributions. On the other hand, the impact of coupling fields on the frequency response of FGSMEE plate is illustrated in Fig. (4)considering r = 0.5 and ‘B’ rich Bottom material distribution. As inferred from this figure,the coupled interaction results in reduced value of w and control voltage as opposed to the frequency response neglecting coupling (considering only the elastic fields).This is due to the additional contribution of coupled stiffness to the overall stiffness of the FGSMEE plate.Furthermore,considering the coupling effects, the variation of transverse deflection and control voltage with different power-law index and skew angles are illustrated in Tables 4 and 5, respectively.
Fig. 5(a) contrasts between the frequency response of FGSMEE plates controlled with ACLD and uncontrolled state.‘B’rich Bottom material distribution and r=1.0 is considered for this study.It can be inferred from this figure that incorporating ACLD treatment results in a drastic reduction of the amplitude of vibration.On these grounds,the study is extended to evaluate the effect of control gain(Kd) on the damping behavior of FGSMEE plate. Based on Fig. 5(b)and Table 6 it is clear that a higher control gain has a noteworthy effect on the controlled response of FGSMEE plate due to improved damping force produced.
Meanwhile, the influence of patch locations is studied considering two variants of patch positions. The first corresponds to the two end patches(EP)embedded at two ends of the FGSMEE plate as depicted in Fig. 1(a). Analogously, the second corresponds to the single centre patch (CP) placed at the centre of FGSMEE plate Fig. 1(b). Fig. 6(a) and (b) show the effect of patch position on FGSMEE plate (‘F’ rich bottom material distribution) for different skew angle and power-law index. As same as former diagrams, a significant influence of using higher skew angle and power-law index is witnessed here as well. Alongside, based on the diagrams it can be highlighted that irrespective of the skew angle and powerlaw index, the centre patch has a predominant effect on vibration attenuation.This may be due to the fact that the EP is nearer to the plate edges which are already constrained. Therefore, the contribution of EP in improving the plate’s stiffness is minimal. Meanwhile,the CP improves the stiffness of the plate along in addition to the constraints provided at the edges. This leads to reduced vibration in contrast to the EP. Tables 7 and 8 encapsulate the combined influences of all these parameters along with the patch positions on the maximum values of w and control voltage of FGSMEE plate, respectively.
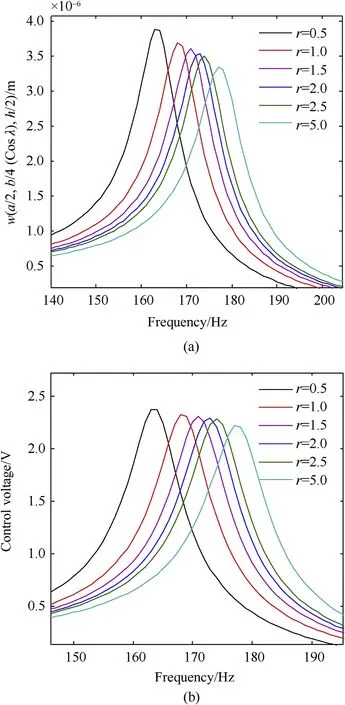
Fig. 3. Influence of power-law index on (a) transverse deflection w and (b) control voltage (λ = 30ο; B rich bottom; centre patch; Kd = 600).
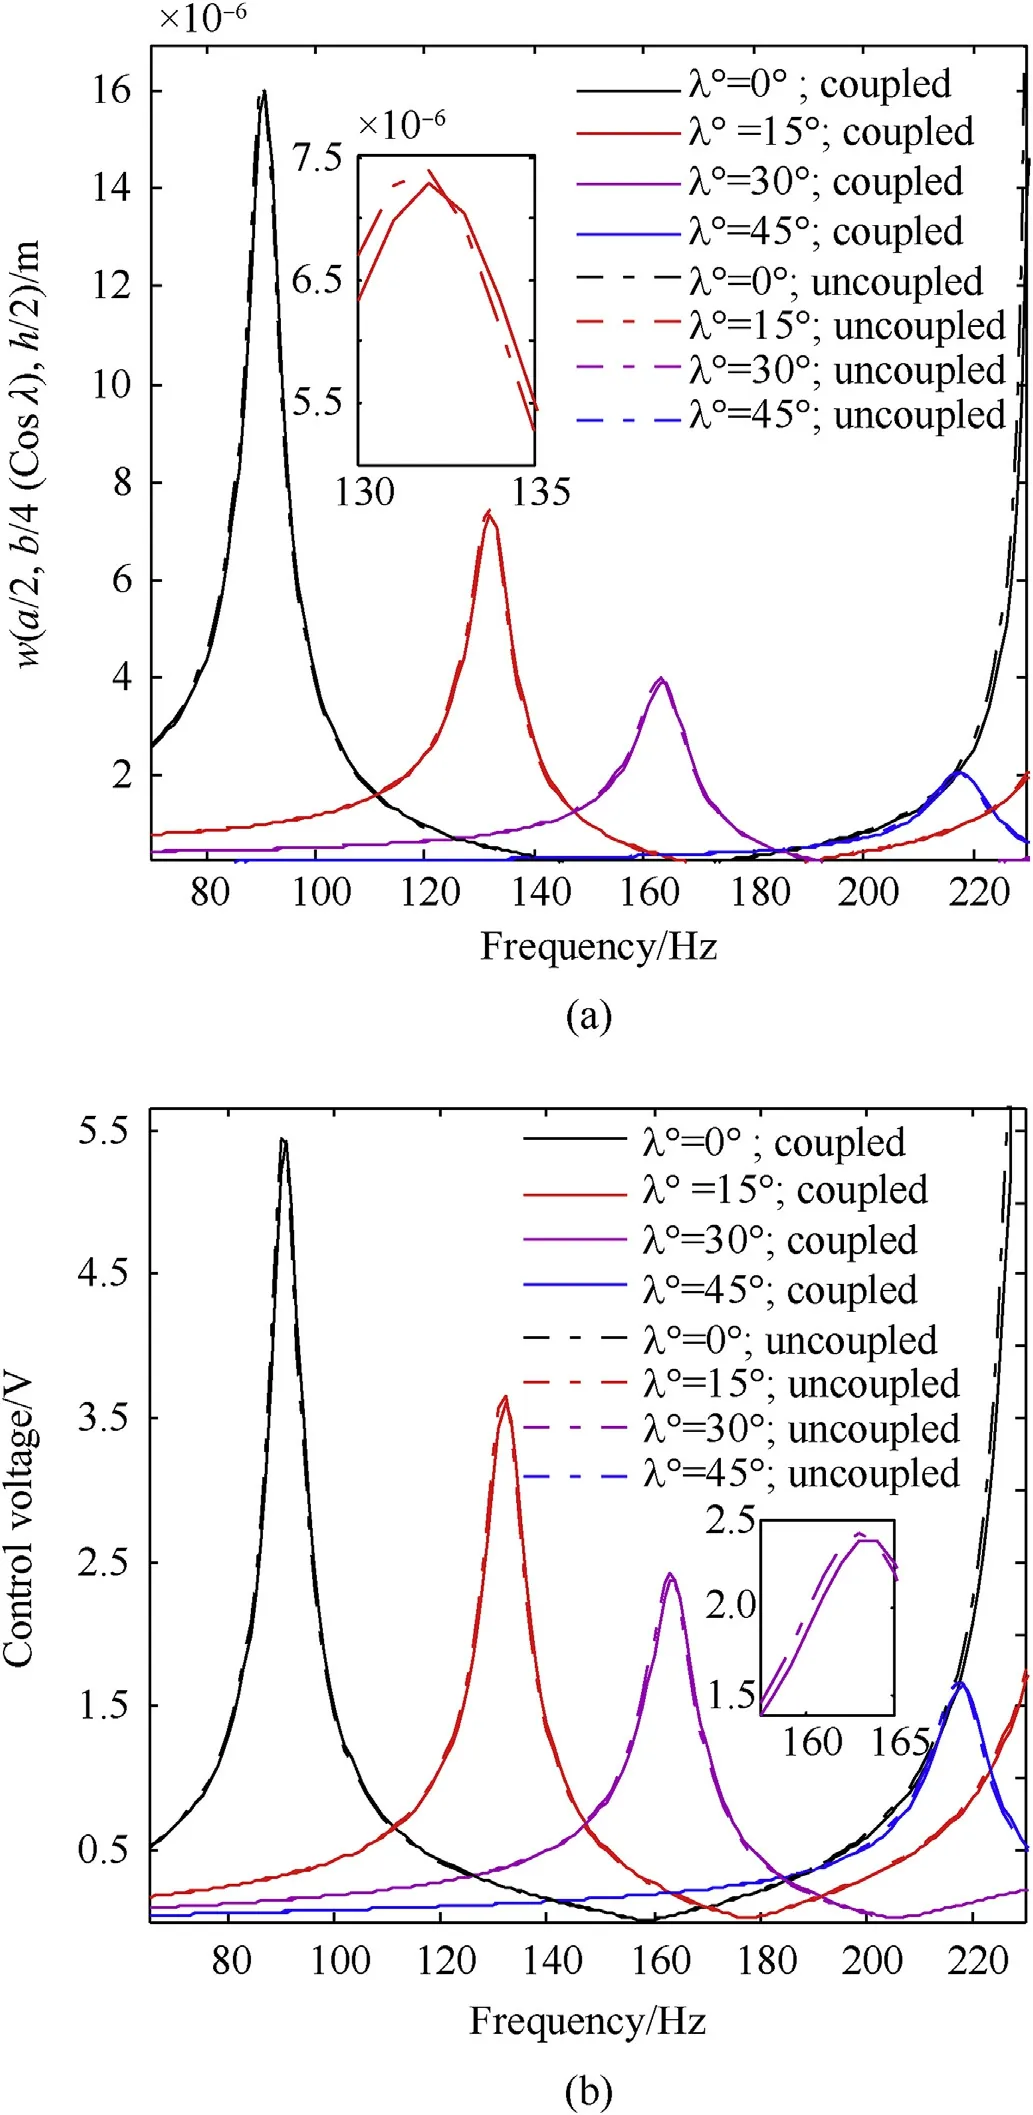
Fig. 4. Influence of coupling on (a) transverse deflection w and (b) control voltage(r = 1; B rich bottom; centre patch; Kd = 600).
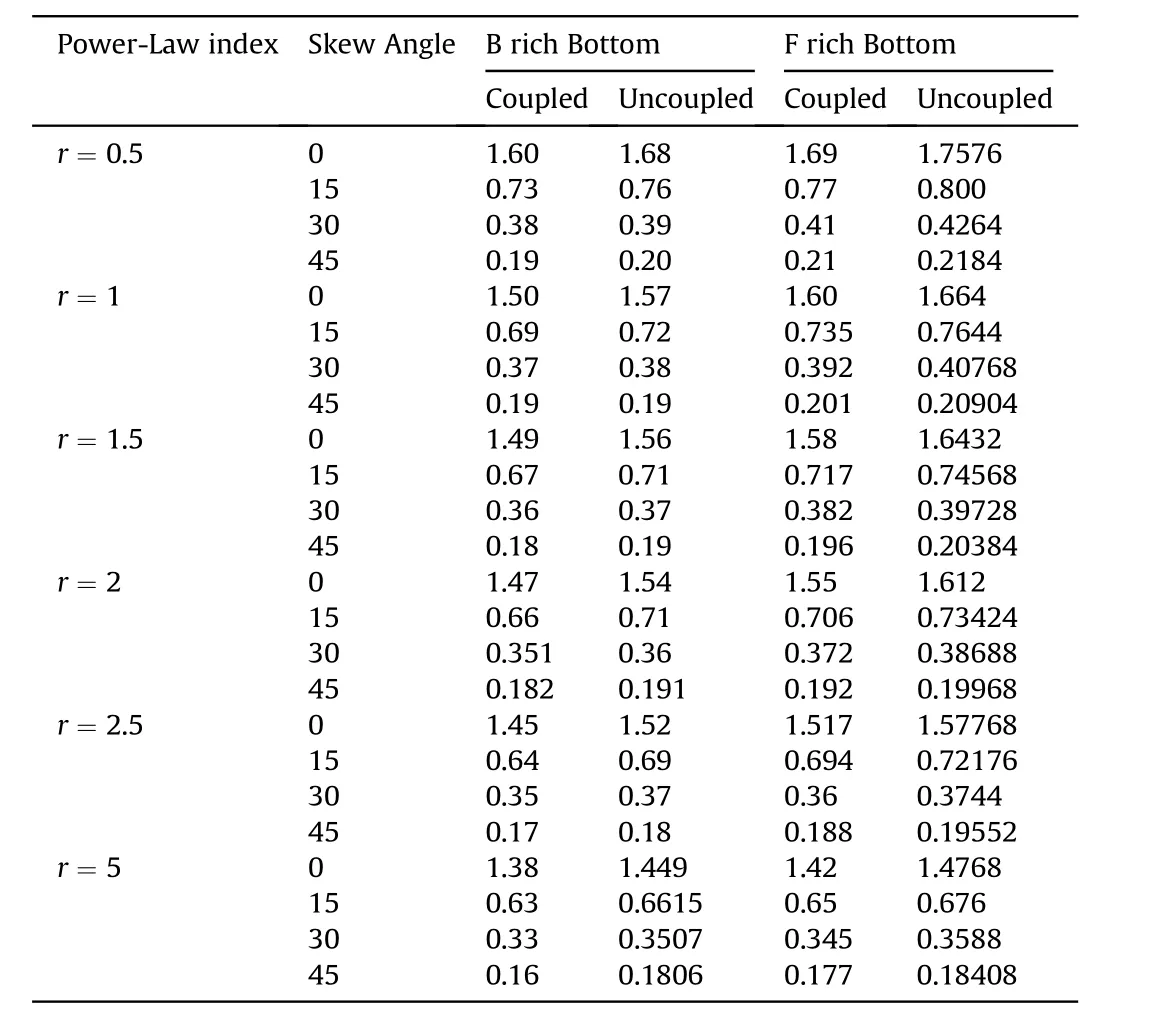
Table 4Effect of skew angle, power-law index, coupling on the transverse deflection w(× 10-5 m).
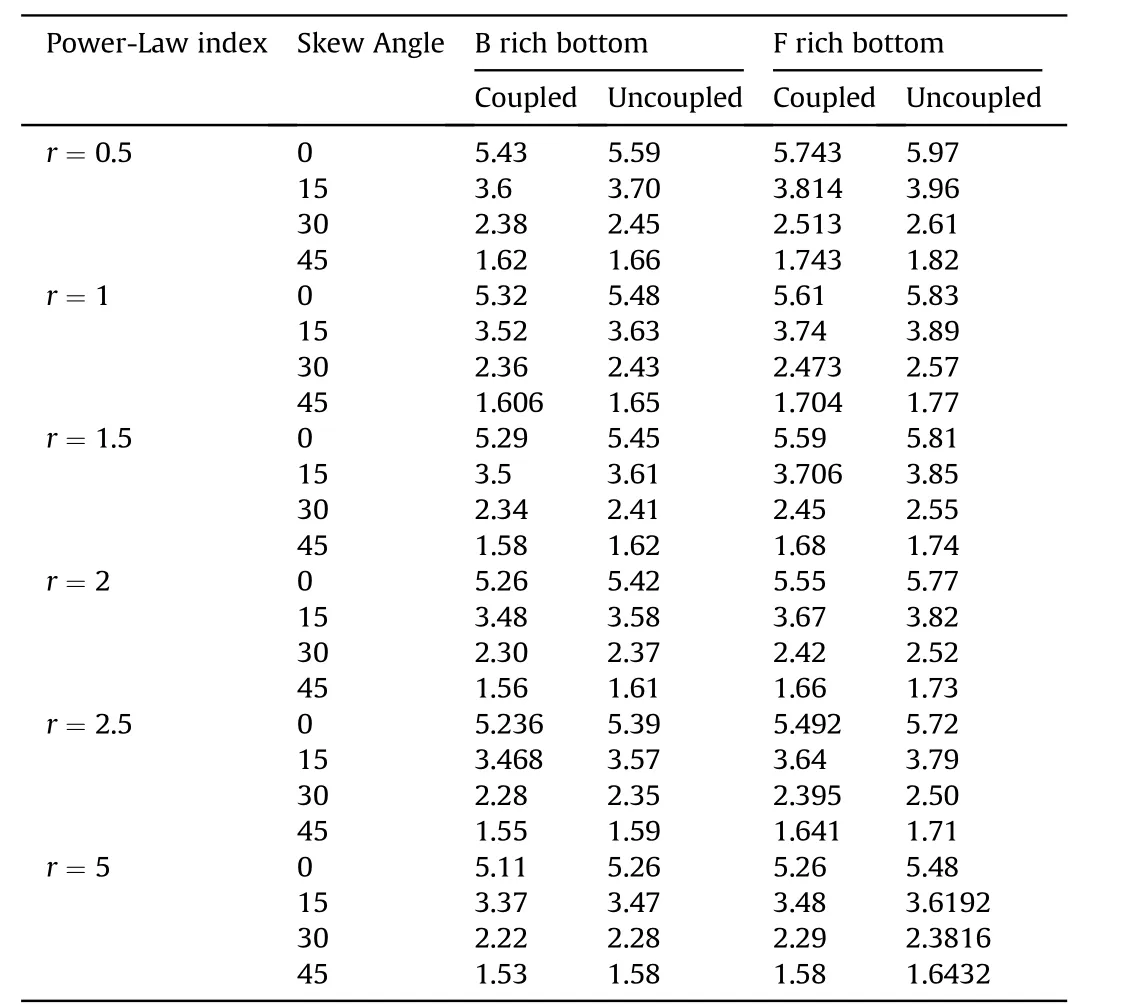
Table 5Effect of skew angle, power-law index, coupling on the control voltage(in Volts).
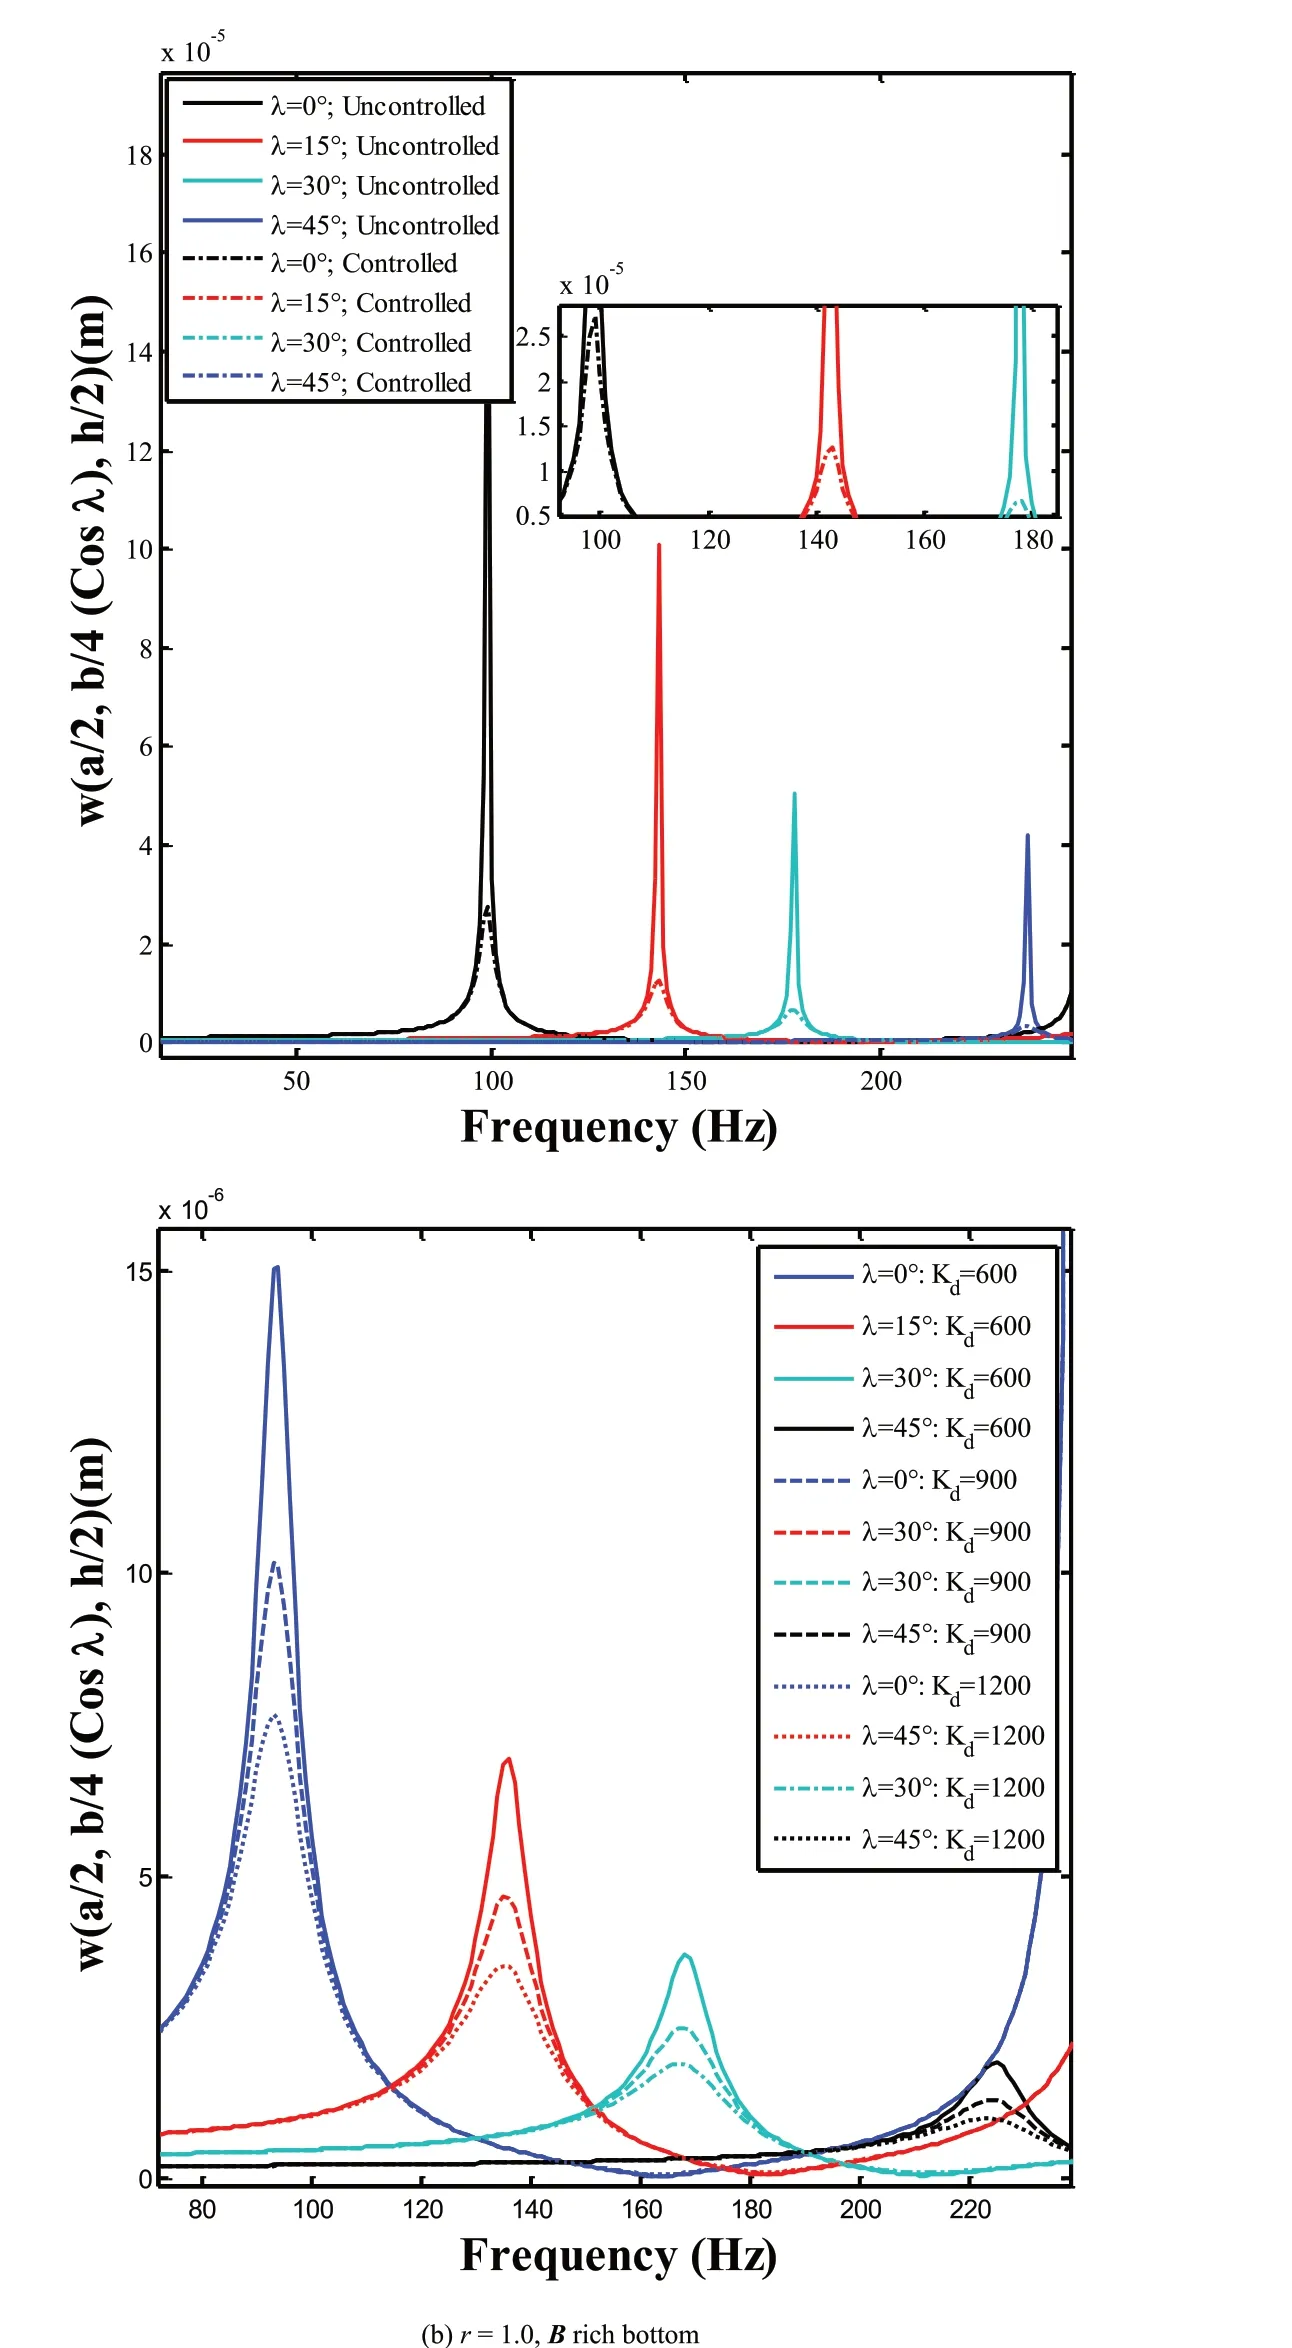
Fig. 5. Variation of transverse deflection w of (a) ACLD treated and untreated FGSMEE plate (b) different control gains of ACLD.

Kd = 1 20 0 0.80 0.37 0.21 0.11 0.77 0.35 0.19 0.10 0.71 0.32 0.17 0.09 Kd = 9 00 1.08 0.49 0.27 0.14 1.03 0.46 0.24 0.13 0.95 0.43 0.22 0.11 F rich B otto m Kd = 6 00 1.60 0.73 5 0.39 2 0.20 1 1.55 0.70 6 0.37 2 0.19 2 1.42 0.65 0.34 5 0.17 7 Kd = 1 20 0 0.76 0.19 0.09 0.35 0.73 0.33 0.17 0.08 0.69 0.31 0.16 0.07 0.46 Kd = 9 00 0.25 1.01 0.13 0.98 0.43 0.22 0.12 0.92 0.41 0.20 0.10 B rich B otto m Kd = 6 00 Effe ct o f con trol g ain (Kd) o n the tra nsve rse d ef lection w ( × 1 0-5 m).1.50 0.69 2 0.37 0.18 9 1.47 0.66 9 0.35 1 0.18 2 1.38 0.63 0.33 4 0.17 Sk ew A ng le 015304501530450153045 Ta ble 6 Po we r-La w ind ex r = 1 r = 2 r = 5
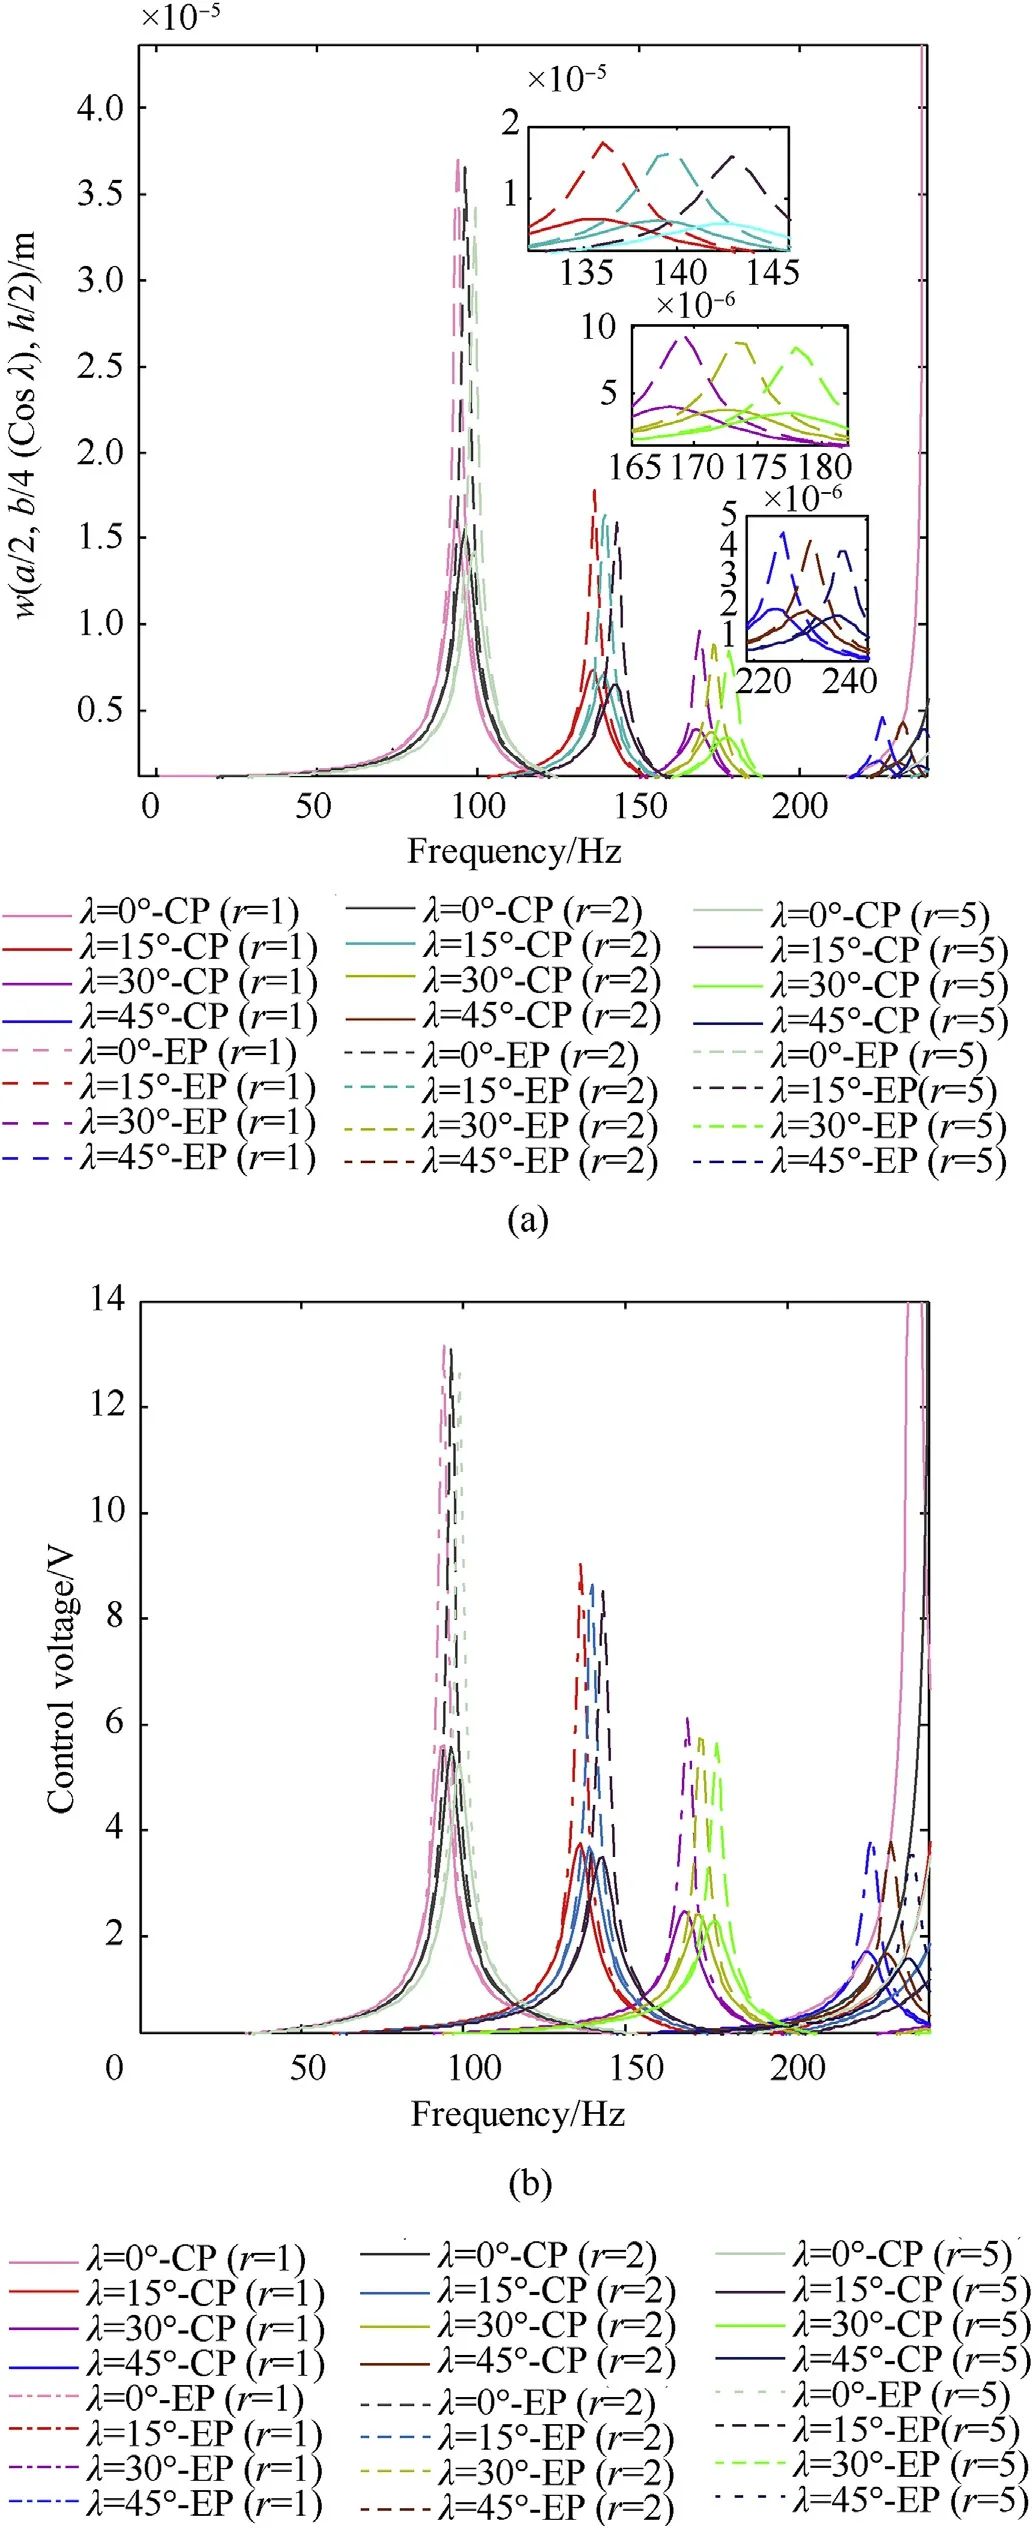
Fig.6. Effect of patch positions on(a)transverse deflection w and(b)control voltage(F rich bottom; centre patch; Kd = 600).

F rich b otto m C.P 5.26 3.48 2.29 1.58 E.P 12.6 5 8.48 5.63 3.53 C.P 2.22 5.11 1.53 3.37 E.P 8.16 B rich bo ttom 12.2 8 5.48 3.3 C.P F rich b otto m 5.49 2 3.64 2.39 5 1.64 1 13.0 8 E.P 8.52 5.73 Sk ew A ng ler = 0.5r = 1r = 1.5r = 2r = 2.5r = 5 3.72 2.28 C.P 5.23 3.46 1.55 B rich bo ttom E.P 12.4 1 8.26 5.53.5 F rich b otto m C.P 5.55 3.67 2.42 1.66 E.P 13.1 5 8.62 5.84 3.74 C.P 5.26 2.30 3.48 1.56 B rich bo ttom E.P 12.4 5 8.29 5.62 3.6 F rich b otto m C.P 5.59 3.70 6 2.45 1.68 E.P 13.2 1 8.87 5.96 3.78 C.P 5.29 2.34 3.51.58 B rich bo ttom E.P 12.4 8 8.45 5.69 3.63 F rich b otto m C.P 5.61 3.74 2.47 3 1.70 4 E.P 13.2 5 8.89 6.11 3.8 B rich b otto m C.P Effe ct o f p atch p ositio n o n the req uire d con trol v olta ge (in V olts).5.32 3.52 2.36 1.60 6 E.P 12.6 3 8.47 5.83.7 F rich b otto m C.P 5.74 3 3.81 4 2.51 3 1.74 3 E.P 13.8 9.03 6.22 3.98 C.P 5.43 2.38 3.61.62 B rich bo ttom E.P 13.0 5 8.54 5.92 3.8 Ta ble 7 0153045

F rich b otto m C.P 1.42 0.65 0.34 5 0.17 7 E.P 3.42 1.59 0.84 0.39 B rich b otto m C.P 1.38 0.63 0.33 4 0.17 2 r = 5 E.P 3.32 1.53 0.82 0.38 F rich b otto m C.P 1.44 7 0.66 1 0.35 0.17 9 E.P 3.64 1.60 0.88 0.40 B rich b otto m C.P 1.44 7 0.66 1 0.35 0.17 9 r = 2.5 E.P 3.46 1.55 0.85 0.4 F rich b otto m C.P 1.55 0.70 6 0.37 2 0.19 2 E.P 3.66 1.64 0.89 0.42 B rich b otto m C.P 1.47 0.66 9 0.35 1 0.18 2 r = 2 E.P 3.48 1.57 0.86 0.41 F rich b otto m C.P 1.58 0.71 7 0.38 2 0.19 6 E.P 3.72 1.72 0.92 0.43 C.P 1.49 0.36 0.68 0.18 r = 1.5 B rich bo ttom E.P 3.52 1.63 0.88 0.42 F rich b otto m C.P 1.60 0.73 5 0.39 2 0.20 1 3.75 Effe ct o f p atch p ositio n o n the tra nsve rse d ef lection w ( × 1 0-5 m).E.P 1.77 0.96 0.45 B rich b otto m C.P 1.50 0.69 2 0.37 0.18 9 r = 1 E.P 3.55 1.68 0.91 0.43 C.P 1.69 0.77 0.41 0.21 F rich bo ttom E.P 4.06 1.78 1.01 0.48 C.P 1.60 0.38 0.73 0.19 r = 0.5 B rich bo ttom E.P 3.85 1.70.96 0.46 Ta ble 8 Sk ew A ng le 0153045
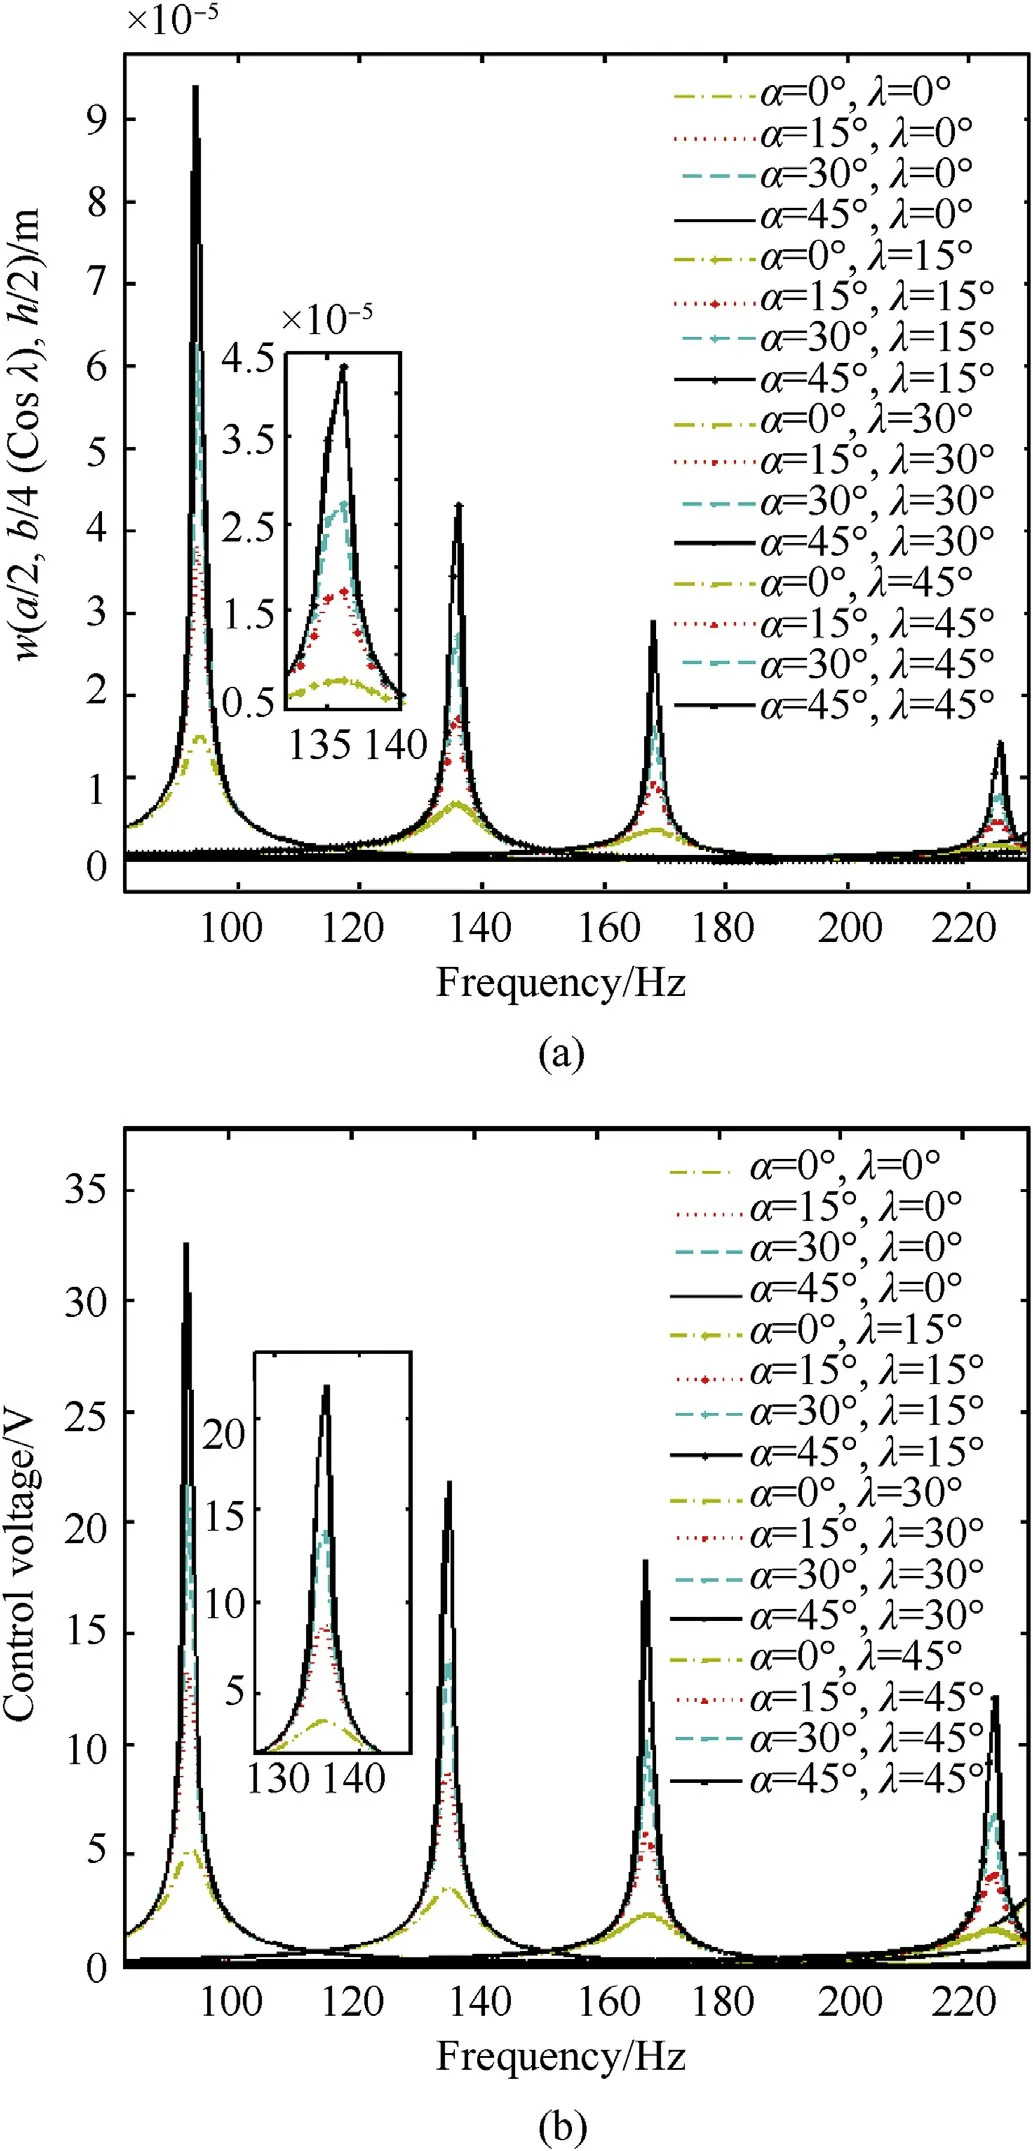
Fig.7. Effect of piezoelectric fiber orientations of 1-3 PZC on(a)transverse deflection w and (b) control voltage (r = 1; B rich bottom; centre patch; Kd = 600).

Table 9Effect of piezoelectric fiber orientation angle on the transverse deflection w ( × 10-5 m).

Table 10Effect of piezoelectric fiber orientation angle on the required control voltage (in Volts).
Furthermore, the analysis is extended to investigate the effects of piezoelectric fiber orientations of 1-3 PZC layer on the FGSMEE plate. The variation of w and control voltage illustrated in Fig.7(a)and(b),respectively,affirm the maximum control capability of 1-3 PZC can be noticed if the piezoelectric fibers in it are vertically aligned (α = 0ο). Furthermore, the influences of other parameters associated with piezoelectric fiber orientations, on the w and control voltage are illustrated in Tables 9 and 10, respectively. The influence of using different combinations of geometric and material parameters can be observed again. Hence forward, the effect of such increasing phenomenon shall be considered in the design processes.
4. Conclusions
The present article includes an FE procedure to clarify the controlled frequency response of FGSMEE plates coupled with ACLD usage. A simple power-law distribution is assumed to estimate variation of the material properties across the plate thickness.Under the framework of Hamilton’s principle, the governing equations of motion are derived incorporating skew transformation and solved through condensation technique. The most important outcomes can be reviewed as follows:
· FGSMEE plates with higher skew angles display increased attenuation capability.
· Controlled linear response can be intensified increasing the power-law index.
· FGSMEE plate with piezoelectric layer rich bottom layer and to piezomagnetic rich top layer yields a lesser vibration amplitude.
· A single centre ACLD patch with vertically reinforced piezoelectric fibers are found to be more efficient for damping when compared to two edge ACLD patches.
· Increasing the control gain results in intensified damping characteristics.
Data availability
The preliminary data essential to replicate these findings cannot be made public at this time as it forms a vital part of an ongoing study.
Declaration of competing interest
The authors declare no impending conflicts of interest with regard to the work, credits, and/or publication of this article.
Acknowledgements
The first author acknowledges the support of Indian Institute of Science, Bangalore through CV Raman Post-Doc Fellowship under Institute of Eminence Scheme.
Appendix-A. Material property matrices
The different material coefficient matrices of FGMEEM appearing in Eq. (1) can be explicitly represented as follows:
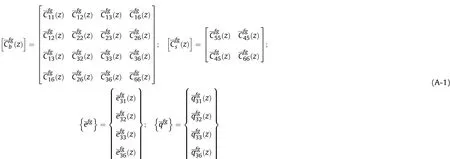
Further, the transformed coupling elastic matricesfor the piezoelectric fiber orientation (α) in the xz- or yz-plane, respectively can be shown as follows:

Also, the elastic stiffness coefficient matrices, piezoelectric coefficient matrices of 1-3 PZC can be given as follows:
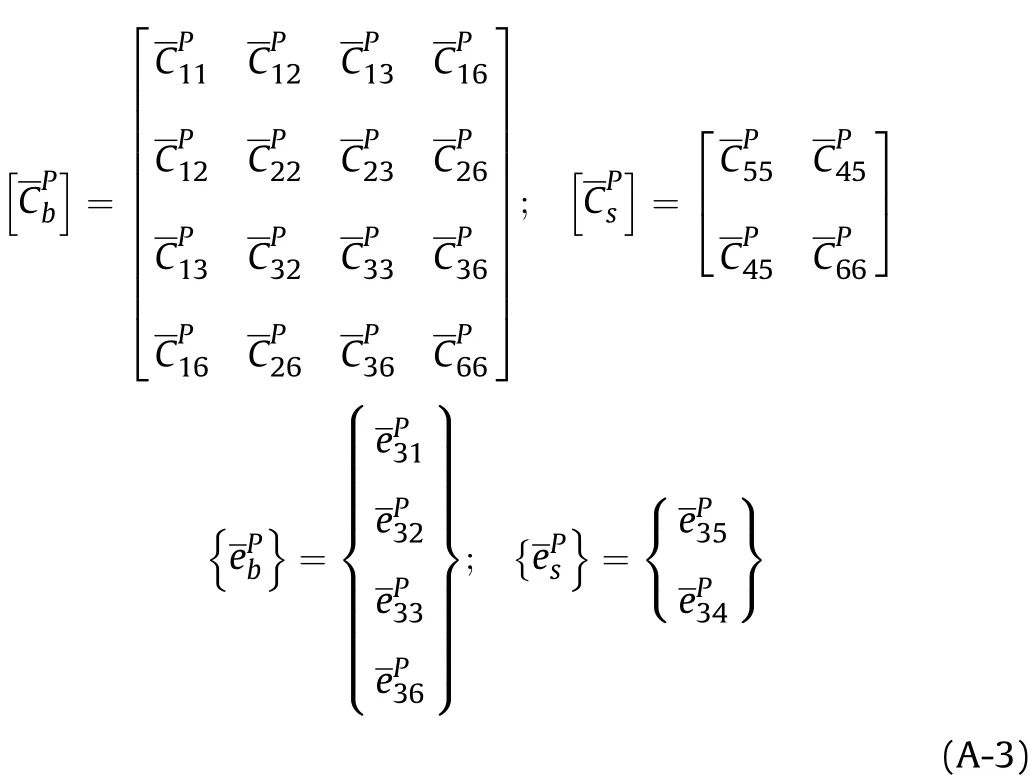
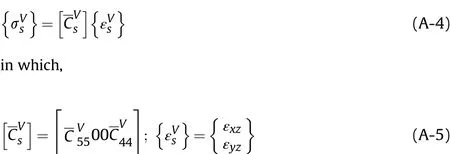
Meanwhile,the stress equation for the viscoelastic layer of ACLD patch can be denoted as follows:
Appendix-B. Strain component and transformation matrices
The strain components appearing in Eqs. (12) and (13) can be illustrated as follows:
Also,the different transformation matrices depicted in Eqs.(12)and (13) can be represented as follows:

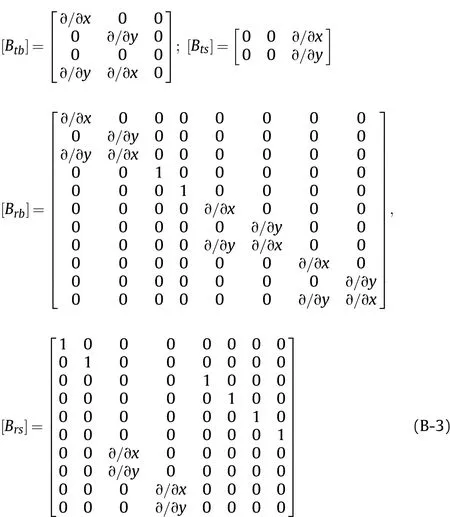


The strain-displacement relationship can be explicitly expressed by,
Appendix C. Stiffness and rigidity matrices
The various elemental stiffness matrices and force vectors appearing in Eq. (30) can be illustrated as follows:
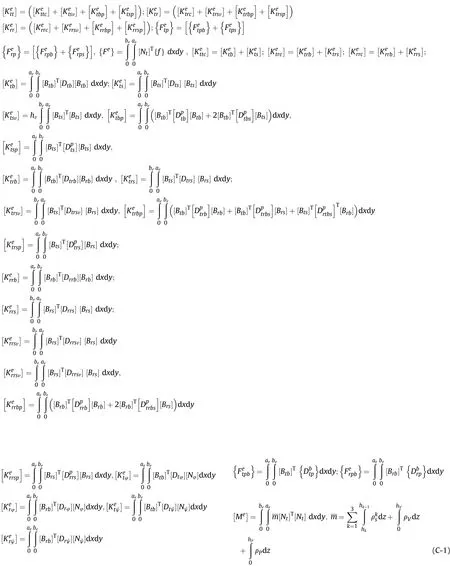
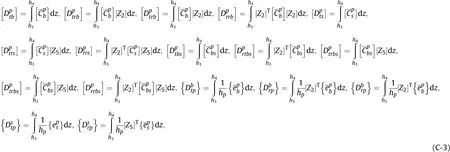
The various rigidity matrices associated with the elemental stiffness matrices are shown by,
1. Rigidity matrices related to FGSMEE substrate
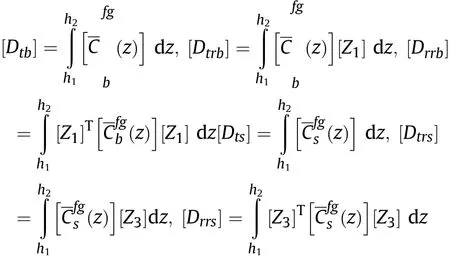
3. Rigidity matrices related to viscoelastic layer of ACLD patch

Appendix-D. Condensation technique
In this section, the detailed condensation procedure to obtain the natural frequency is depicted.
From Eq. (35d), it can be deduced that


2. Rigidity matrices related to 1-3 PZC layer of ACLD patch
By substituting Eq. (D-1) in Eq. (35c), we get,

Grouping the terms based of the coefficient of{dt},{dr},{φ}and{ψ}, Eq. (D-2) reduces to,

From Eq. (D-3), {φ} can be obtained as follows:

Further, substituting (D-1)in Eq. (35b), it be shown that

Bifurcating and rearranging the terms related to the coefficient of {dt}, {dr}, {φ} and {ψ}, results in

Now, substituting (D-5) in (D-7)gives,

Using Eq. (D-9), it can be obtained that

Following the same procedure of substituting (D-1), (D-5) and(D-10) in Eq. (35a), we get

which can be further simplified upon grouping as follows:
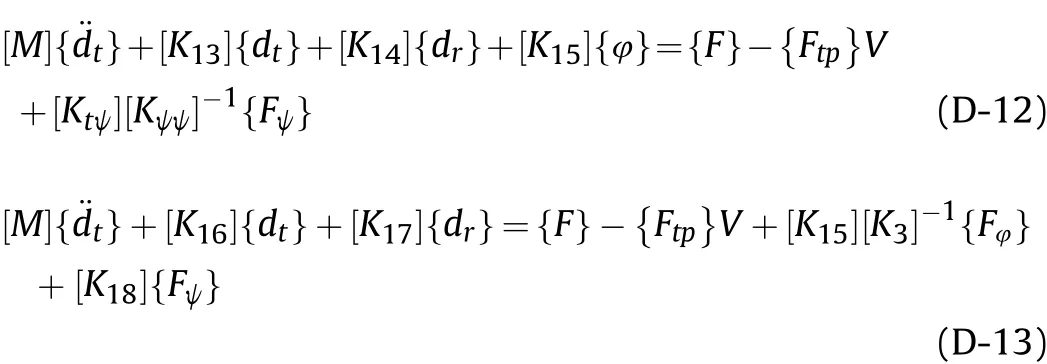
Finally, Eqs. (35a-d) can be represented as a single equation in the form as follows:


which can be simplified to

where, the different stiffness matrices contributing to Eq. (D-15)can be encapsulated as follows:

杂志排行
Defence Technology的其它文章
- Analysis of the stress wave and rarefaction wave produced by hypervelocity impact of sphere onto thin plate
- Effect of bending temperatures on the microstructure and springback of a TRIP steel sheet
- Dynamic parameters of multi-cabin protective structure subjected to low-impact load - Numerical and experimental investigations
- An eikonal equation based path planning method using polygon decomposition and curve evolution
- Consequence of reinforced SiC particles and post process artificial ageing on microstructure and mechanical properties of friction stir processed AA7075
- Crashworthiness performance of hybrid kenaf/glass fiber reinforced epoxy tube on winding orientation effect under quasi-static compression load
