Analysis of the stress wave and rarefaction wave produced by hypervelocity impact of sphere onto thin plate
2020-10-27KenWenXiaoweiChen
Ken Wen , Xiao-wei Chen
a State Key Laboratory of Explosion Science and Technology, Beijing Institute of Technology, Beijing,100081, China
b Institute of Systems Engineering, China Academy of Engineering Physics, Mianyang, Sichuan, 621999, China
c Advanced Research Institute of Multidisciplinary Science, Beijing Institute of Technology, Beijing,100081, China
Keywords:
ABSTRACT Shock wave is emitted into the plate and sphere when a sphere hypervelocity impacts onto a thin plate.The fragmentation and phase change of the material caused by the propagation and unloading of shock wave could result in the formation of debris cloud eventually.Propagation models are deduced based on one-dimensional shock wave theory and the geometry of sphere, which uses elliptic equations (corresponding to ellipsoid equations in physical space) to describe the propagation of shock wave and the rarefaction wave. The “Effective thickness” is defined as the critical plate thickness that ensures the rarefaction wave overtake the shock wave at the back of the sphere.The “Effective thickness” is directly related to the form of the debris cloud. The relation of the “Effective thickness” and the “Optimum thickness” is also discussed. The impacts of Al spheres onto Al plates are simulated within SPH to verify the propagation models and associated theories. The results show that the wave fronts predicted by the propagation models are closer to the simulation result at higher impact velocity. The curvatures of the wave fronts decrease with the increase of impact velocities. The predicted “Effective thickness” is consistent with the simulation results. The analysis about the shock wave propagation and unloading in this paper can provide a new sight and inspiration for the quantitative study of hypervelocity impact and space debris protection.
1. Introduction
After a hypervelocity impact of a sphere onto a thin plate,shock wave propagates in the sphere and plate materials.As illustrated in Fig.1, the shock wave is quite different with that caused by plate impact obviously,because of the geometry of the sphere.The shock wave should not be described simply with planar wave. Kurosaw et al. [1] depicted the shock front in sphere and plate as semispherical shape. Alme and Rhoades [2] used lens-shape to express the shock front in the materials. Based on the numerical simulation results, Miller et al. [3] treated the shock wave in the sphere as a quasi-planar wave. Ang [4] argued that before the initiation of rarefaction waves from the material surfaces,the shock wave in the sphere could be treated as a quasi-planar wave and jet wouldn’t generate from the junction of the sphere and plate. Piekutowski [5] analyzed the compressed section in the sphere according to Ang’s evaluation. While considering the phase state distribution in the debris cloud following thin plate impact, Piekutowski[6]neglected the curvature of shock front and thought the boundaries of phase states are perpendicular to the impact axis.Although all the above works depicted the wave fronts produced by hypervelocity impact of sphere onto thin plate qualitatively, there are rare theoretical and quantitative descriptions of the shock wave fronts so far.
Plenty of numerical simulations indicate that ellipsoid is more available to describe the shock wave caused by the hypervelocity impact of a sphere. To calculate the shock coupling energy in the impact events, Grady and Kipp [7] raised an ellipse to present the shock wave front in the sphere, where the length of the ellipse short axis is the displacement of the shock wave front in the duration time of shock coupling,and the length of the ellipse long axis is the distance between the initial impact point and the jet initiation points [4]. But this ellipse is only feasible before reverse jets initiates. Wen et al. [8] proposed a geometry propagation model (GPM) to describe the shock front in the sphere, which is suitable for all the first complete propagation of shock wave,based on theoretical analyses and numerical simulations. The relation between the shock wave and the impact velocity has also been extracted with the GPM.
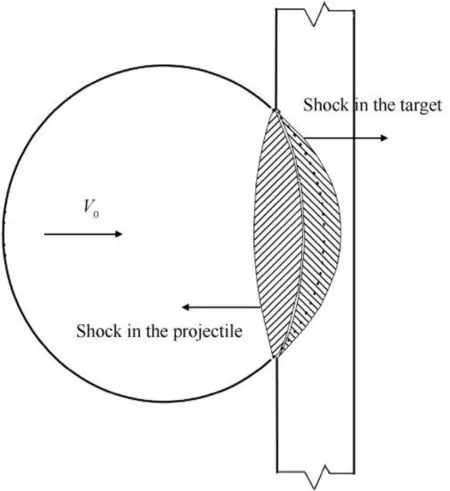
Fig.1. Schematic of the shock wave fronts in the sphere and plate.
After the shock wave arrives at the free surface of the thin plate,the rarefaction wave rebounds from the free surface of the thin plate would pursue and unload the shock wave propagating in the materials. The plate thickness dominates the overtaking of the rarefaction wave to the shock wave directly,and further affects the fragmentation of the sphere and the shape of the debris cloud,eventually influences the potential damage ability of the debris cloud to the subsequent structures. Considering an impact of circular disc onto thin plate, Maiden and McMillan [9] defined the plate“Optimum thickness”at which the shock strength on the disc back just attenuate to the disc melting strength.The calculation of the shock strength attenuation followed Fowles’s work[10].While the relationship of the debris cloud expansion speed and the plate thickness was considered,Piekutowski[11]proposed an apparently similar definition of a critical thickness where the debris cloud achieves the maximum expansion and the projectile has a maximum fragmentation. In fact, the two definitions mentioned above are definitely different,even though Piekutowski[11]did not distinguish them clearly.
The plate “Effective thickness” is defined in this paper, that ensures the rarefaction could overtake the shock wave just at the back of sphere. According to our discussion, the critical thickness observed by Piekutowski [11] should be “Effective thickness”,which is directly related to the shape of the debris cloud,while the“Optimum thickness”proposed by Maiden and McMillan is directly related to the damage ability of the debris cloud [9].
In Sec.2, the shock wave in the plate is described quantificationally and certified with numerical simulations. In Sec.3, the rarefaction wave and the unloading of the shock wave are also analyzed theoretically. In Sec.4, the Similarities and differences between the “Effective thickness” and “Optimum thickness” have been discussed carefully.At last,there is a conclusion of this paper.
2. Shock wave propagation in the sphere and plate
2.1. Geometry propagation model of shock wave (GPM)
The propagation and unloading of the shock wave are of great importance to the formation of debris cloud. Ang [4] argued that the shock wave propagation in the sphere and plate is quasi-one dimensional, along the impact direction in the initial stage. Based on results of numerical simulations, Wen et al. [8] assumed that shock front propagates in the sphere with a stable shape and speed,and eventually built a geometry propagation model to describe the propagation of shock wave in the sphere. The assumption of Wen et al. [8] may be extended to analyze the shock wave in the plate.Then the generation and propagation of the shock waves in the sphere and plate could be depicted as that, once a sphere hypervelocity impacts onto a thin plate, shock wave generates at the contact section AA’ between sphere and plate immediately. The wave fronts initiated from the contact points compose the real shock wave front in the materials,and it propagates axially into the sphere and plate.
To analytically display the above process of wave propagation and build a model,a“reverse-ballistic”event is used where a plate,with a speed of V0, impacts to a stationary sphere. A twodimensional axisymmetric coordinate system is established, and the initial collision point A0set as the origin point.As illustrated in Fig. 2, the solid line circle indicates the sphere with a radius of R(D = 2R), and two vertical dash lines represent the position of the plate at t1and t,respectively.The Lagrangian shock wave speeds in the sphere and plate are expressed as USPand USTrespectively.
At time t1after collision(the initial collision time of sphere-plate is zero), the contact boundary point is A(A′), and shock wave generates from the contact point and propagates along the impact direction.The ordinate of the contact boundary point A(A’)is y(-y),and the moving speed of the contact point along the impact direction is V0, so the time t1could be derived as,

At time t,the propagation time in the sphere of the shock wave generated at point A(A’)is t-t1,and the propagation speed is USP.The propagation distance of the shock wave at y(-y) can be expressed by,

The position (x and y) of the wave front in the sphere at time t could be deduced as following,
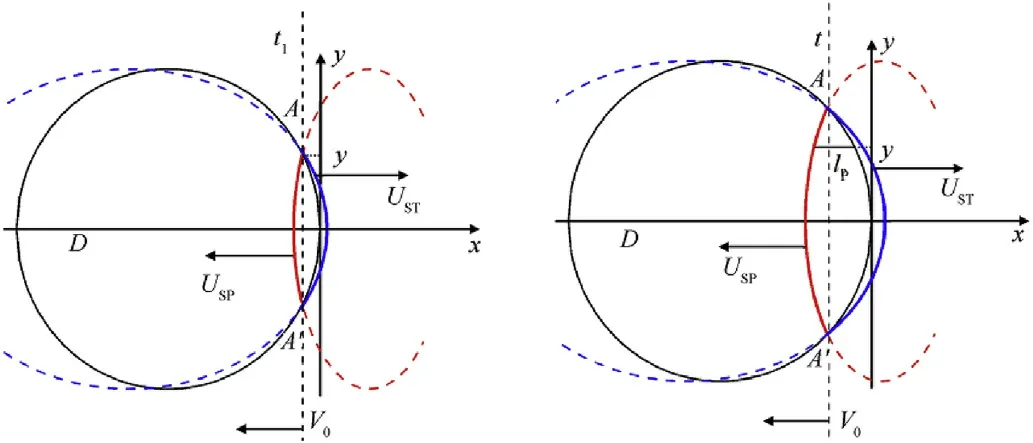
Fig. 2. Schematic of shock wave propagate axially in the hypervelocity impact.

An elliptic equation is obtained by re-arranging Eq. (3),

Obviously, the wave front contour in the sphere based on this assumption is an ellipse,which is presented with red line in Fig.2.Furthermore, the ellipse should be translated to an ellipsoid by revolving around x axis in physical space.With the introduction of ellipse angle variable θ, the shock wave geometric propagation model in the sphere can be expressed as,where c1=-USP∙t,k1=USP/V0-1 are artificial parameters.The SI unit of c1is meter (m), while k1is non-dimensional.

Note that in this coordinate the shock wave displacement in the plate is a sum of the shock wave displacement relative to plate material and the plate material displacement relative to this coordinate. So, in the same way, the position of the wave front in the plate at time t could be deduced as following,

Rearrange Eq.(6),

Obviously, the wave front contour in the plate based on this assumption is also an ellipse, which is presented with blue line in Fig. 2. The ellipse should be translated to an ellipsoid by revolving around x axis in physical space. Similarly, with introducing the angle variable of ellipse θ, the shock wave geometric propagation model for the plate can be expressed as,

where c2= (UST-V0)·t, k2=are artificial parameters. The SI unit of c2is meter (m), while k2is non-dimensional.
It should be noted that only the solid lines between A and (A’)(red arc AA’) represent the shock wave fronts, and the rest of the ellipses have no physical meaning.
In general,for specific hypervelocity impact conditions(velocity,sphere material and plate material), the Lagrangian shock speeds,USTand USP, could be derived with the interface conservation equations (Eq. (9)) and the Hugongiot relations (Eq. (10)) [4],

where sP=s0P+s1Pe-u0PUPPand sT=s0T+s1Te-u0TUPTare nonlinear parameters in the Hugoniot relations,and the subscripts P and T stand for sphere(projectile)and plate(target),respectively[12]. s0P(s0T), s1P(s1T), u0P(u0T), nP(nT) are empirical parameters[13] (in general nP, nT>0). UPPand UPTare the particle velocities due to the shock waves for the sphere and plate,and ρPand ρTare the material densities, respectively. Once the shock wave speeds USPand USTin the sphere and plate are obtained, the shapes and locations of shock wave fronts could be accessed with Eq. (5) and Eq. (8).
The artificial parameters in the models are discussed. The c1in Eq.(5)and the c2in Eq.(8)express the displacement of shock wave fronts, which is the product of propagation time and propagation speed. The k1and k2are related to the shape of the shock wave fronts.The curvatures of the shock wave fronts at x axis are k1/R and k2/R for the sphere and plate, respectively. The values of k1and k2are determined by the ratio of shock wave speed and impact velocity.
In order to simplify the problem,for the events that the sphere and plate are made of the same or similar material, the difference between the sphere material and the plate material is neglected approximately. According to Eq. (9), UPP= UPT= UP= V0/2 and USP=UST=UScould be obtained,where USand UPare shock wave speed and the particle velocity respectively. Also there are s0P= s0T=s0, s1P= s1T=s1, u0P= u0T=u0, and nP= nT= n. Then substituting Eq. (10) into Eq. (5) and Eq. (8), the k1and k2yield,

Eq. (11) shows that the parameters k1and k2are inversely proportional to the impact velocity V0. The k1/R and k2/R are curvatures of the shock wave fronts for the sphere and plate on x axis.Obviously,the larger impact velocity,the much flatter wave fronts.
2.2. Theoretical assessment of the GPM
The derivation of GPM model is based on assumption that “the shock wave generates at the contact section AA’ between sphere and plate immediately, and the wave fronts initiated from the contact points composed the real shock wave front in the materials”.In fact,the shock wave front probably generates in two ways.The first is the quasi one-dimensional wave generated from the contact points as stated by the assumption, and the other is the diffused wave generated from the initial collision point. The real shock wave front should be the one which propagates more distant,and the location relationship between the shock wave fronts generated in above two ways has been considered.Fig.3 illustrates the shock wave fronts composed by the above ways at one moment in the sphere,where the red solid ellipsoid is the shock wave front generated in the first way while the red dash circle is that generated in the second way. It should be noted that the shock wave attenuation and unloading by the rarefaction wave are neglected provisionally.
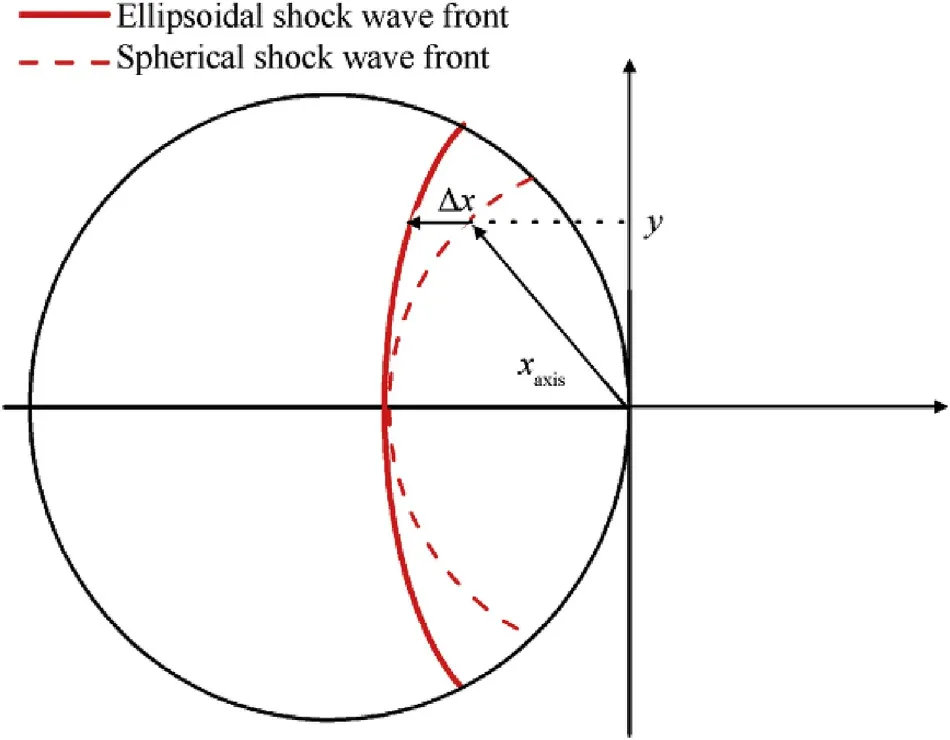
Fig. 3. Schematic of the ellipsoidal and spherical shock wave fronts.
As shown in Fig.3,Δx expresses the displacement difference of the two shock wave fronts composed by the two ways.The sign of Δx reveals the location relationship of the two shock wave fronts:if Δx ≥0,the ellipsoid shock wave front generated in the first way is ahead of the spherical shock wave front composed by the second way, and the assumption of the GPM is feasible; if Δx ≤0, the spherical shock wave front is ahead of the ellipsoid shock wave front and the assumption of the GPM is unreasonable.
When the shock wave arrives at xaxison x axis, the time t =xaxis/USP.Substituting the time to Eq.(3),the ellipsoid shock wave front could be obtained,while the spherical shock wave front at this time is expressed asin the sphere. The difference of their absolute values is,

Similarly, substituting the time, t = xaxis/UST, to Eq. (6), the ellipsoid shock wave front in the plate could be obtained,while the spherical shock wave front at this time is expressed as·t in the plate. The Δx in the plate is,

Eq.(12)and Eq.(13)indicate that Δx is a function of ordinate y,axial displacement of shock wave front xaxis,impact velocity V0,and shock wave speed USP(UST).
To study the influence of impact velocity, Al-Al impacts at 6.7 km/s and 4.0 km/s are considered. The impact velocity of 6.7 km/s is selected because there are numerous experimental results at 6.7 km/s that is convenient for comparison hereinafter.The normalized shock wave fronts displacement differences Δx/D against the axial displacement of shock wave front xaxis/D at different ordinate y/D,for the sphere and plate,have been shown in Fig. 4 and Fig. 5 respectively.
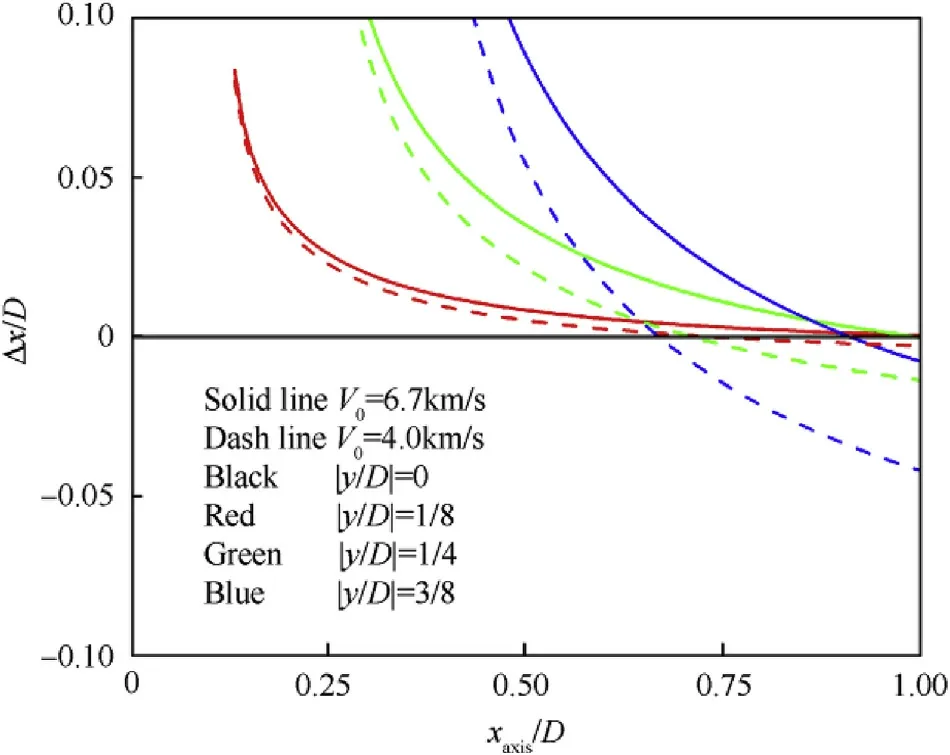
Fig. 4. Difference between the ellipsoidal and spherical shock wave fronts in the sphere.
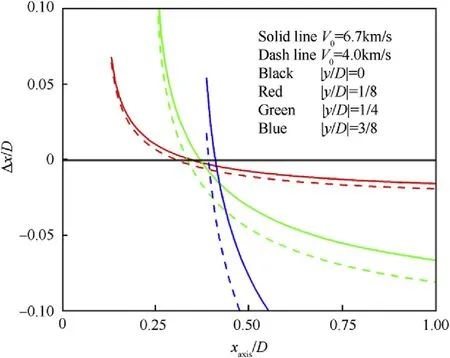
Fig.5. Difference between the ellipsoidal and spherical shock wave fronts in the plate.
As shown in Figs. 4 and 5, on the impact axis, Δx/D ≡0, so the assumption is totally exact. Before the shock wave arrives at the back of sphere, Δx/D ≥ 0 is almost correct near the x axis(normalized ordinate|y/D|<1/8)in the sphere,so the assumption of GPM is also reasonable.With the increase of ordinate y/D,the range of Δx/D ≥0 would decrease.In the plate,the assumption of GPM is reasonable when the shock wave displacement on x axis xaxis/D<3/8. Regarding the sphere hypervelocity impacting onto thin plate,the ratio of plate thickness to sphere diameter H/D is usually less than 1/3, and thus the assumption of GPM still has a fine applicability for the thin plate.
Along the impact axis,the ellipsoid shock wave front is ahead of the spherical shock wave front (Δx/D ≥0) within the initial time when xaxis/D is small.Later,with the increase of xaxis/D,the ellipsoid shock wave front lags to the spherical shock wave front gradually and results in Δx/D<0.This situation is caused by the decreasing of the contact points moving speed,as a result of the sphere geometry characteristic [4,8].
As shown in Figs. 4 and 5, for different impact velocities, the curves of impact velocity 4 km/s are lower than the curves of impact velocity 6.7 km/s,and it reveals that the feasible range of the model at impact velocity 4.0 km/s is smaller than that at impact velocity 6.7 km/s.
In summary, the assumption of the GPM is reasonable and the GPM is applicable in most regions of the sphere and the vicinity of impact spot of the plate, but the accuracy of the model would decrease in the regions away from the impact spot. The impact velocity is higher, the model is more applicable.
2.3. Comparison of the GPM with numerical simulation
For the purpose of verifying the GPM, 2D axisymmetric numerical simulations are also performed with AUTODYN-SPH. Piekutowski’s experiments [11] are simulated where Al spheres impact onto Al plates. In the simulations, the plate thickness is 2.2 mm and its length is 20 mm (40 mm in full scale). Shock state equation,Steinberg-Guinan strength model and Grady spall failure model are employed to describe the plate material,Al 6061-T6.The material parameters are from literature [14]. Correspondingly,Shock state equation, Johnson-Cook strength model and Grady spall failure model are collected to describe the Al 2017-T4 sphere with 4.8 mm radius.The material parameters are adopted from the literature[15]. The artificial viscosity in SPH is selected as 2.5, and SPH particle size is 0.02 mm. The numerical method and parameters above have been validated in literature [16,17].
The simulation results of impact velocity 6.7 km/s at time 0.2 μs and 6.6 μs, as well as the associated experimental shadow-graph[11] are observed in Fig. 6. The dark circle in the experimental shadowgraph presents the projectile before the impact. The simulation results are in accord with the experiments completely.It’s reasonable to verify the GPM with the SPH simulation results.
The Hugoniot relation of aluminum material is [3],

The shock wave speed in the sphere and plate could be calculated easily,

The shock wave propagation predicted by the GPM(Eq.(5)and Eq.(8))are illustrated in Fig.7,where red curves are the shock wave fronts in the sphere, and blue curves are the shock wave fronts in the plate.The theoretical wave fronts compared with the simulated wave fronts are observed in Fig. 8, where the theoretical wave fronts are painted in black.
In the initial 0.3 μs after collision,the suite of ellipsoids presents the shock wave fronts well as observed in Fig. 8. But in the plate,after the reverse jet occurred,the shock waves away from the x axis start to diffuse widely. That means, the shock wave front is not presented perfectly in the areas away from x axis in the plate,(|y/D|>1/2), because the diffusion in the radial direction has not been taken into consideration in the derivation of GPM.The results are in consistent with previous discussion of Figs. 4 and 5.
Substituting the Hugoniot relation of aluminum to Equation(5)and Equation(8),the parameters k1and k2as a function of impact velocity for Al sphere impacting onto Al plate could be obtained,which are also shown in Fig.9.Along the x axis,the curvature radius of the shock wave front in the sphere is R/k1while it is R/k2in the plate. Combining Figs. 8 and 9, the curvature radius of the shock wave front in the sphere would increase with the increase of impact velocity, and the shock wave front becomes much planar. It is identical to the conclusion of Miller et al. [3]. Comparatively, the curvature radius of the shock wave front in the plate may approach to R with the increase of impact velocity,and thus the shock wave front becomes spherical, which is identical to the conclusion of Kurosawa et al. [1].
With the shock waves propagating in the materials,the strength attenuation caused by the geometry dissipation, viscosity and the rarefaction wave unloading becomes prominent gradually. Then,the accompanying speed attenuation of the shock wave have to be accounted. Wen et al. [8] meticulously studied the speed attenuation of the shock wave in the sphere and described the propagation of the attenuating shock wave successfully through introducing an equivalent speed.
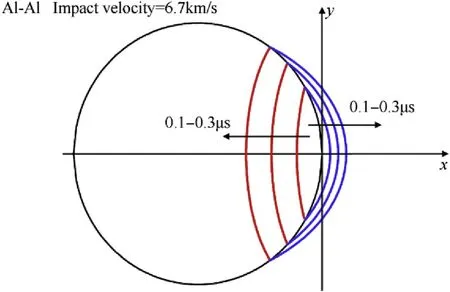
Fig. 7. Theoretical prediction of the shock wave fronts in hypervelocity impact.
The shock wave in the sphere and plate has been described quantitatively and verified theoretically and numerically hereinabove.The shock wave arrives at the plate free surface soon and the reflection occurs.The reflected rarefaction wave would pursue and unload the shock wave in the sphere that is decisive for the formation of the subsequent debris cloud.In the following section,the propagation of the rarefaction wave would be discussed.
3. Rarefaction wave from the plate free surface
3.1. Rarefaction wave speed
A reasonable approximation for the rarefaction wave speed in the material is the adiabatic speed of sound behind a shock compression[9].If the complete equations of state of the materials are known, then the adiabatic speed of sound can be found. However, it is usually hard to get the complete equations of state.Maiden and McMillan[9]gave the approximate adiabatic speed of sound behind a shock as,

Substituting the Hugoniot relation (10) to Eq. (14), it can be obtained that,

Miller et al.[3]proposed that the wave thermal energy could be yield by subtracting the wave kinetic energy from the shock wave energy, and the rarefaction wave speed could be given with an adiabatic coefficient. The rarefaction wave speed yields,

Fig. 6. SPH simulation of Al sphere hypervelocity impacting onto thin Al plate.
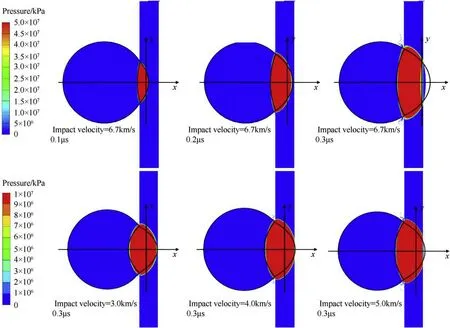
Fig. 8. Verification of the theoretical shock wave fronts at different impact velocities and times.
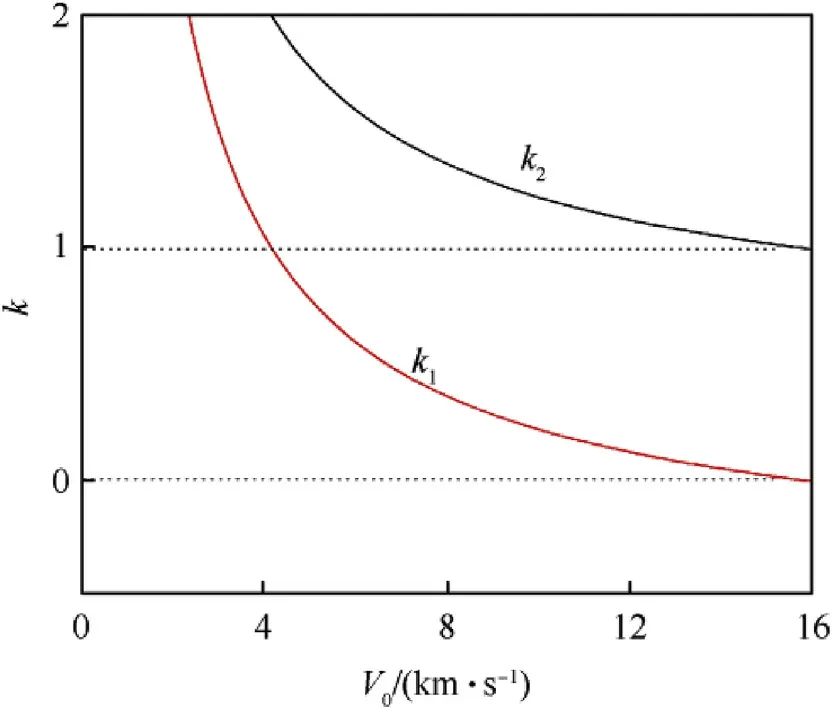
Fig. 9. Values of k1/k2 against impact velocity for Al sphere impacting onto Al plate.
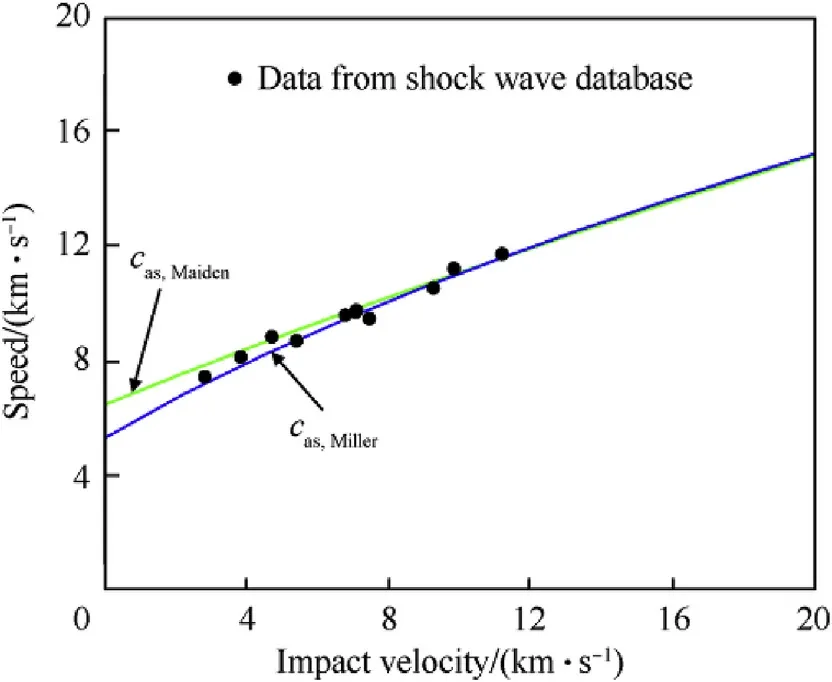
Fig.10. The rarefaction wave speed in shocked material.

For Al material, the reflected rarefaction wave speeds obtained through two ways above are assessed,as plotted in Fig.10.The two speeds have a little disparity in the low-pressure region, whereas they are unified in the high-pressure region. Compared with the experimental data from the international shock wave database[18],the two speeds are both accurate enough.In the following analysis,the rarefaction wave speed is calculated by Eq. (15), and the rarefaction wave speeds in the sphere and the plate are expressed as casPand casT, respectively.
It should be emphasized that the above rarefaction wave speeds are relative to the materials (Lagrangian), and special attention needs to be paid to the coordinate transformation.
3.2. Propagation of the rarefaction wave front
The reflected wave from the plate free surface is center rarefaction wave, and only the leading edge of this rarefaction wave is discussed in this paper.The shock wave propagating in the plate is supposed to reflect from the free surface,and the rarefaction wave reflects in reverse direction to unload the shocked plate material.Again, reflected and transmitted waves are produced when the rarefaction reaches the interface of sphere and plate with different properties, and then the transmitted wave keeps traveling and unloading the shock wave in the sphere.
Based on the assumption that shock wave front transits from the contact points quasi-one dimensionally, the shock wave is supposed to reflect from the plate free surface along the direction vertical to the surface.With the same method of building the GPM,at time t, the rarefaction wave displacement related to the plate material is,

where casTis the rarefaction wave speed in the plate.
In the coordinate with the origin point on the initial collision point, the position of the rarefaction wave could be obtained as,
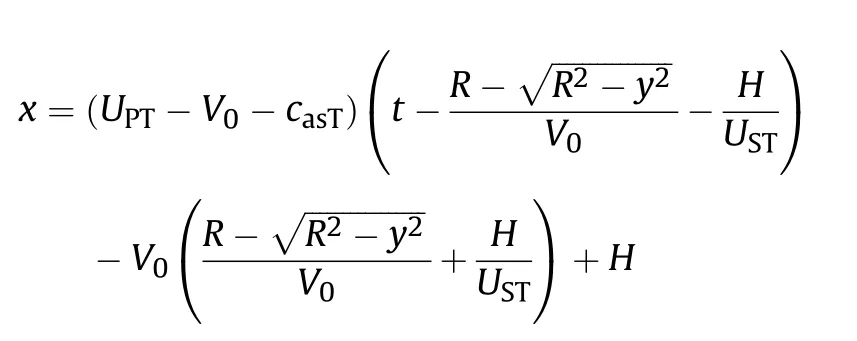
Rearranging the above equation,

Obviously, the rarefaction wave is also an ellipse in the 2D axisymmetric coordinate (ellipsoid in physical space). Introducing the ellipse angle variable θ,the rarefaction wave could be expressed as,

where c3=-(casT+V0-UPT)·t and k3=(casT-UPT)/V0are artificial parameters. The SI unit of c3is meter (m), while k3is nondimensional.
Eq. (18) has a same format with Eq. (5) and Eq. (8), and the rarefaction wave curvature on x axis is k3/R. The parameter c3presents the displacement of the rarefaction wave which is related to time t. Similarly, it should be emphasized that only a partial ellipse represents the rarefaction wave front, and the rest of the ellipse has no physical meaning.
3.3. The rarefaction pursuing on the impact axis
When the rarefaction wave reaches the interface between sphere and plate,reflection and transmission occur according to the shocked material properties.The transmitted wave keeps traveling and unloading the shock wave in the sphere. It is sophisticated to have a perfect theoretical analysis about the reflection and transmission of the rarefaction wave on the interface. For an approximate analysis, if sphere and plate properties are similar, the interaction on the interface could be neglected and the rarefaction wave still travels in the sphere with the speed of casP.
The shock wave and the rarefaction wave are non-planar, that makes the pursuing and weakening of the shock wave very complicated. It is still difficult to analyze the unloading and weakening process on the whole wave front. The wave analysis is conducted only focusing on x axis instead.For hypervelocity impact events of Al sphere onto Al plate, before the rarefaction wave reaches the interface between sphere and plate, the location of the rarefaction wave on x axis could be obtained by valuing cosθ=-1 in Eq. (18),

where c3=-(casT+V0-UPT)·t and k3= (casT-UPT)/V0. Simplifying the above equation,

At time H/USTafter collision, the shock wave reaches the plate free surface on x axis, and the reflected rarefaction wave initiates.The plate is compressed to H(1-UPT/UST)on x axis at this moment.The rarefaction wave travels in the compressed plate with speed casT,and reaches the interface after a time of H(1-UPT/UST)/casT.The coordinate of the interface at this moment could be derived from Eq. (19). After reaching the interface, the rarefaction wave continues to travel in the sphere with the speed, casP, and thus the location of the rarefaction wave on x axis in the sphere could be expressed as,

At the same time,the location of the shock wave in the sphere is,

The front of the rarefaction wave overtakes the shock wave at a point named M. If the plate was too thin, the rarefaction would overtake and weaken the shock wave before the shock wave reaches the back of the sphere, and point M would be close to the initial collision point.With the increase of the plate thickness,point M moves forward to the back of the sphere. Ultimately, the rarefaction wave would not overtake the shock wave in the sphere,which means the damage in the sphere caused by the shock would not be relieved by this rarefaction wave.Combining Eq.(20)and Eq.(21) to eliminate time t, the location xMof point M, where the rarefaction wave overtakes and weakens the shock, could be expressed as,

where casPand casT, USPand UST, UPPand UPT, are rarefaction wave speeds, shock wave speeds, particle speeds caused by shock wave,for sphere and plate respectively. All of the above parameters are functions of impact velocity. Eq. (22) indicates that, once the materials involved in the impact event were specified, the location where the rarefaction wave overtakes the shock depends on the impact velocity (V0) and the ratio of plate thickness to sphere diameter (H/D).
3.4. Comparison with the simulation
2D axisymmetric numerical simulations are performed with AUTODYN-SPH to verify the rarefaction wave propagation model.Piekutowski’s experiments [11] are simulated where Al spheres of 9.6 mm diameter impact onto Al plates of 2.2 mm thickness.Eq.(9)indicates that UPP=UPT=V0/2 and USP=UST. Assuming the rarefaction wave transmits over the interface without reflection for these events, Eq. (18) is still suitable to describe the propagation of leading edge of the rarefaction wave in the sphere.The comparison of the theoretical leading edge of the rarefaction wave depicted by Eq. (18) with the simulation results are displayed in Fig.11.
The process of the rarefaction wave pursuing and weakening the shock wave is sophisticated,involving various nonlinear factors like three-dimensional wave propagation, failure and damage of the materials. But some qualitative results still could be inferred through Fig.11.
1. The ellipse(corresponding ellipsoid in physical space)described with Eq.(18)presents the geometry of the rarefaction wave well in the premier stage.With the traveling of the rarefaction wave,the centered rarefaction wave unloading the shocked materials accompanying with state transition,failure and damage,makes the leading edge of the rarefaction wave hard to observe clearly.While the theoretical ellipse still could sketch the simulation result roughly.
2. The ellipses depicted with Eq. (18) is close to the simulation results in the range of |y/D|<1/2. However there are complex waves beyond this range (i.e., |y/D|>1/2), which are not presented by Eq.(18), and these waves would lead to a hole in the plate which may be larger than the sphere diameter.Discussion on the waves in this range would benefit to the research of the perforation.
3. As shown in Fig.11, the decreasing distance between the theoretical leading edge of the rarefaction wave and the shock wave front display the chasing process of the rarefaction wave to the shock wave.
The chasing process is studied through another way,where the pressure-time of some material particles tracking with gauges in simulation are discussed. The pressure-time of particles on different locations within fixed impact condition have been obtained through SPH numerical simulations, as plotted in Fig. 12.Meanwhile, the pressure-time of particles on fixed location(x = -1.3, y = 0) within different impact conditions have been plotted in Fig.13.
As shown in Fig.12, the shock fronts of the pulses are marked with S.The pulses drop slowly after shock fronts,because of various factors including geometry dissipation. The portions where the pressure returns to zero rapidly are caused by the rarefaction waves,whose leading edges are marked with R.The duration from S to R presents the interval time between shock front and the leading edge of rarefaction wave arrived this particle.
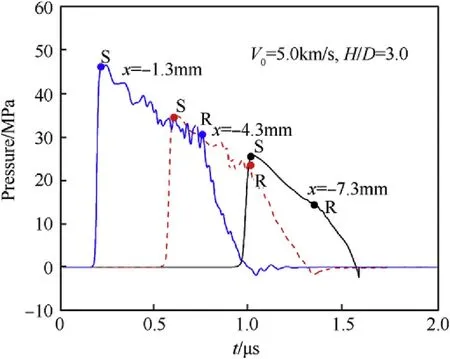
Fig.12. Pressure histories of different locations within fixed impact condition.
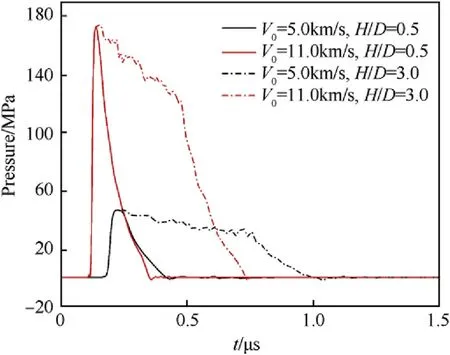
Fig.13. Pressure histories of fixed location within different impact conditions.
As shown in Fig.12, the duration of S-R decreases with the increases of the shock displacement, which is related to the release process of the shock wave by the rarefaction wave.It can be inferred from Fig. 13 that the interval between S-R is longer for a thicker plate when the impact velocities are the same, while the interval between S-R is longer for a lower impact velocity when the plate thicknesses are the same. A longer interval between S-R, corresponding to a greater distance from shock front to the leading edge of rarefaction wave, means that the time for rarefaction wave to pursue the shock wave would be longer.It could be concluded that the overtaking process for the rarefaction wave to the shock wave depends on the impact velocity(V0)and the ratio of plate thickness to sphere diameter (H/D), and it is identical to the conclusion derived from Eq. (22).

Fig.11. Leading edge of the rarefaction wave pursuing the shock.
4. Effective thickness theory
4.1. Effective thickness and optimum thickness
The “Optimum thickness” of plate is defined by Maiden and McMillan[9]as the critical thickness that the shock strength on the sphere back just attenuates to the melting strength of the sphere material. Maiden and McMillan [9] focused on the situation on x axis, similar to the analysis performed in Section 3.3. The attenuation of shock wave is analyzed by one-dimensional theory.Following the hydrodynamic method proposed in Fowles [10],Maiden and McMillan[9]treated the materials as compressible inviscid fluids and calculated the attenuation of the shock wave.The function of“Optimum thickness”on impact velocity is obtained for Al plates impacted by Al spheres.
The “Effective thickness” is defined as the critical thickness of the plate that the rarefaction wave reflected from the free surface of the plate could overtakes the shock wave at the back of sphere on x axis (i.e., M is located at the back of the sphere). By defining -xM/D = 1 in Eq. (22), the “Effective thickness”, Hef, is expressed as the following explicit formula,

For Al-Al impact,the theoretical curves of“Optimum thickness”and “Effective thickness [9]” are shown in Fig. 14. The impact pressure of Al-Al impact could be obtained through Hugoniot relation [6],

The impact pressure for melting of aluminum,PH,is 94 GPa[6],and the corresponding impact velocity is 6.98 km/s calculated with Hugoniot relation.As presented in Fig.14,the“Optimum thickness[9]” curve initiates from point P1(6.8 km/s), only after which the impact pressure could be higher than the melting pressure and the“Optimum thickness [9]” could be meaningful. The theoretical curves of “Effective thickness” and “Optimum thickness [9]” intersect at point P2(7.0 km/s), at which “Effective thickness” and“Optimum thickness” are equal. P2is close to P1, and their associated velocities are both nearby the melting velocity of aluminum.
When the plate thickness equals to the “Optimum thickness”,the pressure on the back of the sphere, which depends on impact Hugoniot pressure and pressure attenuation during propagation,exactly equals to the melting pressure.Obviously,it’s necessary that the impact Hugoniot pressure is higher than melting pressure, to obtain a melting pressure on the back of the sphere. So, the point where the impact Hugoniot pressure equals to melting pressure should be the initial point of “Optimum thickness” curve.
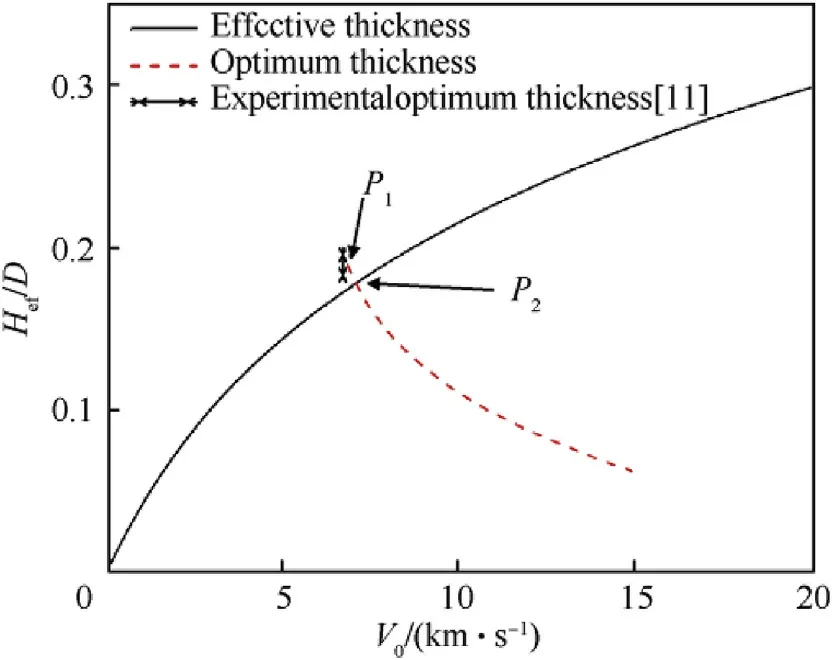
Fig.14. The plate “Effective thickness”/“Optimum thickness” versus impact velocities.
When the plate thickness equals to the“Effective thickness”,the pressure on the back of the sphere equals to impact Hugoniot pressure. If the impact pressure equaled to melting pressure and the plate thickness equaled to the “Effective thickness”, the pressure on the back of the sphere would equal to melting pressure.Meanwhile, the “Effective thickness” would also be the “Optimum thickness” under this condition. So the curves of “Effective thickness” and “Optimum thickness [9]” should intersect at the initial point of“Optimum thickness[9]”curve.Considering the modicum distinction of the equation of state used in these works,the analytic conclusions agree well with Fig.14, for Al-Al impact.
4.2. The relationship between the effective thickness and the shape of debris cloud
Through the experimental research about Al on Al impact, Piekutowski[11]drew a conclusion that,as the impact velocity and/or the plate thickness increase, the breakup of the sphere would aggravate; and there is a minimum plate thickness to get the maximum breakup of the sphere. Piekutowski [11] regarded this minimum plate thickness as the“Optimum thickness”proposed in Maiden and McMillan [9], while this minimum plate thickness actually is “Effective thickness” according to our detailed analyses.
The serious degree of the sphere breakup is represented by the expansion of the debris cloud in Piekutowski [11]. The greater expansion of the debris cloud means the much more severe breakup of the sphere. The expansion velocity of the debris cloud,Ve, is approximated as the difference between the central velocity Vc[19]and the back velocity Vrof the debris cloud.The normalized expansion velocity is expressed as,

where V0is the impact velocity. The expansion velocity Ve, the central velocity Vc,and the back velocity Vr,of the debris cloud are defined as illustrated in Fig.15.

Fig.15. Characteristics of debris cloud produced by hypervelocity impact of Al spheres onto thin Al plates [11].
Theoretically,the central velocity of the debris cloud is decided by the momentum relation between the sphere and the material of the hole in the plate[19],while the back velocity is decided by the reflection of the shock wave on the back of the sphere. With increasing the plate thickness, the central velocity of the debris cloud decreases, but this change is slight because the plate thickness is really thin [11]. The pressure on the back of the sphere increases with the increase of the plate thickness, leading to the decrease of the back velocity of the debris cloud.However,after the plate thickness increases to “Effective thickness”, the rarefaction wave reflected from the free surface of the plate could not overtake the shock wave front and the pressure on the back of the sphere would not increase any longer. Combining with Eq. (24), the function of the expansion velocity on the plate thickness would have an inflection point which is exactly the plate“Effective thickness”.The inflection point is the minimal thickness observed in Piekutowski[11],in fact.The“Effective thickness”is related to the expansion of the debris cloud,which results in maximum breakup of the sphere and maximum expansion of the debris cloud.
Piekutowski [11] got the normalized expansion velocity of the debris cloud as a function of plate thickness for impact of V0=6.7 km/s.The“Effective thickness”ratio Hef/D is between 0.18 and 0.20 for an impact velocity of 6.7 km/s. As shown in Fig. 14,experiments of hypervelocity impact reported by Piekutowski[11]are significant but in a limited amount. To obtain the “Effective thickness” as a function of impact velocity, a suite of experiments for different impact velocities and different plate thicknesses need to be conducted. However, the experiments are too costly. So, the numerical simulations are effective in completing and supporting the results of experiments.
For the purpose to obtain the expansion velocity of debris cloud as a function of impact velocity and plate thickness,15 numerical simulation cases have been performed with Autodyn-SPH for impact velocities V0of 6.7 km/s, 7.0 km/s, 11.0 km/s and for normalized plate thicknesses H/D of 0.05, 0.10, 0.15, 0.20, 0.30,respectively.
With a hypothesis that the leading velocity of debris cloud equals to the impact velocity approximately, the displacement of the leading edge of the debris cloud is approximate to the product of impact velocity and the time after collision.For cases of 6.7 km/s,7.0 km/s and 11.0 km/s,the ratio of the corresponding time should be 1/6.7:1/7.0:1/11.0 to make sure the displacements of the leading edge of the debris clouds are the same.The time of 6.9us,6.6us and 4.2us after collision are selected. The debris cloud images for different impact conditions are shown in Fig.16.
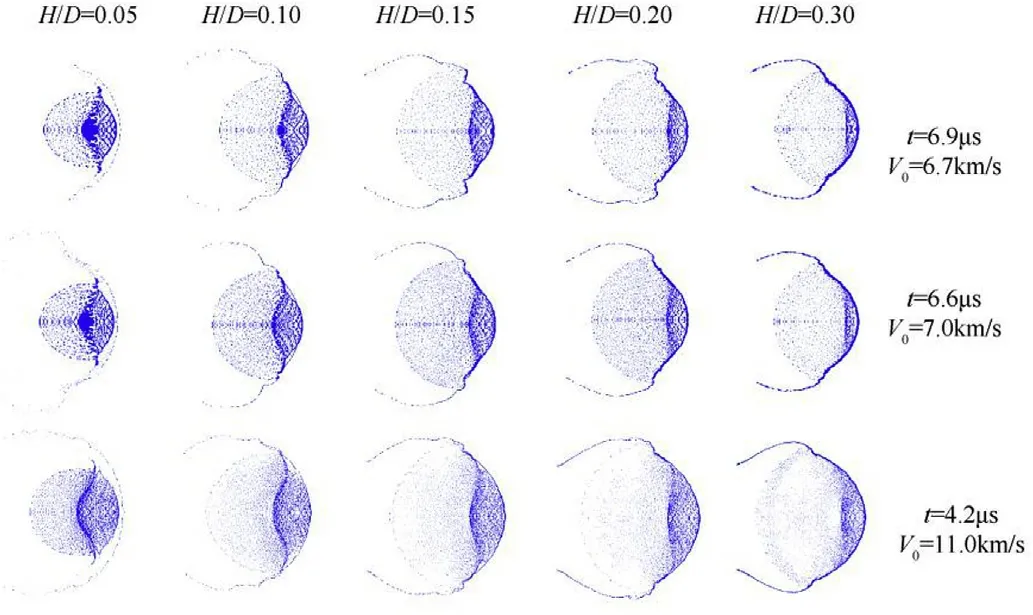
Fig.16. Characteristics of debris clouds produced at different impact conditions.
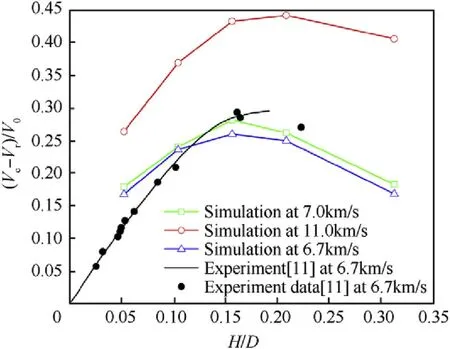
Fig.17. Expansion velocity of debris clouds produced at different impact conditions.
The central velocity Vc[19], and the back velocity Vr, of the debris cloud could be acquired through fragmental recognition included in Autodyn,and then the expansion velocity of the debris cloud Ve,could be derived from Eq.(24).The expansion velocities of the debris cloud as a function of plate thickness have been plotted in Fig. 17 for three impact velocities. The simulation results of impact at velocity 6.7 km/s agree with the experimental data from Piekutowski[11],as shown in Fig.17.Piekutowski[11]analyzed the experimental data, fitted the data into a trend line, and proposed that the maximum expansion velocity of the debris cloud would be achieved with the increases of the plate thickness. But regretfully,in previous reports, because of the amount limitation of the experiments,the drop of the expansion velocity after the maximum is not inferred and the plate thickness of the maximum expansion could not be acquired theoretically.
As shown in Fig.17,with a same impact velocity,the expansion velocity of the debris clouds increases with the increases of the plate thickness until the “Effective thickness”, after which the expansion velocity starts to drop, that agrees with the conclusion about the “Effective thickness”. In Fig.16, it could be inferred that the maximum expansion should locate at a plate thickness between 0.15 and 0.20, for both impacts of 6.7 km/s and 7.0 km/s, and the maximum expansion should locate at a plate thickness between 0.20 and 0.30 for impact of 11.0 km/s. In Fig.17, the dimensionless plate thicknesses are 0.15-0.20, 0.15-0.20 and 0.20-0.30, where the expansion velocity is maximum, for 6.7 km/s, 7.0 km/s and 11.0 km/s impacts, respectively.
It can be summarized that the“Effective thickness”is a function of the impact velocity,and the“Effective thickness”increases as the impact velocity increases. According to the theoretical analyses of the “Effective thickness” shown in Fig.14, the dimensionless plate“Effective thicknesses” are calculated as 0.172, 0.177 and 0.226, for 6.7 km/s, 7.0 km/s and 11.0 km/s Al-Al impacts respectively. The theoretical expressions agree well with the simulation results in Figs.16 and 17.
5. Summary
After a hypervelocity impact between a sphere and a thin plate,shock waves and rarefaction wave propagate through the materials.A theoretical model is proposed based on one-dimensional shock wave theory and the geometry of the sphere. With Hugoniot parameters of homogenous materials, the model could predict the behavior of waves in the sphere and plate involved in hypervelocity impact. The model has been verified with theoretical prediction and SPH numerical simulations for impacts of Al spheres on Al plates. The model agrees well with the simulations, especially under condition of higher impact velocity.The shock wave front in the sphere becomes much flatter as the impact velocity increases. The theoretical expressions differentiate a little with the simulation results in the area away from the impact axis because of the dissipation and unloading of shock waves. The analysis on the rarefaction wave reflected from the free surface of the plate is generally in agreement with the simulation results.
The concepts of “Effective thickness” and “Optimum thickness”of the plate are further discussed carefully.It has been clarified that the minimum thickness resulting in maximum expansion acquired in Piekutowski [11] should be “Effective thickness” rather than“Optimum thickness”.Numerical simulations have been used as the complement of experiments to build the relationship between the expansion of debris cloud and plate thickness. It declares that the function of the expansion velocity on the plate thickness has an inflection point at the plate“Effective thickness”.The analysis of the shock wave propagation and unloading in this paper provide a new sight and inspiration for the quantitative researches of hypervelocity impact phenomenon.
Acknowledgments
This work was supported by the National Natural Science Foundation of China (11627901,11872118).
杂志排行
Defence Technology的其它文章
- Effect of bending temperatures on the microstructure and springback of a TRIP steel sheet
- Dynamic parameters of multi-cabin protective structure subjected to low-impact load - Numerical and experimental investigations
- An eikonal equation based path planning method using polygon decomposition and curve evolution
- Influence of active constrained layer damping on the coupled vibration response of functionally graded magneto-electro-elastic plates with skewed edges
- Consequence of reinforced SiC particles and post process artificial ageing on microstructure and mechanical properties of friction stir processed AA7075
- Crashworthiness performance of hybrid kenaf/glass fiber reinforced epoxy tube on winding orientation effect under quasi-static compression load
