Simulation of spatiotemporal variation of land use in mountainous-urban fringes based on improved CA-Markov model
2020-10-21WangZhaolinYaShengyePuHaixiaMofakkarulIslamOuLing
Wang Zhaolin, Ya Shengye, Pu Haixia※, Mofakkarul Islam, Ou Ling
(1. School of Public Administration, Chongqing Technology and Business University, Chongqing 400067, China; 2. Research Center for Economy of Upper Reaches of Yangtse River, Chongqing Technology and Business University, Chongqing 400067, China; 3. School of Animal, Rural and Environmental Sciences, Nottingham Trend University, Nottingham NG25 0QF, UK)
Abstract: The simulation of land use change in mountainous urban fringes is always a difficult problem. Existing methods, based on the traditional cellular automata (CA)-Markov coupling model, to capture and simulate such changes in this special areas suffer from notable deficiencies. In this paper, we explore, based on a case study of a mountainous urban fringe in Southwestern China, the performance of an improved method that combines the traditional CA-Markov model with multi-criteria evaluation (MCE). We develop an MCE based AHP model fitted by constraining conditions and factors in the study area. The MCE output is then used as the input of the CA-Markov model to simulate land use changes in the study area based on three periods (2006, 2011, and 2016). Meanwhile, the simulated results by the traditional CA-Markov model are also obtained. Both land use simulation results (the simulation images) are then compared against the observed land use in 2016 (the existing image in 2016) to examine the performance of the improved CA-Markov method. The results show that: 1) Establishing the missing link between the MCE process and the conventional CA-Markov model using land use suitability maps can significantly improve the performance of conventional CA-Markov model in mountainous urban fringes. The results from the case study show that the overall 93.15% simulation accuracy is much higher than that of the average 80% accuracy from most traditional CA-Markov models used in other similar areas. 2) The case study further indicates that from 2006 to 2016, the areas of cultivated land, garden, woodland, grassland, water body, and unused land in study area are decreasing annually. By contrast, the areas of urban land and rural settlement are increasing. The types with the most changes are cultivated land and urban land. This situation indicates that the rapid urbanization in mountainous urban fringe is still a mode of denotation expansion, in which a large amount of agricultural land, especially cultivated land, is occupied by urban construction. 3) The simulation shows that if the current rapid urbanization rate is maintained, then by 2030, the areas of cultivated land , garden , woodland , water body , unused land and rural settlement will be decreased by 6442.46, 923.53, 3239.17, 72.55, 41.26, 352.07 hm2, respectively. The increased land types mainly include urban land and grassland. We also argue the implications of the findings and suggest areas of further work.
Keywords: land use; model; improved CA-Markov model; MCE model; mountainous urban fringe
0 Introduction
Urban fringes-called also as rural-urban fringes,peri-urban areas, and rural-urban interfaces-are areas where urban areas meet the countryside[1-2]. These areas often face intense demands for land use, including the development of houses and educational facilities, transport infrastructure,business parks or industrial estates, golf courses and leisure centers, out-of-city shopping centers, recycling facilities,and so on[2-3]. These expansions often encroach into farmlands and ecologically important woodlands, grasslands,rivers, and water bodies; thus, jeopardizing food security and ecological integrity. These challenges are particularly notable in many developing and transition economics-such as China, India, Mexico, Iran, Brazil, and Philippines-that are undergoing rapid urbanization, known as the “urban sprawl”[4-5]. Delineating, predicting, and simulating these land use changes with high accuracy and reliability are crucial for sustainable urban planning and development in countries experiencing rapid urbanization. This, in turn, requires appropriate methods for geospatial analysis. However, existing methods to capture and simulate land use changes suffering from notable deficiencies, such as lower simulated accuracy,especially regarding their suitability for mountainous urban fringes due to the lack of consideration for the land use suitability in the models. In this paper we expect to contribute to this aspect. A focus on mountainous regions is important,since, compared with the urbanization in plain areas that in mountainous areas is characterized by more restrictions from natural factors and stronger disturbances from humans. Thus,mountainous urban fringes are regarded as ‘special areas’ with intense land use and cover change.
Land Use and Cover Change (LUCC) is the main component of global change, which has impacted global climate change, local ecosystem circulation and human survival[6-7].Scenario simulation of land use spatiotemporal pattern has become the main content of LUCC research[8-9].Existing methods to simulate and predict land use spatiotemporal patterns can be divided into two main categories: quantitative and spatial prediction models. The former mainly includes Logistic regression model[10],Markov model[11]and system dynamics model[12]. The latter mainly includes conversion of land use and its effects in small regional context[13]and multi-agent system[14].However, both categories of approaches have some deficiencies. Most quantitative prediction models produce simulation results with only changes in quantities and areas and fail to analyze the changes in spatial patterns. Meanwhile,most spatial prediction models have some difficulties in simulating the changes in spatial patterns due to some issues,such as the restrictions from ground object and terrain and the complexity of decision-making behavior and rules. To solve these issues, methods to simulate land use changes have shifted from single models to coupling or integrated models[15-16].
Some researchers have achieved useful results from the usage of the CA-Markov coupling model to simulate land use cover changes. In order to further improve the performance of CA-Markov model in prediction and simulation, many scholars have continuously improved the models in recent years, such as integrating Analytical Hierarchy Process (AHP) into the CA-Markov model[17-18],and integrating Logistic regression model into the model. In addition, Gong et al[19]has integrated some modules of GIS and RS into CA-Markov model to simulate the urban expansion through the effective data fusion. Ahuras et al combines AHP, Frequency Ratio and CA-Markov model to simulate spatio-temporal urban growth trends in Seremban,Malaysia. Zhao et al[20]has integrated INVEST model into CA-Markov model to assess the effects of ecological engineering on carbon storage. Better validation results have been obtained through the above improvements of CA-Markov model. Nevertheless, these existing improved methods (hereafter called the ‘traditional CA-Markov method’) fail to obtain more than 90% prediction accuracy in mountainous area and the overall simulation accuracy is not ideal[19-22].The main reason is that existing studies seldom consider the constraining conditions (e.g. urban land,water body) and factors (e.g. topography, slope, elevation) in the simulation process. This makes the traditional CA-Markov method potentially less useful for simulating land use changes in mountainous urban fringes, typified by higher level of natural constraints and human disturbances.
In this paper, we test the performance of an improved method to address these deficiencies. In this method we combine Multi-criteria evaluation (MCE) with the traditional CA-Markov model (hereafter called the ‘improved CA-Markov method’) and test its accuracy and usefulness in a mountainous urban fringe in Southwest China. Our primary aim is to explore if this improved method provides more accurate and useful information, compared to the traditional CA-Markov method in mountainous urban fringes. Meanwhile, high-precision simulation results can provide an important reference for the spatial planning and urban planning in rapidly urbanized and mountainous area.
1 Material and methods
1.1 Study area
Despite the typical mountainous features of Southwest China, urbanization in the special areas is progressing as rapidly as in the rest of China[23]. The study area is Beibei District, which is located in the Northwestern fringe of Chongqing City in Southwest China. Beibei District is one of the main urban areas in Chongqing and characterized by more mountains, less plains and rich river systems. It covers an area of approximately 754.21 km2, has 12 towns, and a population of nearly 0.79 million in 2016. Since the 20thcentury, the urbanization of Beibei District has progressed rapidly. The average annual growth rate of urbanization is over 1%, from 56.4% in 2001 to 80.8% in 2016. The rapid expansion of cities and towns has negatively impacted the land use in hilly areas.
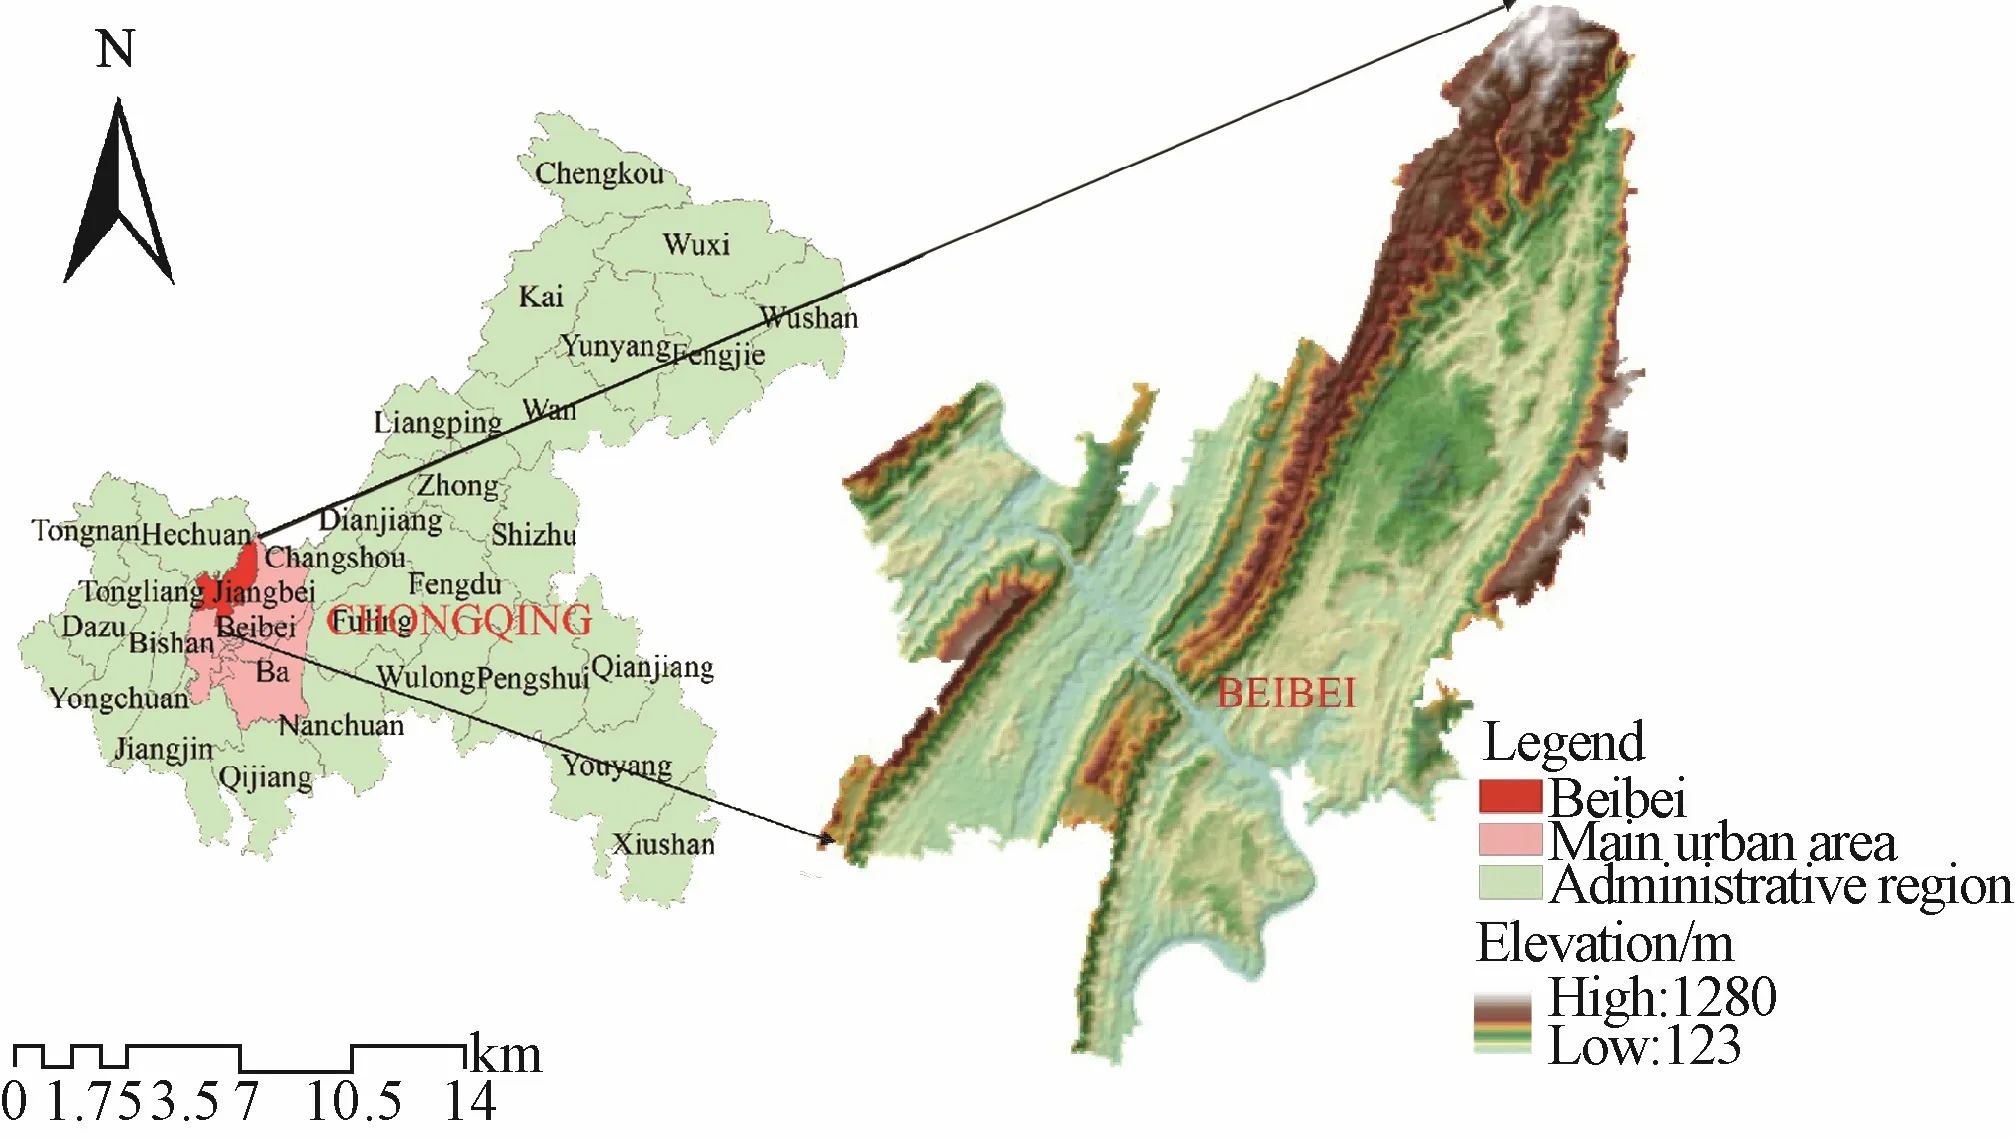
Fig.1 Location of the study area
1.2 Data collection and processing
Most data of the study area are acquired from government or public databases or websites. Land use existing data of the study area in three periods (2006, 2011,and 2016) in vector format (1:10000) are from government public databases established by Chongqing Bureau of Planning and Natural Resources.
Based on the interview with technicians, the land-use existing data were extracted from Landsat7 ETM SLC-off.The pre-processing and processing stages of the satellite imageries were conducted in the Chongqing Bureau of Planning and Natural Resources. The pre-processing and processing stages include spatial, radiometric, and spectral corrections. All satellite imageries were registered and corrected using ground control points from the field and were classified using image-enhancement techniques. In addition, ground control points were collected to evaluate the accuracy of the satellite image classification in this study. These data were compared with high resolution images in order to see the agreement and disagreement between the classified land use maps and ground truth on time. The overall accuracy values of the land-use data were 89%, 93% and 91%, respectively. We believe that the accuracies can meet the simulation requirements.Additionally, DEM data with a cell size of 30 m are available at http://www.gscloud. cn/.
Other detailed processing procedures are discussed as follows: we unify the coordinate system (Xi’an coordinate system in 1980) and the resolution (100 m×100 m) to use the IDRISI Selva software for simulating land use cover change.We extracted slopes from DEM, and extracted water bodies,roads, and urban land from land use existing data of the study area in vector format by using the reclassification tool;and converted the raster data into .RST format by using the conversion tool in Arcgis 10.5, and used the IDRISI Selva software to simulate land use cover change.
Land use types are normally classified into cultivated land, garden, woodland, grassland, water body, rural settlement, urban land, and unused land according to China’s land use classification standards.
1.3 Ideas and Methods
1.3.1 Research framework
First, we utilize the Markov module in IDRISI Selva to compute land use transfer matrix based on data processing,further use the MCE model to generate suitability maps of constraining conditions and factors. Second, we utilize both the improved CA-Markov and traditional CA-Markov to obtain the simulation images of land use change in 2016,respectively. Then, both simulation images are compared with the interpretation image to calculate the simulation accuracy (crosstab test of Kappa). Finally, we utilize the improved CA-Markov with higher simulation accuracy to predict the land use pattern of the study area in 2030 on the basis of the land use existing image in 2016, land use suitability maps, and land use transfer matrix (Fig. 2). The steps of improved CA-Markov are as follows.
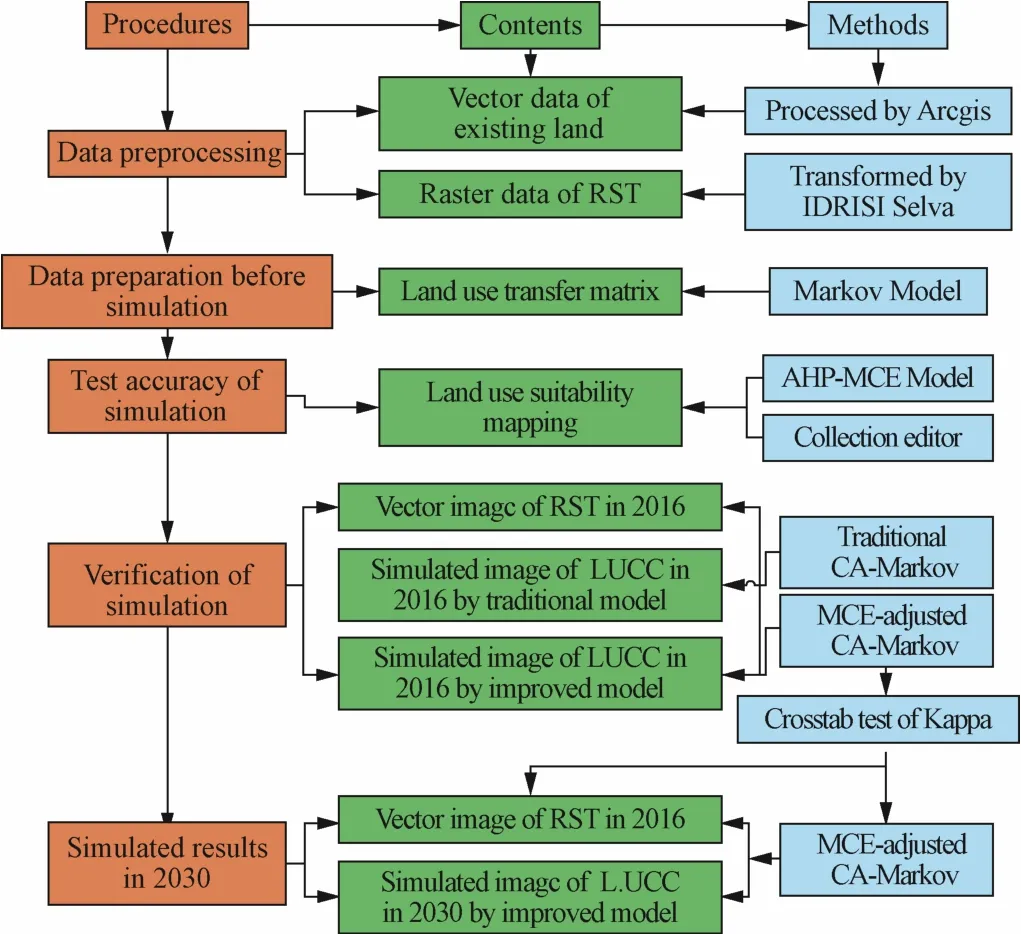
Fig.2 Flowchart of land use change simulation method
1.3.2 Research methods
1) Land use transfer matrix
The land use transfer matrix can be used to explore the conversion relationship between the periodical beginning and ending years of land use types. It is also used to track the quantitative distribution characteristics and the flow directions of the mutual transformation of land use in different regions. The row formula is the land use type at the beginning, and the column formula represents the land use type at the end. The transfer matrix can be written as Eq. (1).

Where,A= the area of land use type.i=the land use type at the beginning of period.j=the land use type at the end of period.n=land use types.
2) MCE based AHP model
Land use suitability refers to the suitability of a cell for a specific land use pattern. In this study, we introduce the MCE based AHP model into the CA-Markov model and generate land use suitability maps to improve the simulation accuracy of traditional CA-Markov, which is quite different from the existing methods. We believe that it is an important improvement for the traditional CA-Markov.
MCE is a judgment method that integrates geographic information and decision[24]. MCE generally involves two types of criteria, the constraining conditions and constraining factors. In this paper, we set urban land and water body as constraining conditions due to the stabilities(i.e. they are not easy to be converted into other types). In addition, due to the distribution of cultivated land affected by natural factors and human factors, we set the slope,elevation, distances to urban land, road, and water body as constraining factors according to Motlagh et al[25]and Aburas et al.[18].
In order to generate land use suitability maps, we first need to compute the weights of constraining factors. AHP is the primary method for MCE to compute the weights. In this paper, AHP is used to pair up the constraint factors of different land use types and determines the weight of each factor. We integrated each standardized factor with its corresponding weight by Weighted Linear Combination(WLC) method and superimposed it with constraint conditions to obtain suitability distribution maps of each land use types as a supplement to the local rules of CA-Markov. In computing the weights, we set the MCE evaluation objective as the goal level, the constraint factor as the criteria level and the restriction condition as the alternative level. By comparing the importance of constraint factors, we build a pairwise judging matrix and use YAAHP software to calculate and finish consistency check.
In addition, each constraining condition and factor must be “binarized” in the Boolean operation. In particular,those land use types that can be transformed should be set as 1, whereas those land use types that can’t be transformed should be set as 0.
3) Cellular automata (CA)
CA is a discrete dynamical system in time and space and is composed of cells (basic units). The transformation rule of cells is the core of CA. The state of a cell at timet+1 depends on its state and the state of its “neighboring” cell at timet. The complex evolution of land use can be simulated by local transformation rules of cells. A CA model can be expressed as Eq. (2).

Wheretandt+1 are the moments before and after the cellular state,Sis the collection of cellular states,fis the transformation rule of cells, andNis the neighborhood of cells.
4) Markov model
Markov model is an approach to predict the probability of event occurrence based on Markov process theory and is used to predict geographical events with no after effect. The dynamic evolution of land use has the nature of Markov process. For instance, land use types are in accordance with“possible states” in Markov process, and the state transition probability is the amount or proportion of land use types that convert to each other. The following Eq. (3) is used to predict the land use change.

Where,n=land use types andP= the probability.
2 Results
2.1 Analyzing land use changes
We have calculated the land use areas of the study area according to the existing land use data in vector in 2006,2011, and 2016 (table1 and fig. 3).

Table1 Changes in land use of the study area in 2006, 2011, and 2016
Table 1 and Fig. 3 show that, from 2006 to 2016, the areas of cultivated land, garden, woodland, grassland, water body, and unused land in the study area are decreasing annually. By contrast, the areas of urban land and rural settlement are increasing. The types with the most changes are cultivated land and urban land. Specifically, the cultivated land has decreased by 1 771.61hm2in 7 years, and the urban land has increased by 1 982.42 hm2in the same period. The second highest changes are observed for woodland and garden land, which decreased by 116.13 and 88.88 hm2, respectively. This situation indicates that the rapid urbanization in mountainous urban fringe is still a mode of denotation expansion, in which a large amount of agricultural land, especially cultivated land, is occupied by urban construction.
2.2 Analyzing land use transfers
Land use transfer matrix is employed to analyze the land use change and to determine the process of land use transfer. The results are shown in table 2 and table 3.

Fig.3 Existing land use of the study area in 2006, 2011, and 2016

Table 2 Transfer matrix of land use in the study area from 2006 to 2011 hm2
Table 2 indicates that the total area of land transfer in the research area from 2006 to 2011 is 1006.89 hm2(see the grey area in table2). Except urban land, the area of seven other land use types that transferred to the urban land reaches 1002.86 hm2, which accounts for 99.60% of the total transferred area. First, among the seven land use types,cultivated land is the largest one that transferred to urban land with an area of 893.97 hm2, which accounts for 89.14% of the total area transferred to urban land. Second,the area that transferred from woodland to urban land is 58.78 hm2, which accounts for 5.86% of the total area transferred to urban land. Third, the area that transferred from grassland to urban land is 40.52 hm2, which accounts for 4.04%. The remaining area of the land use types that transferred to urban land area is very small. The rapid urbanization of the study area with a traditional extension mode results in the occupation of a large area of cultivated and ecological lands.

Table 3 Transfer matrix of land use in the study area from 2011 to 2016 hm2
A comparison between table 2 and table 3 shows that the trend of land use types transfer in the study area from 2011 to 2016 is very similar to that from 2006 to 2011, but the transfer rate is slower in the latter period. Except urban land, the transfer area of other land use types to urban land from 2006 to 2011 reaches 979.74 hm2, which accounts for 89.12% of the total transferred area. The rate is considerably slower than the rate of 99.60% from 2006 to 2011.Surprisingly, rural settlements in the two periods do not decrease but increase.
2.3 Generating land use suitability maps
MCE module is used to generate land use suitability maps of the study area on the basis of the land use transfer matrix (table 2). Two kinds of standards can be found in the MCE module: one is constraining conditions, the other is constraining factors. The constraining conditions are the special areas where the Boolean standards are used for constraint analysis[26]. The Boolean operations are based on the binarization of constraining conditions. Therefore,constraining conditions are always the binarized images.Constraining factors are influential factors that can be carried on in the multi-standard evaluation by Weight Linear Combination (WLC) method, and they are standardized to obtain the standardized images of each factor[27]. For the selection of constraining factors in this study, we fully considered the characteristics of natural conditions in the study area, such as low mountains and hills, low risk of land disasters, subtropical monsoon humid climate and abundant rainfall. Specifically, urban land and water body usually can’t be converted to cultivated land (i.e. stabilities), we set urban land and water body as constraining conditions. In addition, due to the distribution of cultivated land affected by natural factors and human factors, we set the slope, elevation, distances to urban land, road, and water body as constraining factors referring to Aburas et al[18].
Here take cultivated land as an example. We utilize fuzzy model to generate the binarized images of the constraining conditions (urban land=0, other types=1; water body=0, other types=1 Fig. 4) and create standardized images of the constraining factors (Fig. 5a and Fig. 5b). The land with higher elevation and higher slope is more unsuitable for cultivation than its lower counterpart, whereas the land closer to roads, water body, and urban areas is more suitable for cultivation than its distant counterpart.Consequently, we take the MCE evaluation objective as the goal level, the constraint factor as the criteria level and the restriction condition as the alternative level and use YAAHP software to compute the weights of constraining factors, furtherly, use the Boolean operation to create the suitability maps of cultivated land on the basis of the binarization and standardized images.Similarly, the suitability maps of other land use types can be achieved (Fig. 6). The constraining conditions and factors of other land use types are as follow:
Garden is generally influenced by water body, urban land, slope, elevation and the distance to urban land (the distribution of garden is generally not impacted by the distances to road and water body).
Woodland is generally influenced by woodland, water body and urban land (the distribution of woodland is generally not impacted by slope, elevation and the distance to road).
Grassland is generally impacted by grassland, woodland,water body, urban land and elevation (the distribution of grassland is generally not impacted by slope and distances).
Rural settlements and urban land are generally influenced by water body, urban land, elevation, slope, the distances to water, urban and road.
As seen from the suitability images of cultivated land, we find that the areas with higher suitability of cultivated land are generally located in the southern part of the study area with lower elevation, more gentle slope, and more abundant water,while, the areas with lower suitability are mainly distributed in the northern part of the study area with higher elevation, higher slope. Concerning garden, there are so many overlapping areas between higher suitability area of garden and cultivated land.Obviously, higher suitability area of garden is larger than that of cultivated land. Concerning woodland and grassland, there are also many overlapping areas of suitability between them. The areas with higher suitability are generally distributed in the northern part of the study area and on both sides of central mountains with higher elevation and steeper slope. Concerning rural settlement, the suitability areas of rural settlement are more consistent with those of cultivated land and garden, which is mainly distributed in the areas with lower elevation, lower slope,and more abundant water. Concerning urban land, we find that urban lands are mainly distributed in the areas with lower elevation, lower slope and more abundant water. But urban lands are less suitable in the hilly areas with higher elevations.

Fig.4 Binarized images of constraining conditions of cultivated lands
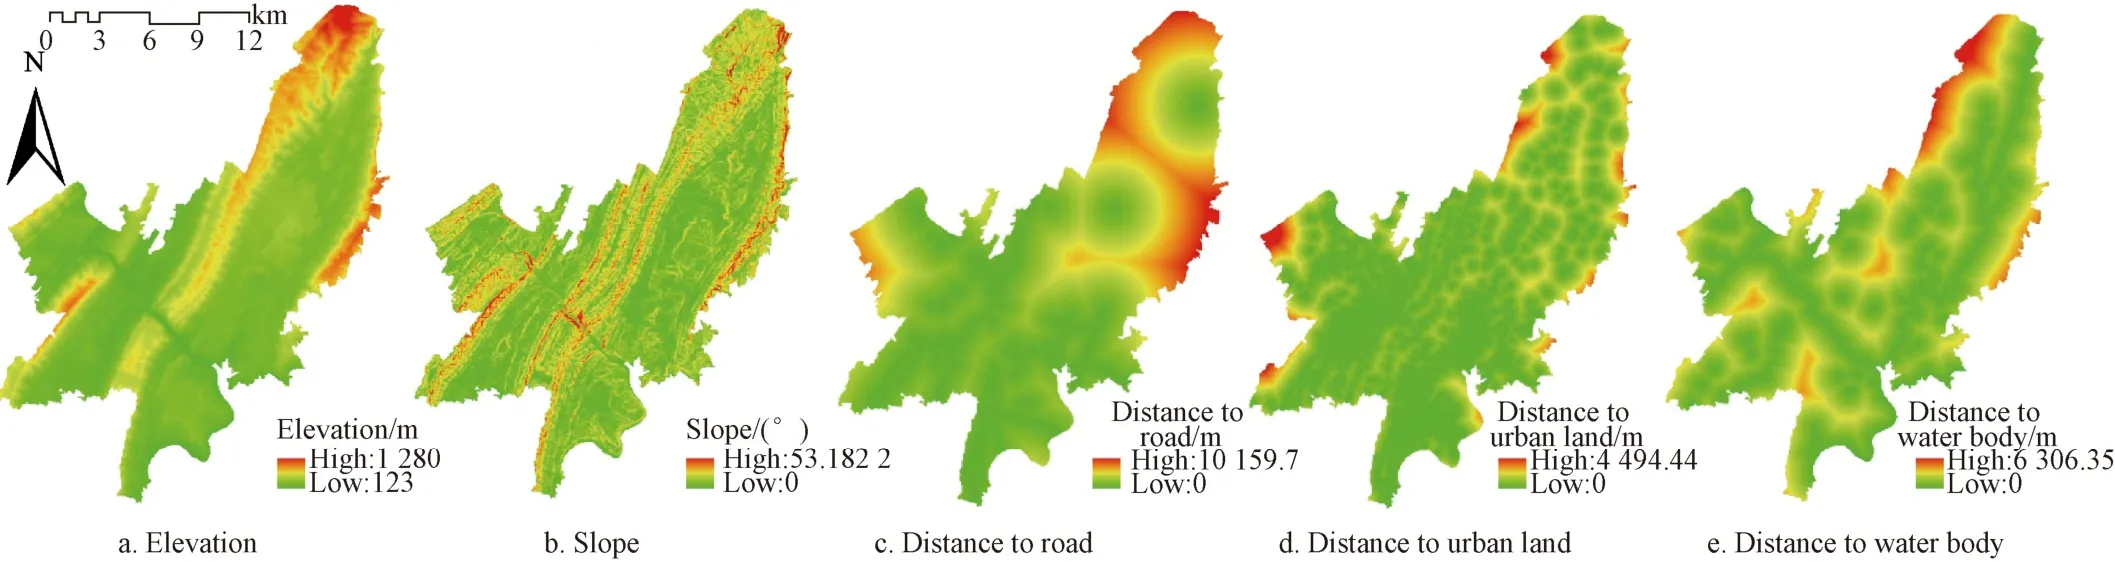
Fig.5 Standardized images of constraining factors of cultivated lands

Fig.6 Suitability of cultivated land, garden, woodland, grassland,rural settlement, and urban land
2.4 Testing simulation accuracy
On the basis of suitability maps and Fig.7a, we set CA-Markov model to a 5×5 filter and set the number of CA cycles to 5 to simulate the land use pattern of the study area in 2016, then, test the simulation accuracy (Fig. 7c). In addition, we use existing image in 2011 only, but without suitability maps and the same methods to simulate the land use pattern of the study area in 2016 and estimate the simulation accuracy (Fig. 7b).

Fig.7 Existing and simulation images of land use in the study area in 2016
Fig.7, table 4 indicate that, in the land use structure of two simulation images, the proportion of cultivated land is the highest, woodland is the second, and grassland is the lowest.The simulated images by the traditional and the improved CA-Markov methods are generally in line with that of the existing image in 2016. In addition, we also find that the area difference between the simulated images by improved method and existing image of most land use types is less than that between the simulated images by traditional method and existing images, that is, the simulated areas of each land use type by improved method are closer to the existing area.
We continue to use Crosstab procedure to examine simulation accuracies between the two simulation images and existing images, respectively. The overall accuracy of the improved CA-Markov method was 0.9315 and that of the traditional CA-Markov method was 0.8703, indicating that the simulation accuracy of the former is better. Table 4 indicates that the accuracies of water body, cultivated land, woodland and rural settlement are relatively higher with the values of 95.72%, 93.24%, 92.71% and 92.61%, respectively. However,the accuracy of unused land is lower with the values of 85.33%. That is because the patch boundary of unused land is not clear enough compared with other land types.

Table 4 Land use simulation accuracy of study area using the traditional and improved CA-Markov method in 2016
2.5 Simulating and predicting land use patterns
Given the high simulation accuracy of land use types in 2016, we set the number of CA cycles to 14 to simulate and predict the land use pattern of the study area in 2030 by the improved CA-Markov model based on the existing image in 2016 (Fig. 8a). The forecast year of 2030 is based on the“Outline of National Land Planning (2016-2030)”.

Fig.8 Existing image in 2016 and simulation image in 2030 of the study area
Table5 and Fig.8b show that, if the current rapid urbanization rate is maintained, then by 2030, the areas of cultivated land , garden, woodland, water body, unused land,and rural settlement will decreased by 6 442.46, 923.53,3 239.17, 72.55, 41.26, 352.07hm2, respectively. The increased land types mainly include urban land and grassland, which will increase by 10 860.09 and 210.95 hm2,respectively. The reason for the growth of grassland may be the extension of urban green space. The result provides evidence that the main reason for the reduction in cultivated land is the occupation of land for urban construction.
Specifically, the areas of urban land, cultivated land,woodland and garden have changed greatly. Urban land expansion is mainly distributed around the areas with low elevation and gentle slope on both sides of main mountains in the central part of the study area. In the same area, a large amount of cultivated lands are occupied because of rapid urbanization, so the decrease of cultivated land is also mainly distributed in these areas. The decrease of woodland and garden is mainly concentrated in two regions, one is located in the central mountains of the study area, and the other is in the northern forest area of the study area. The main reason for the decrease of woodland and garden in these regions is the expansion of construction land due to the rapid urbanization.

Table 5 Simulated results of land use in 2030
3 Discussion
3.1 Improved CA-Markov and its performance
In this study, we explore to simulate the spatiotemporal pattern of land use in mountainous urban fringes characterized by high level of natural and human constraints using MCE-adjusted CA-Markov method. Traditional CA-Markov models to delineate and simulate such land use changes suffer from considerable shortcomings, such as low simulation accuracy and non-consideration of constraining factors and conditions in the simulation process. To address these deficiencies, we combined MCE with a CA-Markov model and examined the performance of this improved method based on a case study in Southwest China.
Our findings further suggest that an improved CA-Markov model, which combines MCE, can simulate and predict land use cover changes in mountainous urban fringes of macro and micro scales more accurately, compared to a traditional CA-Markov model. Mountainous urban fringe,the special geomorphic unit is strongly disturbed by natural factors and human activities. We fully consider the possible effects from elevation, slope, and the distances to towns,roads, water bodies on the results of simulation, and take these factors as evaluation indexes, then generate the suitability maps of each land use types by MCE method. We introduce suitability maps into the traditional CA-Markov model to improve the CA-Markov model and use the improved method to simulate the land use changes in this special geomorphic unit, which is quite different from using traditional CA-Markov model such as Zhao et al[12], Fu et al[16],Azizi et al[21], Karimi et al[22], Nouri et al[28],and Firozjaei et al[29]. We obtain higher simulation accuracy through the improved research method than the traditional method.
In general, the improved method can establish the missing link between the MCE process and the conventional CA-Markov model using land use suitability maps. Thus, it can achieve higher simulation accuracy than the traditional methods.The results from the Chinese case study show that the overall 93.15% prediction accuracy is much higher than that of the average 80% accuracy from most traditional CA-Markov models used in the same area and other mountainous study areas, such as Karimi et al[22], Nouri et al[28]and Jafari et al[30].
3.2 Problems and rules of land use in mountainous urban fringe areas
The validation results of the land use transfer matrix of the case study area in Southwest China indicate that agricultural and ecological lands are transformed into urban lands.Moreover, the validation results of improved CA-Markov show that many sustainability-oriented land use types in the study area will decline greatly by 2030 because of rapid urbanization.This finding confirms the general trend across China and other developing countries undergoing rapid urbanization.
If unchecked, such ‘conventional’ mode of urbanization can be very detrimental to the food security and ecological protection in fast-growing developing countries[31-32]. For instance, the simulation result shows that if the current rapid urbanization rate is maintained in the case study area, an estimated 6 442.46 hm2of cultivated land and 3 239.17 hm2of woodland will be lost by 2030, which is likely to reduce grain production by 33385 tons according to the National Bureau of Statistics, grain yield per hm2in Chongqing in 2016(5182.1 kg). Such consequences could undermine the ability of fast-growing developing countries to meet their commitments to the UN’s Sustainable Development Goals.
Our case study further indicates that the mode of urbanization expansion in mountainous cities is mainly clustered, which is quite different from the “central radiation pattern” in plain areas. Due to the impacts of natural slope,elevation, distances to urban construction land, road, water body and other constraining factors, the “clustered” mode has led to more fragmented landscape pattern in mountainous urban fringe areas, as shown in fig.8 (the simulation image in 2030). Numerous studies have shown that landscape fragmentation has a negative impact on regional biodiversity[33].
We also find some distribution rules of land use types from the land use suitability maps. Under the mountain condition, different land use types have different suitability in different areas, and some land use types have some overlapping areas with others. For example, the suitability distribution of cultivated land has a large overlap with garden, and both are suitable for the areas with lower elevation, lower slope and more sufficient water. Meanwhile,the site selections of rural settlements and urban lands have some overlapping regions with the suitability distribution of cultivated land and garden due to their construction costs. In addition, there are also some overlaps between the suitability of woodland and grassland. In general, they are more suitable for the hilly land with higher elevation and steeper slope.
Here we innovatively introduce land suitability maps into the model. We directly used the suitability evaluation score of patches to estimate the land use suitability. This is quite different traditional evaluation method. Previous traditional methods involve two steps to evaluate land use suitability, namely first, judging whether the land use is suitable, then, grading the suitability of land use. Compared to the traditional methods, we believe that evaluation score method is more suitable for simulating the spatiotemporal pattern of land use in mountainous urban fringes based on MCE-adjusted CA-Markov model. The reasons are as follows:
First, despite the layout of land type is affected by natural factors, such as elevation, slope and so on, it does not mean that this land type cannot be distributed in this special area, but only the reduction of suitability. For example, the land with a slope of more than 25 degrees are generally not suitable for cultivate land due to soil erosion and other reasons,however, this does not mean that the land cannot be use as cultivate land completely, but lower suitability. In other words,the land can still be used as farmland. Second, traditional method of distinguishing suitability from non-suitability is one-vote veto, namely binary choice, which easily results in some blank areas in the images of suitability. However, these blank areas could block the running of MCE.
3.3 Policy implications of this study
These findings have several implications for the sustainable planning and management of land use in urban fringes in China and further afield. First, local governments should use spatial planning to delineate red lines-such as“permanent basic farmland,” “ecological red lines,” “urban growth boundaries,” “nature reserves”-for regional food security and ecological protection. Some examples of such practices are already found in many western countries, such as USA, Germany, and Netherlands[34-35]. Developing countries could learn from such experiences. Second, local governments should adjust the speed and mode of urban development and replace land-based urbanizations with new-style urbanizations,such as reforming the Hukou registration system in China,promoting the urbanization of floating population, integrating urban and rural infrastructure, and equaling access to public services. Third, local governments should adjust the intensive use of rural lands by adopting such measures as making efforts to renovate unused and abandoned rural settlements. In many parts of China, for example, migrant farmers from scattered natural villages in mountainous areas are accommodated within concentrated residential administrative villages in plain areas. This is driven by a Chinese government policy named “Linking the increase and decrease of urban and rural construction land” in China. Such concentrated settlements help free-up lands for urban construction in mountainous areas.
3.4 Research prospects and future work
In this study, we have utilized MCE based AHP model to improve the performance of traditional CA-Markov model in mountainous urban fringes, and the validation results are satisfying. However, further tests are needed by considering additional socioeconomic constraints to establish meaningful and operational connections between suitability factors and land use decision-making processes.
The special location of the study area determines that the simulation results might be influenced by natural, economic and social factors. In this paper, we select urban land and water body as constraining conditions. We also select natural factors such as elevation, slope and socio-economic factors such as the distances to road, water body and urban land as constraining factors referring to Motlagh et al[25]and Aburas et al[18]. Actually, other natural factors such as soil quality,groundwater and other socio-economic factors such as population density, industry, infrastructure, and even the willingness of individual residents may also impact land use style. Unfortunately, due to the availability of these data on patches scale, we have not examined it for the time being.This will be the direction of our future work.
Additionally, planning factors such as ecological red line, urban growth boundary should be considered in the concrete simulation, which is not a technical difficulty. The reality is that we can’t obtain these data because the local government has not yet prepared the spatial planning including these red lines. On the other hand, one of our purposes of improving the CA-Markov model is to provide the basis for regional spatial planning and delineation of these red lines through accurate simulation. Nevertheless,we believe that the improved method is satisfying and that the overall validation results are encouraging.
4 Conclusion
In this study, we aimed to examine the performance of improved CA-Markov method in mountainous urban fringes,some conclusions have been drawn.
1) Establishing the missing link between the MCE process and the conventional CA-Markov model using land use suitability maps can significantly improve the performance of conventional CA-Markov model in mountainous urban fringes. The results from the case study show that the overall 93.15% simulation accuracy is much higher than that of the average 80% accuracy from most traditional CA-Markov models used in other similar areas.
2) The case study further indicates that from 2006 to 2016, the areas of cultivated land, garden, woodland,grassland, water body, and unused land in study area are decreasing annually. By contrast, the areas of urban land and rural settlement are increasing. The types with the most changes are cultivated land and urban land. This situation indicates that the rapid urbanization in mountainous urban fringe is still a mode of denotation expansion, in which a large amount of agricultural land, especially cultivated land,is occupied by urban construction.
3) The simulation shows that if the current rapid urbanization rate is maintained, then by 2030, the areas of cultivated land , garden , woodland , water body , unused land and rural settlement will be decreased by 6442.46,923.53, 3239.17, 72.55, 41.26, 352.07 hm2, respectively.The increased land types mainly include urban land and grassland, which will increase by 10860.09 and 210.95 hm2,respectively.
4) These findings also have several implications for sustainable land use and spatial planning in mountainous urban fringes such as delineating the red lines of spatial planning, transforming the traditional model of urbanization,strengthening the intensive rural land use and reclaiming unused and abandoned rural settlements.
