An ammonia emissions inventory for agricultural sources in Hefei,China
2020-10-09HOUXinhongandYUXingna
HOU Xinhong and YU Xingna
Key Laboratory for Aerosol-Cloud-Precipitation of China Meteorological Administration,Collaborative Innovation Center on Forecast and Evaluation of Meteorological Disasters,Nanjing University of Information Science and Technology,Nanjing,China
ABSTRACT A comprehensive agricultural inventory of ammonia emissions for 2017 in Hefei was established on the basis of the specific emission factors and county-level activity data.The emissions over a 1 km×1 km grid and the associated monthly variations were distributed on the basis of land-use type and meteorological conditions, respectively. The total ammonia emissions were 27,242.7 t in 2017 in Hefei,to which livestock was the top contributor,accounting for 54.5%.Two major contributors to livestock waste were broilers and laying hens, which contributed 34.5% and 22.2% of the total emissions,respectively.Changfeng,Feixi,and Feidong counties,with more developed agriculture than other counties,accounted for a large proportion of the total ammonia emissions—as much as 28.5%, 24.5%, and 21.0%, respectively. The average emissions density of the whole region was 2.4 t km−2,and the higher values were mostly in areas with denser populations.Seasonally,peak ammonia emissions occurred in summer.
KEYWORDS Ammonia emissions;emissions factor;agricultural sources;spatiotemporal distribution
1. Introduction
Ammonia (NH3) is a significant reactive nitrogen (N)compound in the atmosphere and has significant impacts on both atmospheric chemistry and ecosystems(Battye,Aneja,and Roelle 2003).As an alkaline gas,it can neutralize the acid gases (such as sulfur and nitrogen oxides) to form secondary aerosols that very effectively penetrate lung tissues and reduce visibility (Goebes,Strader, and Davidson 2003). N deposition may lead to a series of serious ecological issues,such as eutrophication of water bodies (Hamaoui-Laguel et al. 2014) and decreasing biodiversity(Galloway et al.1996).When N is deposited in soils, NH3compounds can be converted into nitrate by nitrification,simultaneously releasing protons and leading to soil acidification(Lin et al.2007).
Many NH3emission inventories have been established at various levels in China, including the national level(Huang et al.2012)and regional level(Yin et al.2010),as well as the provincial(Shen,Yu,and Xiang 2018;Hou et al.2019) and city (Li et al. 2019; Su et al. 2016; Zhou et al.2016)levels.Previous studies have shown that agricultural sources are major contributors to NH3emissions and account for more than 80% of the total emissions in China(Dong et al.2009).Because NH3plays a key role in the formation of fnie particle and N deposition,an accurate NH3emissions inventory of agricultural sources is essential for knowing the current environmental problems and developing reasonable control strategies.
Hefei city is in the eastern part of China and is the political, economic and cultural center of Anhui Province.With the acceleration of urbanization,complex air pollution has become a very serious problem(Wang et al.2018a).There are some NH3inventories related to pollutant emissions from vehicle exhaust (Wang,Wang,and Hu 2018c) and waste treatment (Zhang 2012)sources in Hefei, but the emission characteristics of NH3from agricultural sources have not been studied.Therefore, it is essential to establish an updated and accurate inventory of agricultural NH3emissions in Hefei. In this study, our aim was to (1) compile NH3emissions from agricultural sources for Hefei city in 2017; (2) carry out a 1 km × 1 km gridded emissions allocation;(3)analyze the NH3emission magnitudes,the contribution of each source, and the spatiotemporal distribution characteristics; and (4) evaluate the emissions inventory according to comparisons with previous studies.
2. Methods and data
2.1. Research areas and objects
Hefei is located in the eastern part of China between 30°57′N and 32°32′N, and between 116°41′E and 117°58′E(Figure 1). It comprises four counties (Changfeng,Feidong, Feixi, and Lujiang), one city (Chaohu), and Hefei Municipal District.The agricultural sources include three categories: (1) livestock waste management; (2)a farmland ecosystem (N fertilizer, crop residues,N-fixing crops and cropland soil);and(3)biomass burning. The specific emissions source classification and activity data are listed in Table S1.
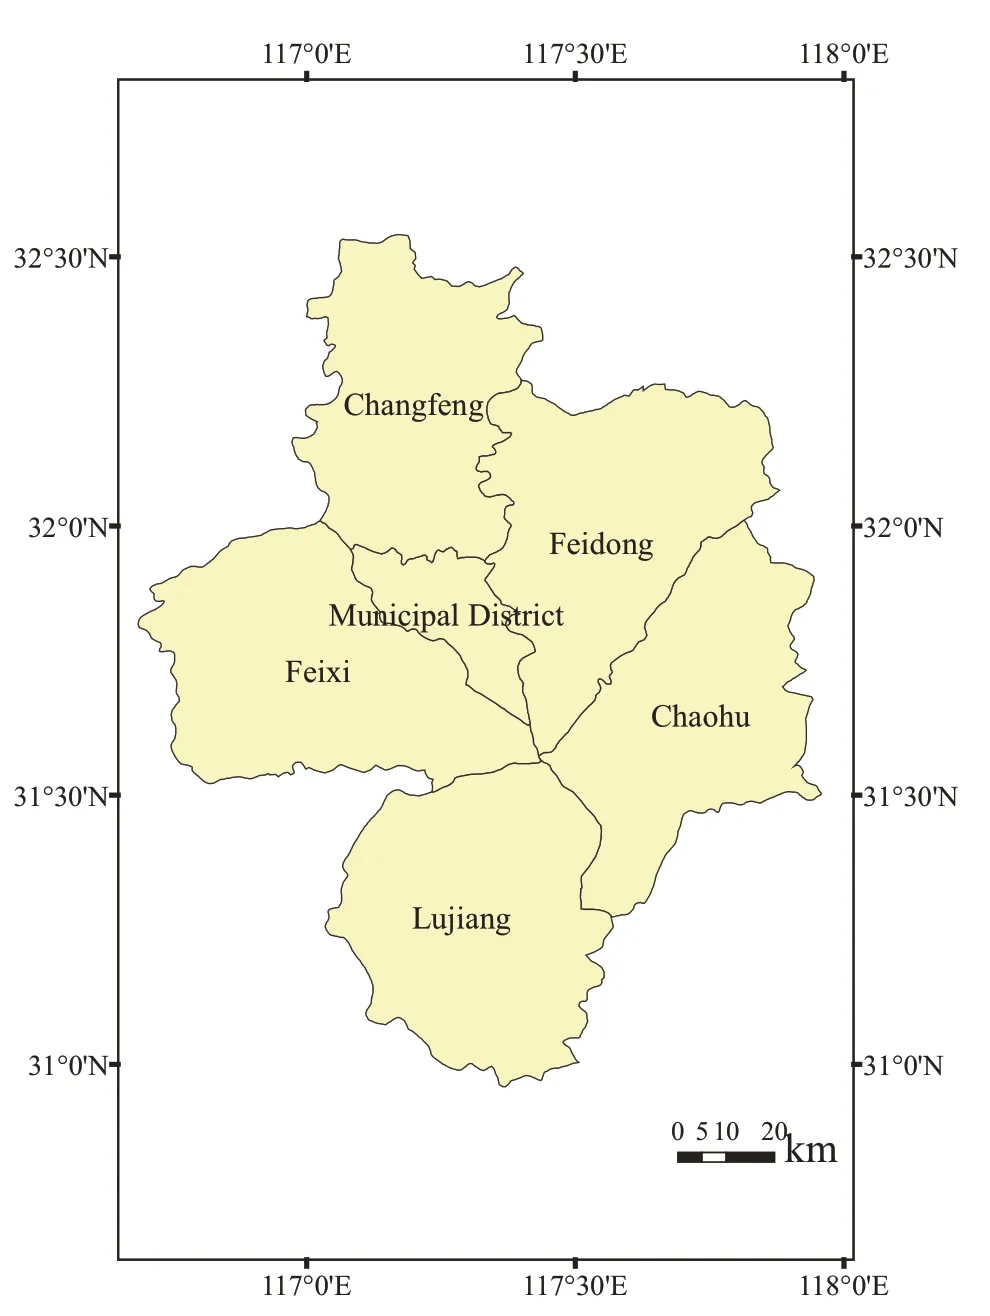
Figure 1. Location and administrative divisions of Hefei city,China.
2.2. Data sources
The activity data were based on the local statistical yearbooks. The emission factors (EFs) were mainly adopted from the Technical Guidelines for the Preparation of Atmospheric Ammonia Emissions Inventory from the Ministry of Ecology and Environment of the People’s Republic of China (2014) as well as domestic research results(Shen 2014),and the former is preferred.
2.3. Estimation method
The NH3emissions inventory was established on the basis of activity data from various sources and corresponding EFs,as shown in Equation(1):
where E is the agricultural NH3emissions; i and j represent the county and the source type,respectively;A represents the county-level activity data;EF represents the source-specific EF;and γ is the conversion coefficient for N-NH3emissions (1.214 for livestock waste, 1.0 for other sources).
2.3.1. Livestock waste management
NH3emissions from livestock and poultry mainly come from the release of animal waste(Yang 2008).Livestock and poultry manure management stages include outside, house, storage, and spread. The last three stages occur indoors and excreta is divided into liquid and solid forms (Shen et al. 2014). We selected a total of 14 subcategories including yellow cattle, dairy cows, buffalo,reproductive sow, laying hens, laying ducks, goats,sheep, laying geese, beef cattle, hogs, broilers, meat ducks, and meat geese for the livestock NH3emissions estimates based on the local statistical yearbooks. NH3emissions from livestock were based on total ammoniacal nitrogen (TAN) (Beusen et al. 2008), and related parameters for estimating the amount of TAN are listed in Table S2. Table S3 shows the NH3EFs for different livestock. The EFs for yellow cattle and buffalo were referenced from Shen(2014).For livestock with breeding cycles greater than one year, the statistical herd size at the end of the year was used for emission estimates,while for livestock with breeding cycles less than one year,we used the number of slaughters.The proportions of free-range pigs, cattle, poultry, and sheep in Anhui were 10%, 5%, 5% and 50%, respectively (Liu et al. 2018). Referring to the latest technical guidelines from the Ministry of Ecology and Environment of the People’s Republic of China (2014), we obtained calculation methods to estimate NH3emissions from livestock waste.
2.3.2. Farmland ecosystem
Farmland ecosystem sources include N fertilizer application, cropland soil emissions, N-fixing crops and crop residue composting.After the application of N fertilizer,N volatilizes into the atmosphere in the form of NH3,which is an important source of atmospheric NH3emissions(Zhang et al.2010).N fertilizer types included urea,ammonium bicarbonate, ammonium nitrate, ammonium sulfate, and other nitrogenous fertilizers.The proportions of the different fertilizers used in applications are listed in Table S4. Based on Zhang et al. (2011), we obtained the percentage of nitrogenous fertilizer applied each month in the study area (see Table S5).Affected by the fertilization rate and fertilization mode,the actual EF was corrected on the basis of benchmark EF,as shown in Equation(2):
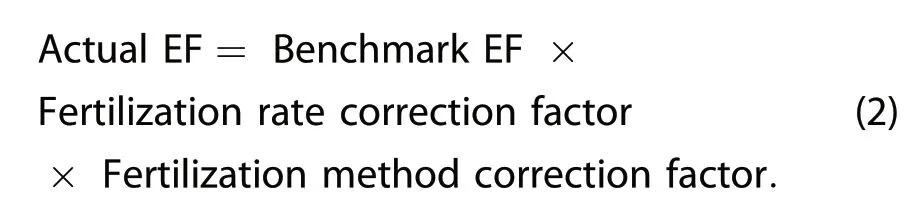
For Equation(2),the benchmark EF is shown in Table S6.The soil in Hefei city is alkaline(Wang and Dai 2012).The average monthly temperature in Hefei city was obtained from the Anhui Statistical Yearbook (see Table S7). The fertilization rate correction factor,which is related to the N application rate per unit of cultivated land, was 1.18 when the N application rate per unit of cultivated land was greater than 19.5 t km−2and 1 when the rate was less than 19.5 t km−2.The fertilization method correction factor was 0.32 when fertilizer was applied to the soil and 1.0 when fertilizer was applied on the surface. Due to the limited data on fertilization methods in Hefei city,we referred to the basal and topdressing ratios of rice,wheat,and maize in eastern China(Wang et al.2008).
For other sources of emissions in farmland ecosystems such as agricultural soil, N-fixing crops and cropresidue compost, the calculation methods came from the latest technical guidelines from the Ministry of Ecology and Environment of the People’s Republic of China (2014). NH3emissions from cropland soil were based on the cultivated area. We calculated the emissions from N-fixing beans and peanuts within their planting area. For crop-residue compost, we used the amount of straw compost to estimate NH3emissions.The crops in this study included rice, wheat, maize,cotton,beans,peanuts,and canola.The amount of compost was calculated based on Equation(3):
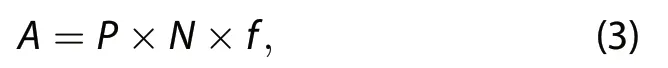
where P is the crop yield (units: t) and N is the grassvalley ratio, and the corresponding values are listed in Table S8. f is the composted proportion, which was 42.3% (http://www.ndrc.gov.cn/zcfb/zcfbtz/201612/W020161207332838590161.pdf).
2.3.3. Biomass burning
Biomass burning is the fourth largest source of energy,after coal,oil and natural gas(Cao et al.2005).According to the topography and vegetation in Hefei city, this study estimated the NH3emissions from the open burning of waste straw, and the amount of burning was determined with Equation(4):
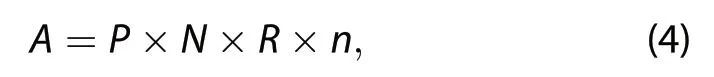
where P is the crop yield(units:t),including rice,wheat,maize,cotton,beans,peanuts and canola;N is the grassvalley ratio,which is consistent with the value for straw compost; R is the ratio of open straw burning with an empirical value of 20%;and n is the burning rate,which is 0.9.
In this study,localized EFs in Hefei were used in most livestock and N fertilizer applications to calculate NH3emissions,but other EFs were adopted from the Ministry of Ecology and Environment of the People’s Republic of China(2014)(see Table S9).
2.4. Temporal and spatial allocation
2.4.1. Temporal distribution
The characteristics of emissions from N fertilizer application are affected by the N application rate, the fertilization mode, and environmental factors. The monthly average temperature can roughly reflect the monthly variation in NH3emissions from N fertilizer application(Yin 2011). The monthly emissions from livestock were mainly due to ambient factors,such as temperature and wind speed (Wang et al. 2018b). We calculated the monthly livestock NH3emissions using the model developed by Adelman and Baek (Shen 2014; Liu et al. 2018;Wang et al. 2018b). Meteorological data (site location,wind speed, and daily temperature) in Hefei were obtained from the Meteorological Station of Nanjing University of Information Science and Technology.
2.4.2. Spatial distribution
Livestock and N fertilizers dominated the spatial distribution of the total emissions, so we used a geographic information system (ArcGIS) to distribute the NH3emissions from these two sources onto a 1 km × 1 km grid according to land-use data(Yin 2011).The 1 km×1 km land-use data were provided by the Data Center for Resources and Environmental Science, Chinese Academy of Sciences (http://www.resdc.cn). The areas of livestock and poultry farming are mostly concentrated near rural residential areas, and the allocation of NH3emissions was based on the distribution of rural settlements in each county. NH3emissions from N fertilizer application sources mostly occurred on cultivated land,and the spatial distribution of NH3emissions was based on the cultivated land area of each county.
3. Results and discussion
3.1. NH3 emissions inventory and its contribution
3.1.1. NH3 emissions inventory
The NH3emissions from the agricultural sources in Hefei city in 2017 are displayed in Table 1.The NH3emissions from agricultural sources totaled 27,242.7 t in 2017, of which livestock waste, farmland ecosystems, and biomass burning accounted for 54.5%, 43.7%, and 1.8%,respectively. Livestock was the dominant contributing source of agricultural NH3emissions,which is consistent with the results in Li et al.(2019)and Wang.et al.(1997)and is mainly due to the large amount of livestock raised in Hefei.N fertilizer application accounted for as much as 85.0% of the farmland ecosystem emissions, which is related to the substantial amount of N fertilizer applied in the area. The NH3emissions from cropland soil and crop residue compost were similar,accounting for 8.4%and 6.2%of the total emissions in farmland ecosystems,respectively. N-fixing crops accounted for the smallest proportion of the agricultural emission sources.
3.1.2. Characteristics of NH3 emission contributions
The contributions of NH3emissions from various livestock are depicted in Figure 2.A considerable proportion of emissions came from broilers and laying hens,accounting for 34.5% and 22.2% of the total livestock emissions,respectively.This scenario could be attributed to the relatively rapidly increasing consumption of meat and eggs,which has caused an increase in the output of these livestock to satisfy the needs of the human diet.Dairy cows and hogs had similar emission proportions,accounting for approximately 11%of the total livestock NH3emissions.A hog has a fast feeding cycle that results in numerous slaughters each year.Dairy cows also generated relatively high NH3emissions,with statistical data showing that the number of dairy cows in Hefei city in 2017 was approximately 31 688, which was relatively high compared to the number of other cows.In contrast,the smaller emission contributions from other large animals,such as beef cattle,yellow cattle and buffalo,were mainly due to the lower levels of activity.Other livestock(e.g.sows,meat ducks, egg ducks,meat geese and egg geese) had low NH3emissions because of their low numbers and annual average N excretion.
The agricultural NH3emission contributions and emissions intensity from various sources in each county are described in Figure 3. Changfeng County was the largest contributor to NH3emissions, reaching 7753.3 t in 2017 and contributing 28.5% of the total emissions.Followed by Changfeng, the emissions of Feixi and Feidong contributed 24.5% and 21% of the total emissions, respectively. The above three counties had relatively high NH3emissions because of their developed livestock industries, large sowing areas and substantial N application areas. However, the NH3emissions in Lujiang and Chaohu were relatively low, accounting for approximately 10%of the total emissions.The municipal districts with the lowest NH3emissions accounted for only 4.0% of the total emissions, which was relative to the small scale and output of agriculture in this region.The emissions intensity of NH3was the highest in Changfeng County, as high as 4.2 t km−2in 2017, followed by that in Feixi and Feidong counties.Overall,the average NH3emissions intensity for the agricultural sources in Hefei in 2017 was 2.4 t km−2.
3.2. Temporal and spatial characteristics of NH3 emissions
3.2.1. Temporal distribution
As depicted in Figure 4,an obvious monthly variation in the NH3emissions was found from livestock waste and N fertilizer.The highest NH3emissions occurred in summer, with annual emissions from livestock waste and N fertilizer application. The monthly NH3emissions variation from livestock waste showed a similar trend with the temperature change. With the increase in temperature, NH3emissions from livestock waste increased,reaching a maximum of 3558.81 t in summer and decreasing to a minimum of less than 400 t in winter.These results mainly depend on the temperature. The monthly N fertilizer application emissions were affected by weather conditions and cultivation methods. The winter wheat–summer rice rotation system is a common farming practice in Hefei. NH3volatilization began to increase with spring sowing and fertilizer application in March. The higher summer emissions, up to 1519.45 t, were mostly due to the application of tiller fertilizer to rice in June and the basal dressing to late rice in July. At the end of September and early October,substantial crop harvesting begins, and winter wheat is sown with basal fertilizer. Despite fertilizer was applied in October, NH3emissions in October were still lower than in summer due to lower temperature.
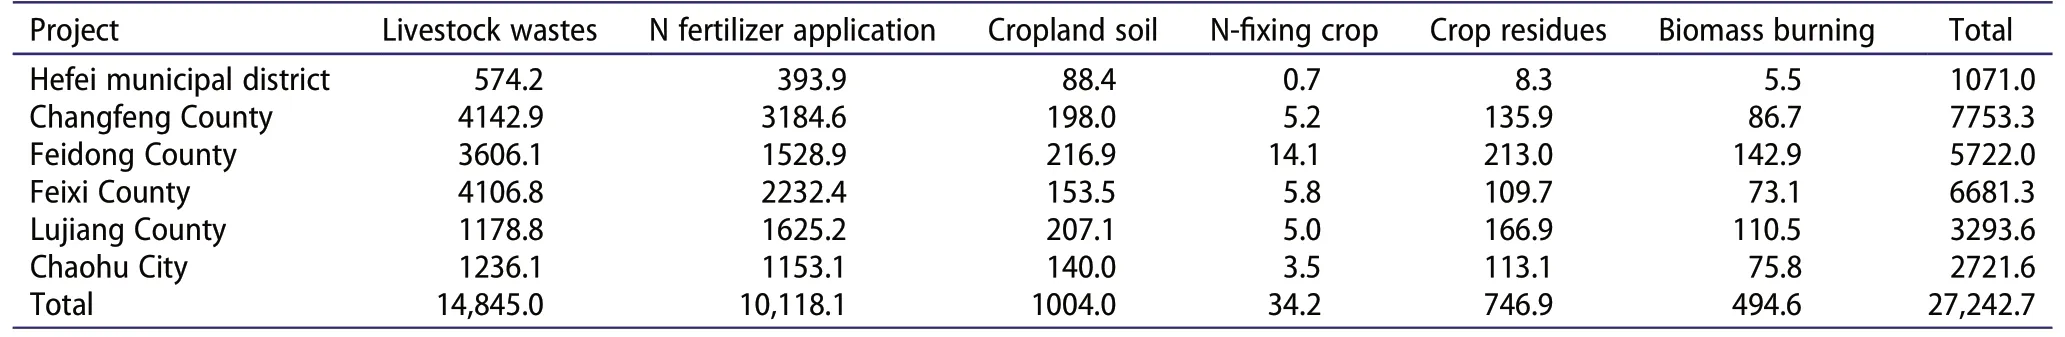
Table 1.NH3 emissions inventory for agricultural sources in Hefei city in 2017(units:t).
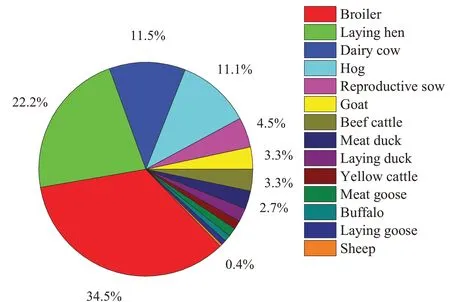
Figure 2.Contribution of NH3 emissions from various types of livestock in 2017 in Hefei city.
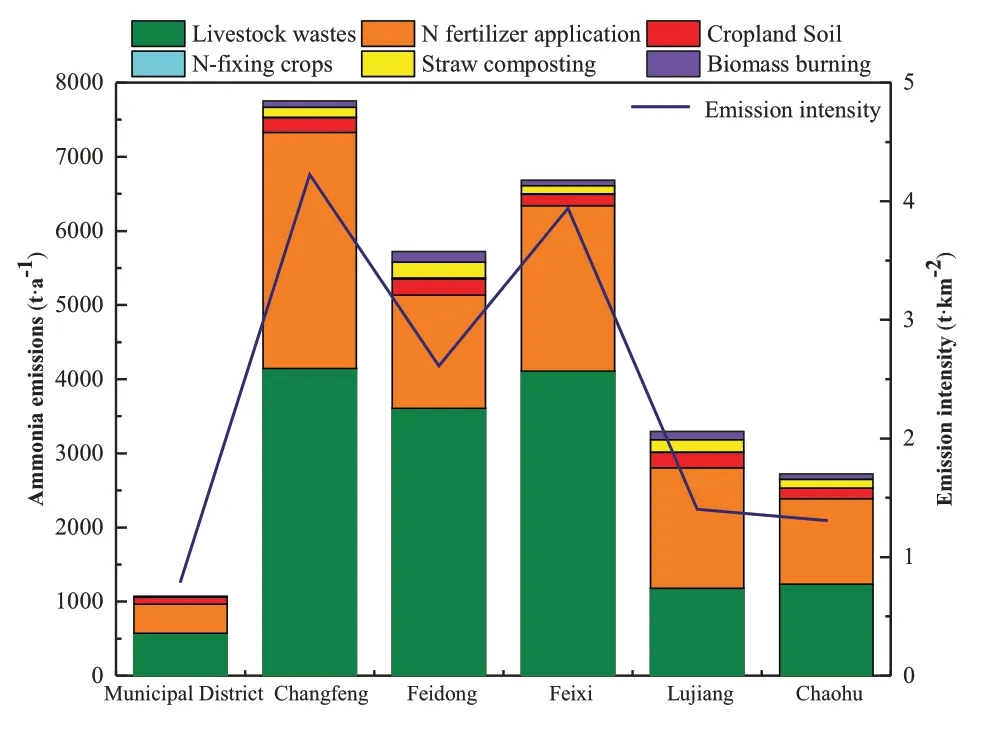
Figure 3. Characteristics of NH3 emissions and emissions intensity in Hefei city in 2017.
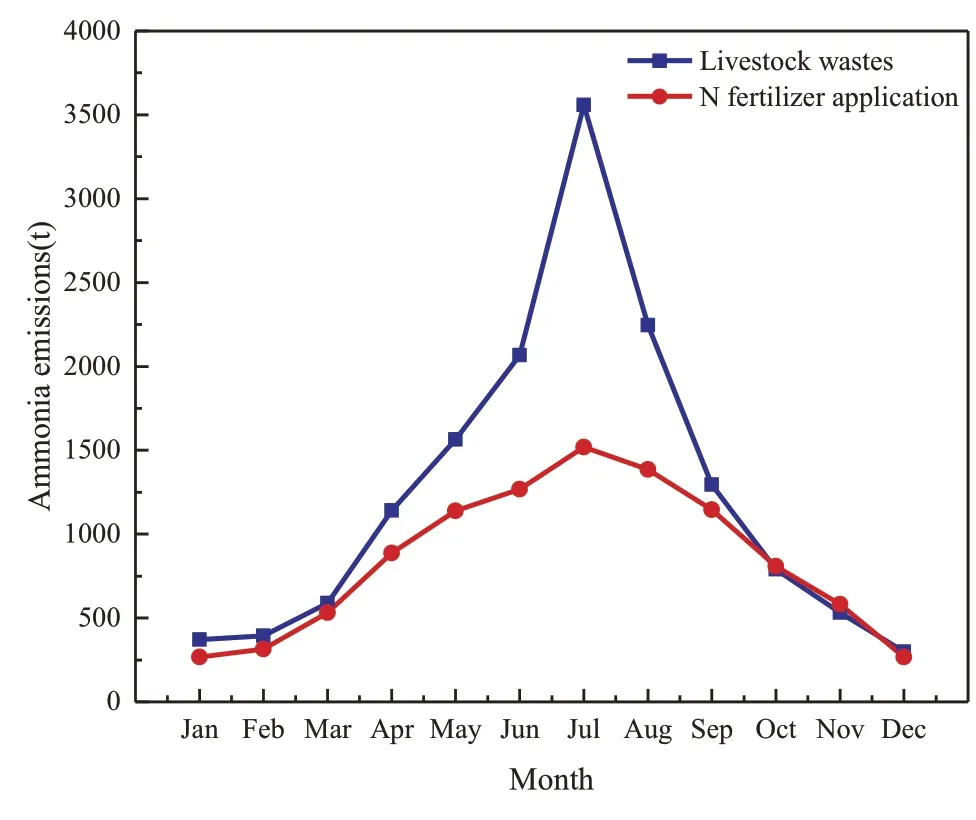
Figure 4.Time series of NH3 emissions from agricultural sources in Hefei city in 2017.
3.2.2. Spatial distribution
The 1 km × 1 km gridded NH3emissions in Hefei are illustrated in Figure 5 for the spatial distribution of emissions from livestock and N fertilizers. The majority of emissions of livestock (Figure 5(a)) were concentrated in Feixi,Changfeng, and Feidong, reaching 2.4,2.3,and 1.6 t km−2,respectively.This result was mainly attributed to dense rural residential areas and numerous intensive livestock farms.Due to the large cultivated land area and substantial N application, the high NH3emissions from N fertilizer application (Figure 5(b)) occurred in Changfeng and Feixi with an emissions intensity of 1.7 and 1.3 t km−2,respectively.Generally,the distribution of agricultural sources(Figure 5(c))showed high emissions in the northern area of Hefei due to the high population density,the large area of arable land,and the high levels of agricultural activity. The counties of Changfeng and Feixi were the largest NH3emitters,which was attributed to the frequent agricultural activities.The relatively high NH3emissions in Feidong County were due to the large amount of livestock.
3.3. Evaluation of the NH3 emissions inventory
3.3.1. Comparison with previous studies
This study provides a detailed description of NH3emissions from agricultural sources in Hefei in 2017.The NH3emissions in different regions are compared and listed in Table 2.The amount of NH3emissions from livestock and fertilizer accounted for almost 90%of the total emissions from agricultural sources, which was consistent with most of research results (Huang et al. 2012). We also compared the estimated results of this study with those for cities in the Yangtze River Delta and found that the NH3emissions in Hefei were higher than those in Nanjing (Liu and Yang 2015), Suzhou (Zhou et al.2016) and Hangzhou (Yu et al. 2016) due to the large amount of livestock and applied fertilizer. In addition,the alkaline soil in Hefei leads to a larger EF for N fertilizer applications, increasing the estimated values. However,compared with Shanghai (Dong et al. 2009), Hefei had little activity-level data for agricultural sources,resulting in relatively low NH3emissions.
3.3.2. Uncertainty analysis
There are many uncertainties in emission estimations that affect the inventory accuracy, mainly due to the lack of activity data and EFs (Zhong et al. 2007). The activity-level data in this study were obtained from statistics from government departments, which ensured the reliability of the data. Moreover, we distinguished between intensive and free-range livestock. For N fertilizer application,we considered a number of parameters, such as the soil pH, weather conditions, and application method. Therefore, the uncertainty related to livestock waste and fertilization application was relatively low. In summary, the activity-level data and EFs used in this inventory are reliable. Therefore, the NH3emissions from agricultural sources in Hefei city are comparable to those in other regions, and the established emissions inventory is rational and can reflect the actual emissions of agricultural NH3in Hefei city to a certain extent.
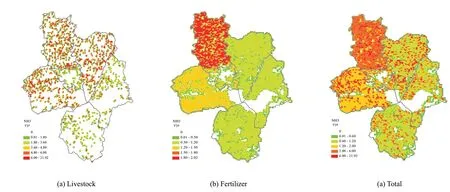
Figure 5.Spatial distribution of NH3 emissions from agricultural sources in Hefei city in 2017.
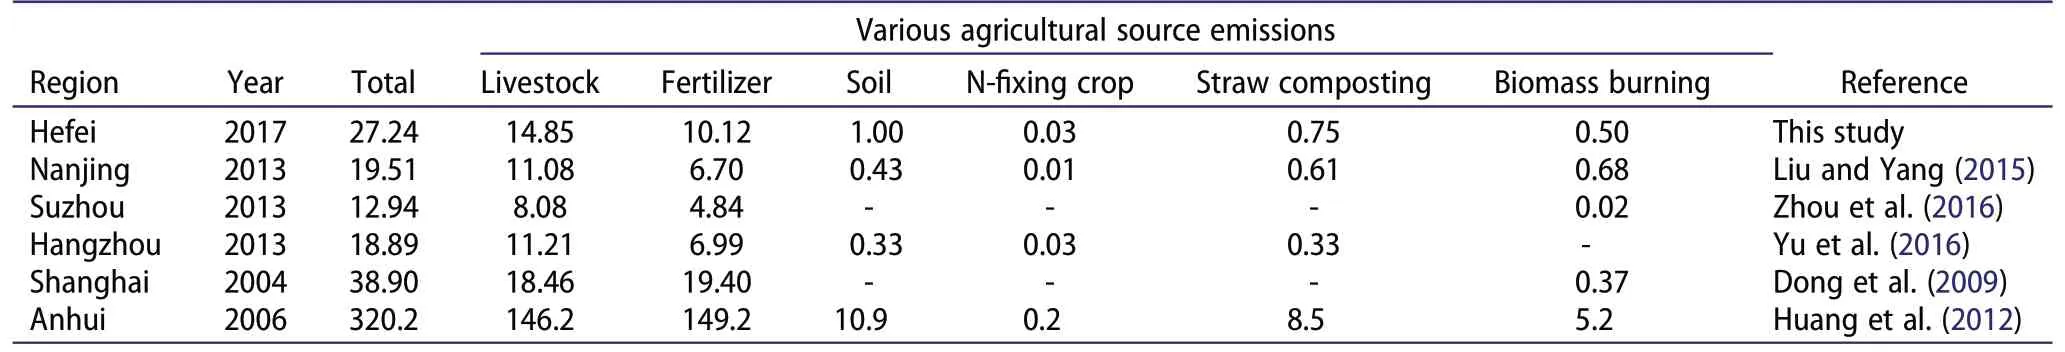
Table 2.Agricultural NH3 emissions in different regions(units:kt).
4. Conclusions
In this study,we established an accurate 2017 NH3emissions inventory for agricultural sources with a spatial resolution of 1 km × 1 km in Hefei based on specific activity-level data and the latest county-level EFs.Three main sources were considered:livestock waste management, farmland ecosystems, and biomass burning. The NH3emissions totaled approximately 2722.7 t yr−1, to which livestock was the top contributor,accounting for 54.5%. Among livestock waste management, broilers and laying hens were the largest sources of emissions,accounting for 34.5% and 22.2% of the total NH3emissions from livestock, respectively. Dairy cows and hogs were the next largest sources of emissions.
The highest agricultural NH3emissions and emissions intensity was in Changfeng County,where the emissions and emissions density were as high as 7753.3 t and 4.2 t km−2in 2017, respectively. The lowest emissions were in Hefei city,with annual emissions of only 1071.0 t and an emissions intensity of approximately 0.8 t km−2in 2017. The average emissions intensity in Hefei in 2017 was 2.4 t km−2. Obvious seasonal variability was observed, with the highest emissions in July and the lowest emissions at the beginning and end of the year,associated with meteorological conditions and local agricultural practices. Simultaneously, the areas with higher emission intensities were mainly in northern Hefei, mainly attributed to the dense population and developed agriculture.
Disclosure statement
No potential conflict of interest was reported by the authors.
Funding
This work was supported by the National Natural Science Foundation of China [grant number 41775154], the Six Talent Peaks Project in Jiangsu Province [grant number JNHB-057],and the Postgraduate Practical Innovation Program of Jiangsu Province of China[grant number SJCX19_0301].
杂志排行
Atmospheric and Oceanic Science Letters的其它文章
- Are typhoon and marine eutrophication the possible missing sources of high dissolved organic nitrogen in wet deposition?
- Spatial and seasonal patterns of atmospheric nitrogen deposition in North China
- Impact of an accidental explosion in Tianjin Port on enhanced atmospheric nitrogen deposition over the Bohai Sea inferred from aerosol nitrate dual isotopes
- Atmospheric nitrogen deposition in Yangtze River Delta:insights gained from the nitrogen content and isotopic composition of the moss Haplocladium microphyllum
- Changes in PM2.5 sensitivity to NOx and NH3 emissions due to a large decrease in SO2 emissions from 2013 to 2018
- Dry deposition of ammonia around paddy fields in the subtropical hilly area in southern China