Dry deposition of ammonia around paddy fields in the subtropical hilly area in southern China
2020-10-09YIYuchenSHENJinlinYANGChodongWANGJunLIYongndWUJinshui
YI Yuchen,SHEN Jinlin,YANG Chodong,WANG Jun,LI Yong nd WU Jinshui
aCollege of Horticulture and Gardening,Yangtze University,Jingzhou,China; bKey Laboratory of Agro-ecological Processes in Subtropical Regions,Institute of Subtropical Agriculture,Chinese Academy of Sciences,Changsha,China; cChangsha Research Station for Agricultural&Environment Monitoring,Institute of Subtropical Agriculture,Chinese Academy of Sciences,Changsha,China
ABSTRACT This study measured the ammonia (NH3) concentration and dry deposition within 100 m around paddy fields(0.6 ha)with double rice cropping in the subtropical hilly area in southern China,with the aims to quantify the dry deposition of NH3 around the emission source and to clarify its temporal and spatial variability.The results showed that high NH3 concentrations were found during the 15 d after nitrogen(N)fertilizer application at downwind sites within 100 m around the paddy fields,and the NH3 concentrations were 12–62,2.8–7.3,13–38,and 4.9–36 μg N m−3 during the 15 d after basal fertilizer application and topdressing in the early rice season and after basal fertilizer application and topdressing in the late rice season, respectively. The NH3 concentrations were relatively low (1.5–-3.8 μg N m−3)during other periods of the rice season at the downwind sites,which indicated that N fertilizer application in paddy fields highly affected the NH3 concentration at downwind sites.The NH3 concentrations at the downwind sites decreased significantly with the increase in distance from the paddy fields. The total NH3 dry deposition around 100 m of the paddy fields accounted for approximately 79% and 81% of the emitted NH3 from the paddy fields in the early and late rice seasons,respectively.The results indicate that dry deposition of NH3 around emission sources may be an important way to remove the NH3 volatilized from croplands in this subtropical hilly area.
KEYWORDS Ammonia;dry deposition;nitrogen deposition;ammonia volatilization;paddy field
1. Introduction
Ammonia (NH3), which mainly comes from NH3volatilization from nitrogen(N)fertilizer application in farmland and livestock manure (Kang et al. 2016), is the most abundant alkaline gas in the atmosphere. NH3in the atmosphere can react with acidic gases (sulfuric acid,hydrogen chloride, etc.) to form secondary aerosol particles containing ammonium salts, e.g., ammonium sulfate, ammonium bisulfate, ammonium nitrate, and ammonium chloride. These ammonium salts account for 30%–50% of PM2.5and PM10(atmospheric particulates with aerodynamic diameters less than 2.5 and 10 microns, respectively) in weight (Aneja, Schlesinger,and Erisman 2008; Shen et al. 2011). Ammonia and ammonium in the atmosphere can be returned to the surface through wet and dry deposition, which are the main components of atmospheric N deposition, and usually account for more than 50% of the total N deposition(Pan et al.2012;Shen et al.2013;Xu et al.2015). Excessive N deposition will lead to water eutrophication, soil acidification, increased nitrous oxide (N2O) emissions from soil and water, reduced biodiversity,and other adverse ecological effects(Liu et al.2011).
Because NH3dissolves easily in water, its chemical property is active, and its dry deposition rate is fast(Hertel et al.2012).Ammonia is mainly emitted from the ground or near the vents of animal farms,and thus may have a higher deposition rate around the emission sources.Studies on NH3deposition around animal farms in Europe,America,and Australia have shown that there were high NH3deposition rates around the sources of NH3emissions(Fowler et al.1998;Walker et al.2008;Shen et al.2016).Measures such as planting trees around the sources were proposed to increase the near-source deposition of NH3, and to reduce the long-distance transportation of NH3, so as to reduce its environmental hazards (Bealey et al. 2016). In the subtropical region of China, crop and animal production are flourishing, and there is a high intensity of NH3emissions in the region (Huang et al.2012; Kuang et al. 2016). The subtropical hilly region of China is located in the southeastern part of the country,mainly distributed in Hunan, Hubei, Jiangxi, Zhejiang,Fujian, Guangdong, and Guangxi provinces. The region has many mountains and hills,and relatively little arable land.Paddy and vegetable fields are mainly distributed in the valleys,tea plantations and orchards are distributed in the mountains and hills,and animal farms are often built near the mountains and hills.This pattern of distribution of croplands or animal farms accompanying the surrounding natural ecosystems may result in a higher near-source deposition ratio of NH3in the subtropical hilly region than that in the plain areas.Recent observations also showed that the concentration of NH3in the subtropical hilly areas of China was not very high(Liu et al.2019), which indirectly indicates that there may be a high near-source deposition of NH3in the subtropical hilly areas, but there is no direct experimental evidence.
In this study, the NH3concentration and its dry deposition in the neighborhood of a typical paddy area in the subtropical hilly region of China were studied.The aim was to quantify the NH3deposition around typical paddy fields in the subtropical hilly areas,and clarify its temporal and spatial variability. Our study will help to clarify the fate of the NH3emitted from paddy fields,to evaluate the environmental effects of NH3more reasonably,and to provide a scientific basis for the implementation of agricultural NH3emissions reduction.
2. Materials and methods
2.1 Study site
In this study,a paddy area with double rice cropping(28°32′55″N,113°19′50″E;94 m above sea level)was selected in the hilly area of central Hunan Province(Jinjing Town,Changsha).The area has a subtropical monsoon climate,with an average annual temperature of 17.5°C and an average annual rainfall of 1330 mm. The rainfall mainly occurs during March to August of each year,accounting for more than 60%of the annual rainfall(Figure S1).The frost-free period is about 300 days,and northwest–southeast winds prevail perennially.The rice growing area was 200 m in length from north to south,and 30 m in length from east to west. In the paddy area, double rice was planted during April 2018 to October 2018.The average N, phosphorus pentoxide, and potassium oxide application rates were 95,60,and 79 kg ha−1,respectively,in the early rice season,and 119,60,and 79 kg ha−1in the late rice season. Among them, phosphorus and potassium fertilizers were used as basal fertilizer on one occasion,N fertilizer was applied twice using urea,and the ratio of basal application to topdressing was 3:1.The application date of basal fertilizer in the early rice season was 28 April,and that of topdressing was 14 May.The application date of basal fertilizer in the late rice season was 29 July, and that of topdressing was 13 August.There are masson pine forests on the eastern and western sides of the paddy area,shrubs to the south,and organic vegetable fields to the north. For the organic vegetable fields, fertilizer was only applied in spring and autumn, but not during the growth period of rice.There was no livestock and industrial pollution in the 1-km area around the rice area.
Previous studies on NH3deposition around emission sources(Fowler et al.1998;Walker et al.2008;Shen et al.2016) have shown that the higher is the NH3emissions intensity, the further the distance NH3is deposited from the sources. Given that the studied paddy area had a moderate NH3emissions intensity, the NH3deposition measurement was conducted within 100 m from the paddy fields.The NH3sampling points were arranged in the upwind direction and the downwind direction. The upwind direction points were set at 50 m from the paddy area along the upwind transect of the paddy area,while the downwind direction points were set at 0 m, 20 m,50 m,and 100 m from the rice area,respectively,along the downwind transect (Figure S2). The locations of upwind and downwind sampling points varied with the change in the main wind direction.Owing to north and south winds being the prevailing winds during the sampling periods,the downwind sites were thus located in the south or north of the paddy fields, while the upwind sites were located in the north or south accordingly.
2.2. Measurement of NH3 concentration
The sampling period of this study was from April to October 2018, when early and late rice were planted.Atmospheric NH3samples at sampling points were collected by a denuder system for long-term NH3sampling(DELTA system) (Shen et al. 2013, 2016). The system had a low-flow sampling pump(0.2–0.4 L min−1)to collect air.When air passed through a denuder filter train, NH3was absorbed by 5%citric acid methanol reagent impregnated on the wall of the two denuders connected in series,and the sampling volume was recorded by a gas meter. The sampling frequency was one sample per day by sampling continuously for 24 h (one sample every two days after topdressing in the early rice season)during the seven days after application of basal N fertilizer and topdressing,and then was one sample every two to three days (48–72 h continuously) in other periods at each sampling site.Samples were stored in a refrigerator at 4°C for chemical analysis within a week.The absorbed NH3on the denuders was extracted with high purity water for half an hour.During sample analysis, ammonium-N in the extraction solution was determined by a continuous flow analyzer(AA3, Seal Analytical Inc., Germany). The NH3concentration was calculated according to the NH3-N adsorbed by the diffusion tube and the sampling volume.
Meteorological parameters at the study site were measured by a weather station (Intelimet Advantage,Dynamax Inc., USA) about 500 m from the paddy area.The measured parameters included air temperature,wind speed,wind direction,air pressure,relative humidity,solar radiation,and rainfall.
2.3. Calculation of NH3 dry deposition
The inferential method was used to calculate the dry deposition of NH3; that is, the dry deposition of NH3was the product of its concentration and its dry deposition velocity. Based on the big-leaf resistance model(Wesely and Hicks 1977), the dry deposition velocity(Vd) is the reciprocal of the sum of three different resistances,and its formula is as follows:
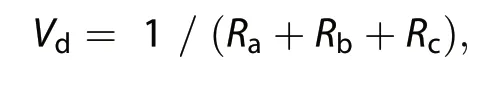
where Rais the aerodynamic resistance,Rbis the laminar boundary layer resistance, and Rcis the canopy resistance. The parameterization methods of Ra, Rb,and Rccan be referred to in Erisman and Draaijers (1995) and Wesely (1989), and the details for the parameterization can be found in Kuang et al.(2016).
3. Results
3.1. NH3 concentrations in the downwind direction from the paddy fields in the early and late riceseasons
The NH3concentration in the downwind direction from the paddy fields had clear spatial and temporal variations. As shown in Figure 1,in the early rice season,there were high NH3concentrations at 0, 20, 50, and 100 m in the downwind direction after basal N fertilizer application. With increasing distance from the paddy fields, the concentration of NH3decreased. The highest NH3concentration at 0 m was 163 μg N m−3,while the highest concentration at 100 m was 40 μg N m−3. High concentrations of NH3occurred mainly within five days after application of basal fertilizer, and then the NH3concentration decreased significantly. However, the NH3concentrations in the downwind direction within 100 m from the paddy fields were still higher than those at the background point (Figure S3)during the 15 days after fertilizer application.The concentration of NH3only increased slightly in the downwind direction after topdressing of N fertilizer, and decreased with increasing distance from the paddy field.After 15 days of N fertilizer topdressing,the NH3concentrations at downwind sites were always at a low level(< 5 μg N m−3).
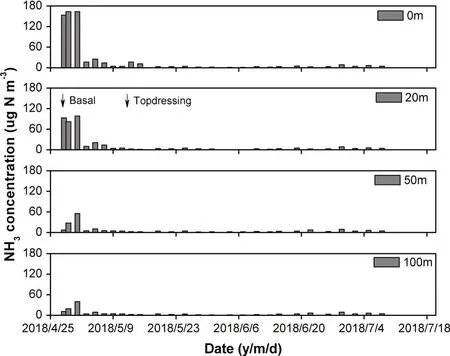
Figure 1.Daily NH3 concentrations at downwind sites in the early rice season.
The NH3concentrations were also higher in the downwind area of the paddy fields after N fertilizer application in the late rice season(Figure 2). The highest concentration of NH3at 0 m reached 200 μg N m−3,while the highest concentration of NH3at 100 m was 49 μg N m−3. The concentration of NH3also declined with distance from the paddy fields.However,different from the early rice season,the concentrations of NH3in the downwind direction increased significantly after topdressing N fertilizer in the late rice season. In the 15 days after topdressing,the highest concentration at 0 m was 133 μg N m−3, and the highest at 50 m was 70 μg N m−3.Thereafter,the downwind NH3concentrations were also at a low level(< 5 μg N m−3).
3.2. Downwind NH3 mean concentrations during fertilization and non-fertilization periods in early and late rice seasons
Previous work on NH3volatilization from paddy fields has shown that NH3volatilization mainly occurs in the 15 days after N fertilizer application (Wu et al.2019). Thus, the mean concentrations of NH3in the early and late rice seasons at the downwind sites of the paddy fields were calculated for the 15 days after basal fertilizer application, 15 days after topdressing,and other periods (Figure 3). In the early rice season,the mean concentrations of NH3within 15 days after basal fertilizer application and 15 days after topdressing were 12–62 and 2.8–7.3 μg N m−3, respectively.The mean concentrations of NH3in the downwind direction were 5.2–27 and 1.6–4.1 times higher,respectively, than that those at 50 m in the upwind direction in the corresponding period. In the late rice season, the mean concentrations of NH3at the downwind sites within 15 days after basal fertilizer application and 15 days after topdressing were 13–39 and 4.9–36 μg N m−3, respectively, and decreased exponentially (P <0.05) with increasing distance from the paddy fields. The concentrations of NH3at downwind sites were 5.0–14 and 1.3–49.7 times higher, respectively, than those at the background point during the same sampling period. In the other periods, the mean concentrations of NH3at the downwind sites were 2.4–3.9 and 1.5–2.7 μg N m−3in the early and late rice season, respectively. The trend of variation in NH3concentration with distance was not significant, and the difference between the downwind and upwind direction was small.
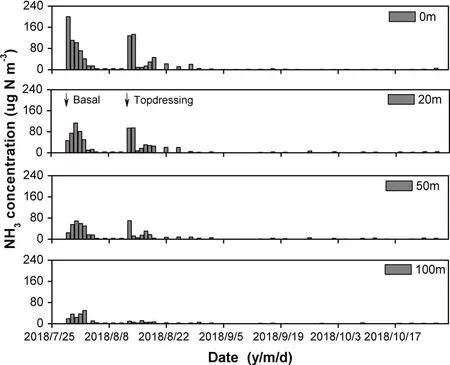
Figure 2.Daily NH3 concentrations at downwind sites in the late rice season.
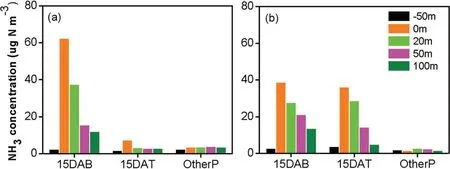
Figure 3.Mean concentrations of NH3 during the 15 days after basal fertilizer application(DAB),15 days after topdressing(DAT)and the non-fertilization period(OtherP)at the downwind and upwind sites of the paddy fields in the(a)early and(b)late rice seasons.
3.3. Dry deposition of NH3 in the neighborhood of paddy fields during fertilization and non-fertilization periods in early and late rice seasons
As shown in Table 1,the background NH3deposition and the NH3deposition caused by NH3volatilization in paddy fields in the downwind area were calculated separately.In the early rice season, the proportions of south and north winds in all wind directions were 0.42 and 0.45, respectively, during the 15 days after basal fertilizer application(wind speed was usually less than 0.2 m s−1during the other 13%of the period,which belonged to the calm wind state, and thus NH3dry deposition could be neglected),and the calculated total NH3deposition in the area of 100 m in the downwind direction was 2.3 kg. During the 15 days after topdressing and the other periods,the total NH3deposition in the 100-m downwind area was 0.36 kg and 0.93 kg,respectively.The total amount of NH3deposition in the area of 100 m in the downwind direction in the early rice season was 3.6 kg.Of all the NH3deposition,the deposition caused by the background NH3concentration was 0.90 kg,accounting for 25%of the total deposition.
In the late rice season,the total NH3deposition in the 100-m downwind area was 2.0 kg, 1.8 kg, and 0.98 kg,respectively, during the 15 days after basal fertilizer application, the 15 days after topdressing, and the other periods. The total amount of NH3deposition in the area of 100 m in the downwind direction in the late rice season was 4.8 kg. The total deposition caused by the background NH3concentration was 1.3 kg,accounting for 27%of the total deposition.
4. Discussion
Our results show that there are high NH3concentrations in the downwind area of paddy fields in the subtropical region of China.In this study,the NH3concentrations at the downwind sites were mainly higher than those at the background site during the 15 days after N fertilizer application,and were stable and low during other periods in the rice season.This indicates that NH3volatilization after N fertilization application is an important reason for high concentrations in downwind areas. The N fertilizer used in paddy fields of China is usually urea.In the process of urea hydrolysis, the pH of ponding water in the paddy fields will increase, which promotes a rapid increase in the ammonium ion content of the water, resulting in a large amount of NH3volatilization(Wu et al.2019).In addition,meteorological factors also play an important role in affecting NH3concentrations at downwind sites. Ammonia volatilization increases with increasing temperature(Shen et al.2011).The larger are the fluxes of NH3volatilization, the higher are the concentrations of NH3in the atmosphere(Wang et al.2017).Temperatures in summer are higher than in spring in this study area, which may also be one of the reasons why there were two peaks of NH3concentrations in the late rice season,i.e.with relatively high temperatures during the basal fertilization and topdressing periods, while there was only one peak after basal fertilizer application in the early rice season,i.e.with relatively low temperatures during the basal and topdressing fertilization periods. The concentrations of NH3in the downwind area did not increase significantly after topdressing in the early rice season, which may be because there was abundant rainfall during this period, and the rainfall would have had a dilution effect on the concentration of ammonium-N in the ponding water, thus reducing NH3volatilization.
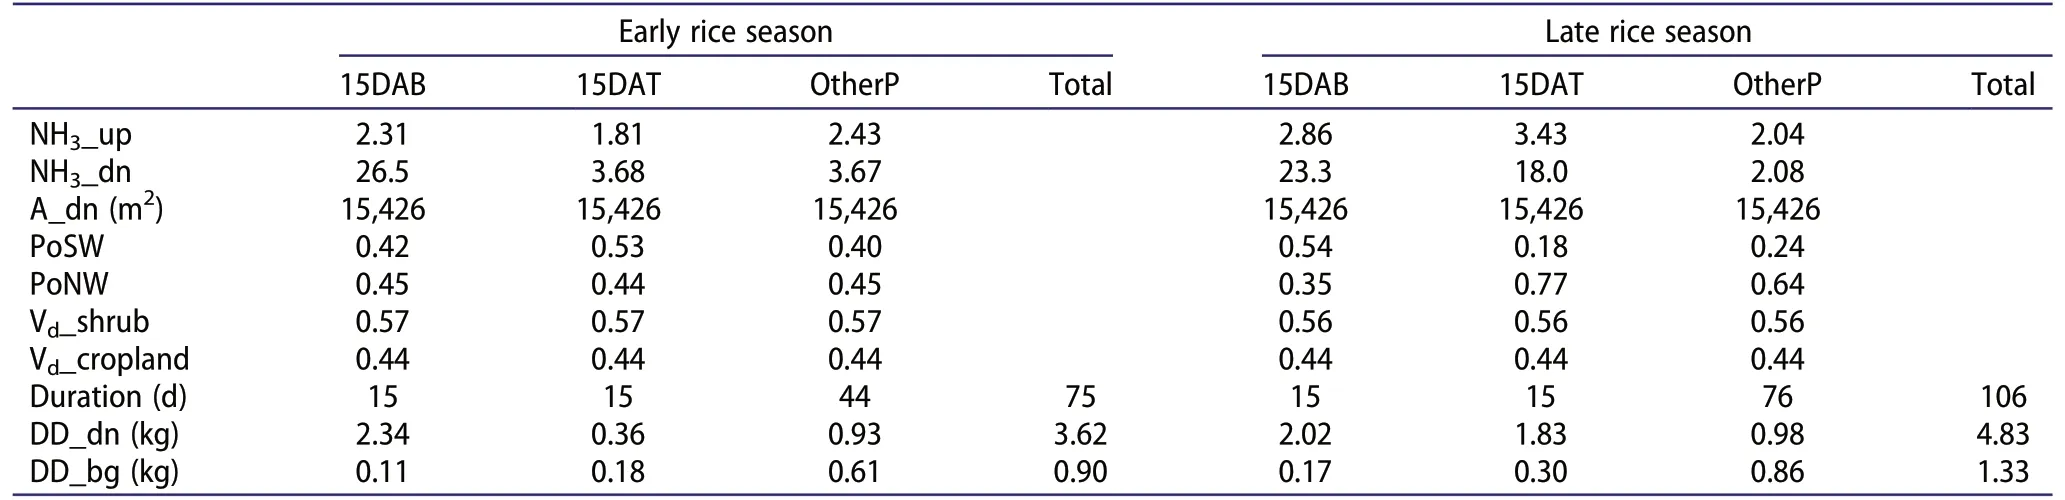
Table 1.Ammonia dry deposition during the fertilization period(15 days after N application)and the non-fertilization period in the downwind area 100 m from the paddy fields in the early and late rice seasons.
Owing to the relatively low NH3emissions intensity of the studied paddy fields,this study only carried out NH3deposition monitoring in the downwind area within 100 m from the paddy fields. The results showed that the average concentration of NH3at 100 m in the downwind area was still high within 15 days after applying basal fertilizer,which was 5.0–5.2 times that at the background site, but it had dropped by 65%–81% compared with that at 0 m. Within 15 days after topdressing,because the amount of topdressing N fertilizer was only one third that of the basal N fertilizer,the volatilization of NH3might have been greatly reduced. Affected by the weakening of source strength, the concentration of NH3at 100 m dropped to 1.3–1.6 times that of the NH3concentration at the background site,and by 61%–86%compared with that at 0 m.Previous studies have also shown that the distance impacted by NH3emission sources is closely related to the source strength.For example,Shen et al.(2018)observed relatively high NH3concentrations even at 1000 m from an intensive cattle farm with 15 000 beef cattle, which had an NH3emissions intensity of 1.8 t NH3-N d−1. Fowler et al. (1998) found that the NH3concentration was still high at the farthest observation point of 276 m from a chicken farm with 120 000 chickens,which had an NH3emissions intensity of about 13 kg NH3-N d−1.The N loss from NH3volatilization usually accounts for approximately 10% of the applied N fertilizer (Zhu 2008). Based on this estimation, the average NH3emissions intensity from the studied paddy fields was about 0.20–0.75 kg NH3-N d−1during the periods of 15 days after N fertilizer application. This NH3emissions intensity was relatively low,and thus the downwind area within 100 m from the paddy fields could be the main area affected by NH3volatilization.
In this study, the total amounts of N fertilizer used in the early and late rice seasons were 34.2 kg and 42.8 kg,respectively, in the study paddy fields. Based on a 10%NH3volatilization loss,the total amounts of NH3volatilization in the early and late rice seasons were calculated to be 3.4 and 4.3 kg,respectively.The total NH3depositions caused by NH3volatilization in the paddy fields(total NH3deposition in the downwind direction minus that in the background area)in the area of 100 m in the downwind direction in the early and late rice seasons were 2.7 and 3.5 kg, respectively. As a result, the proportions of nearsource NH3deposition in the area around the paddy fields(downwind area within 100 m)to NH3volatilization in the early and late rice seasons were 79% and 81%, respectively.These ratios of NH3deposition around the source to the NH3emissions from the sources were much higher than the measured ratios of 8.3%for the NH3deposition within 1 km from a cattle feedlot (Shen et al. 2016), and 10.4%for the NH3deposition within 500 m from a swine farm(Walker et al.2008).This indicates that the higher the NH3emissions intensity,the smaller the proportion of NH3deposition around the sources, and thus the larger the impacted area due to NH3emissions.
Farmlands in this subtropical hilly area are mostly distributed near the hills, and the uniform cropland area is relatively small (ranging from less than 0.1 ha to 20 ha). Thus, the NH3emissions intensity for the farmland source in this region is relatively small,which leads to a higher ratio of near-source NH3deposition to NH3emissions, and a lower ratio of long-range-transported NH3to NH3emissions. This may also be one of the reasons for the relatively low atmospheric NH3concentration in subtropical hilly areas (Liu et al. 2019). In this study, the paddy area was relatively small, which resulted in a small source strength. It is still necessary to study the near-source deposition characteristics of NH3in paddy fields with different emission intensities.
In view of the fact that the atmospheric N deposition of other active N species(e.g.,ammonium-N and nitrate-N in rainfall and in aerosol, nitric acid gas) in the study region was also higher(Wang et al.2017;OuYang et al.2019),the NH3deposition combined with other reactive N deposition around the sources will result in N enrichment around the emission sources.The resulting ecological and environmental effects thus can not be ignored. For the farmland around the sources,atmospheric N deposition is an important source of N(Wang et al.2017),and thus needs to be considered in N nutrient management.For natural ecosystems such as woodlands and shrubs, large amounts of N deposition will bring many negative impacts on the environment,such as soil acidification,biodiversity reduction,weeds growing around farmland,and increasing soil N2O emissions(Liu et al.2011).Therefore,it is necessary to take measures to optimize the application of N fertilizer in farmlands,so as to reduce NH3emissions,and to alleviate the adverse environmental effects caused by NH3deposition.
5. Conclusions
This study measured the NH3concentrations at downwind sites within 100 m from a typical paddy region(about 0.6 ha)in the subtropical hilly region in southern China, and the NH3deposition in this downwind area was also estimated.There were high NH3concentrations at the downwind sites during the periods within 15 days after N fertilizer application. The concentrations of NH3at 0 m,20 m,50 m,and 100 m from the paddy fields in the downwind area were as much as 5.0–27 and 1.3–9.7 times those at the background site after applying basal fertilizer and topdressing fertilizer, respectively, and decreased exponentially with distance from the paddy fields. Excluding background NH3deposition, the total NH3deposition in the 100-m downwind direction in the early and late rice seasons accounted for 79% and 81%of the NH3emissions from the paddy fields,respectively.The results show that dry deposition of NH3around emission sources may be an important way to remove the NH3volatilized from croplands in this subtropical hilly area.
Disclosure statement
No potential conflict of interest was reported by the authors.
Funding
This research was supported by the National Natural Science Foundation of China [grant number 41771336], the National Key Research and Development Program of China[grant number 2016YFD0201204], and the Youth Innovation Promotion Association of the Chinese Academy of Sciences[grant number 2017418].
杂志排行

Atmospheric and Oceanic Science Letters的其它文章
- Are typhoon and marine eutrophication the possible missing sources of high dissolved organic nitrogen in wet deposition?
- Spatial and seasonal patterns of atmospheric nitrogen deposition in North China
- Impact of an accidental explosion in Tianjin Port on enhanced atmospheric nitrogen deposition over the Bohai Sea inferred from aerosol nitrate dual isotopes
- Atmospheric nitrogen deposition in Yangtze River Delta:insights gained from the nitrogen content and isotopic composition of the moss Haplocladium microphyllum
- Changes in PM2.5 sensitivity to NOx and NH3 emissions due to a large decrease in SO2 emissions from 2013 to 2018
- Comparisons of the effects of different drying methods on soil nitrogen fractions:Insights into emissions of reactive nitrogen gases(HONO and NO)