Spatial and seasonal patterns of atmospheric nitrogen deposition in North China
2020-10-09WANGZhnZHANGXiuyingLIULiCHENGMiomioXUJunfng
WANG Zhn,ZHANG Xiuying,LIU Li,CHENG Miomio n XU Junfng
aInternational Institute for Earth System Science,Nanjing University,Nanjing,China; bJiangsu Center for Collaborative Innovation in Geographical Information Resource Development and Application,Nanjing,China; cCollege of Earth and Environmental Sciences,Lanzhou University,Lanzhou,China; dState Key Laboratory of Environmental Criteria and Risk Assessment,Chinese Research Academy of Environmental Science,Beijing,China;eResearch Academy of Remote Sensing and Earth Sciences,Hangzhou Normal University,Hangzhou,China
ABSTRACT As one of the regions with intensive agriculture and rapid economic development in China,North China also has a high nitrogen (N) deposition. This study characterized the spatial pattern of N deposition in North China, combining the tropospheric columns from satellite measurements and the simulated profiles from an atmospheric chemistry transport model.The total N deposition fluxes ranged from 16.3 to 106.5 kg N ha−1 yr−1,with an average of 54.5 ± 17.2 kg N ha−1 yr−1.The high values were concentrated in urban and farmland areas,while low values were found in forests and grasslands with less human activities. Of the total N deposition, 36% was deposited via precipitation, 12% was deposited through dry particulate deposition, and the remaining 52%was comprised of dry gaseous deposition. For the seasonal variation of dry deposition, gaseous HNO3 and particulate NO3−were higher in winter and autumn,but lower in spring and summer.In contrast,gaseous NH3 and particulate NH4+were higher in spring and summer,but lower in winter and autumn.This is possibly caused by the seasonal differences in emission intensity between NOx and NH3 emission sources. The gaseous NO2 deposition did not show strong seasonal variation.The wet deposition was mainly affected by precipitation, with high values in summer and low values in winter.This research provides an objective spatial perspective and insight into the total N deposition in North China.
KEYWORDS North China;satellite;NH3;NO2;atmospheric chemistry transport model
1. Introduction
The global nitrogen (N) cycle has been accelerated by human activities through fertilizer production,fossil fuel combustion,and N-fixing legumes(Galloway et al.2008).With dramatic industrialization and urbanization,anthropogenic reactive N(NOx=NO+NO2,and NH3)emissions increased from 34 Tg N yr−1in 1860 to 109 Tg N yr−1in 2010 (Fowler et al. 2013). Recently, China has become one of the hotspots of N deposition on a global scale(Liu et al. 2013). Enhanced N deposition may pose a significant influence on sensitive ecosystems, such as N saturation, eutrophication, a loss of biodiversity, and soil acidification(Liu et al.2011).
North China comprises Beijing, Tianjin, Hebei,Henan, Shandong, and Shanxi provinces and is characterized by large population densities, intensive agriculture, and highly developed industries and transport systems. With the rapid development of the economy and agriculture, many studies have demonstrated high levels of N deposition and air pollution by particulate matter in this region (Pan et al. 2012; Xu et al. 2015).Pan et al. (2012) reported that the average total N deposition in North China at 10 sites was 60.6 ±19.6 kg N ha−1yr−1, with a range from 28.5 to 100.4 kg N ha−1yr−1. Xu et al. (2015) reported that the overall average total N deposition was 56.2 ± 14.8 kg N ha−1yr−1. However, due to the limited number and uneven distribution of monitoring sites, it is difficult to obtain the spatial distribution of N deposition and accurately evaluate the average N deposition through ground measurements alone. This study tries to expand the ground-based N deposition at monitoring sites to a regional scale.
Remote-sensing technology provides a new means to estimate N deposition on a regional scale due to its advantages of high spatial and temporal resolutions and has been used in environmental studies and to support emission control policies(Lu et al.2013;Chen,Feng,and Zhang 2017). However, satellite NH3and NO2measurements can only provide columns, without the vertical distributions of these columns (from the ground to the top of the atmosphere). Fortunately, detailed NH3and NO2profile information can be obtained from chemical transport models(CTMs)(Luo et al.2015).Thus,the total N deposition fluxes in North China can be estimated with an inferential model,based on the ground NO2and NH3concentrations estimated from tropospheric NO2and NH3columns from satellite instruments,the simulation of NO2and NH3profiles,and the dry deposition velocity(Vd).
Recently, Jia et al. (2016) estimated dry N deposition through a linear regression model between ground measurements and satellite NO2columns from the ozone monitoring instrument (OMI). However, the estimated NO3−deposition was much lower than the lowest ground measurements at Chinese Nationwide Nitrogen Deposition Monitoring Network sites since NO3−concentrations have no direct relationship with NO2columns(Liu et al.2017d).Nowlan et al.(2014)estimated the global NO2dry deposition flux through a calibration of simulated NO2deposition from the GEOS-Chem model by satellite observations.However,their study had no validation in China and produced results that were much lower than those reported by Jia et al. (2016). The present work uses an inferential model to generate maps of inorganic N deposition and then uses ground measurements to validate those results.Our aim is to obtain an overall insight into the spatial and seasonal variations of total N deposition based on the method mentioned above and to guide monitoring plans in the future in North China.
2. Data and methods
2.1. Data
The tropospheric NO2columns were retrieved from the OMI (http://www.temis.nl/airpollution/no2.html),with a spatial resolution of 0.125° × 0.125°. The tropospheric NH3columns were retrieved from IASI (http://www.ulb.ac.be/cpm/atmosphere.html), with a horizontal resolution of 0.25° × 0.25°. The NO2and NH3profiles were obtained using the Model for Ozone and Related Chemical Tracers, version 4(MOZART-4), CTM. The land-use map was obtained from http://www.globallandcover.com. The monthly precipitation data in 2012 were obtained from the China Meteorological Administration, with a spatial resolution of 0.5° × 0.5°. The monthly Vdover China was calculated based on the CMAQ CTM, version 4.5.1, and the MM5 mesoscale meteorological model, version 3.7 (Chen et al. 2007). More detailed data information is provided in Section S1 of the supplementary material.
2.2. Methods
For dry deposition, a regression model was established by using ground NO2and NH3concentrations and monitoring data to obtain the ground gaseous HNO3and particulate NO3−and NH4+concentrations, which cannot be directly observed by satellites. Then, the five components of dry deposition could be calculated using the corresponding ground concentrations and Vd. The Vdcan be simulated using the big-leaf model, which has been widely applied in atmospheric CTMs (Pan et al. 2012; Xu et al. 2015). The steps of this calculation are presented in Figure S1(a).
For wet deposition, the contribution of NO2to the dissolved NO3−-N in precipitation is very limited because NO2is not directly very soluble. Related studies have shown that most of the wet NO3−-N in precipitation originates from HNO3and aerosol nitrate(NO3−) (Ervens 2015; Sutton et al. 2011). First, we retrieved the HNO3and NO3−columns by using OMI NO2columns and the relationship of NO2, HNO3, and NO3−columns from MOZART-4. Then, a statistical model was established based on the monitoring of wet nitrate deposition, the HNO3and NO3−columns,and the precipitation amount. Finally, the monthly wet nitrate deposition was estimated via the constructed model. Wet ammonium deposition was estimated by a similar method. The steps of this calculation are presented in Figure S1(b).
The inferential model established in this study is the same as that employed in Liu et al. (2017a, 2017b,2017c, 2017d), and Zhang et al. (2017). More detailed methodological information is provided in Section S2 of the supplementary material.
3. Results and discussion
3.1. Accuracy assessment of the estimated N deposition
We used 17 ground-based monitoring sites to assess the accuracy of the estimated N deposition flux in North China (Luo et al. 2013; Xu et al. 2015). The measured annual N deposition ranged from 34.4 to 93.3 kg N ha−1yr−1, with an average of 62.1 kg N ha−1yr−1. The estimated annual N deposition ranged from 38.4 to 91.7 kg N ha−1yr−1,with an average of 67.8 kg N ha−1yr−1.Both the ranges and averages of the measured and estimated values were close. The correlation between the estimated and measured annual N deposition was 0.86(p<0.01),with a mean absolute error of 0.15(Figure 1(a)).All of this indicated that the constructed model could be used to estimate the N deposition on a regional scale.
3.2. Spatial distribution of N species deposition
The spatial distribution of N deposition is shown in Figure 1(b). The N deposition fluxes ranged from 16.3 to 106.5 kg N ha−1yr−1,with an average of 54.5 ± 17.2 kg N ha−1yr−1.This result is very close to the average total N deposition of 56.2 ± 14.8 kg N ha−1yr−1based on 13 sites in North China (Xu et al. 2015). Comparing with Figure S2, we can see that the areas with high N deposition(>50 kg N ha−1yr−1)were highly consistent with urban and builtup areas and farmland,which were the main emission sources of NOxand NH3.In addition,the areas with highest N deposition(>80 kg N ha−1yr−1)were dotted(such as the megacities of Beijing and Jinan)or zonal (such as the city belt from Shijiazhuang to Zhengzhou); the lowest N deposition areas (<40 kg N ha−1yr−1) were mostly concentrated in forests and grasslands (Figure S2). This spatial distribution of N deposition is consistent with the conclusions reported by Xu et al.(2018)based on ground monitoring;that is,the total N deposition in urban areas is higher than that in rural areas, and that in rural areas is higher than at background sites.
The average dry N deposition in North China was 34.8 ± 13.9 kg N ha−1yr−1(Figure S3(h)). This result is very close to the ground-monitoring results of 36.7 and 31.9 kg N ha−1yr−1reported by Pan et al. (2012)and Xu et al. (2015), respectively (Table S1). Among the components of dry deposition, the spatial distributions ofgHNO3,gNO2,pNO3−(Figure S3(a, c, e)) deposition are similar and highly consistent with that of NO3−-N deposition (Figure S3(k)); plus, the spatial distributions ofgNH3andpNH4+(Figure S3(b, d)) deposition are also similar and consistent with that of NH4+-N deposition (Figure S3(j)). The similarity and consistency are determined by the spatial pattern of NOxand NH3emission sources from the Emission Database for Global Atmospheric Research (https://edgar.jrc.ec.europa.eu/). Generally, NOxemissions come from power plants, industry, and transportation, which are concentrated in urban and suburban areas (Wang et al. 2012). NH3emissions mainly come from N fertilizer volatilization of farmland and livestock production, which is concentrated in rural areas far from urban areas (Galloway et al. 2004; Shen et al. 2018).
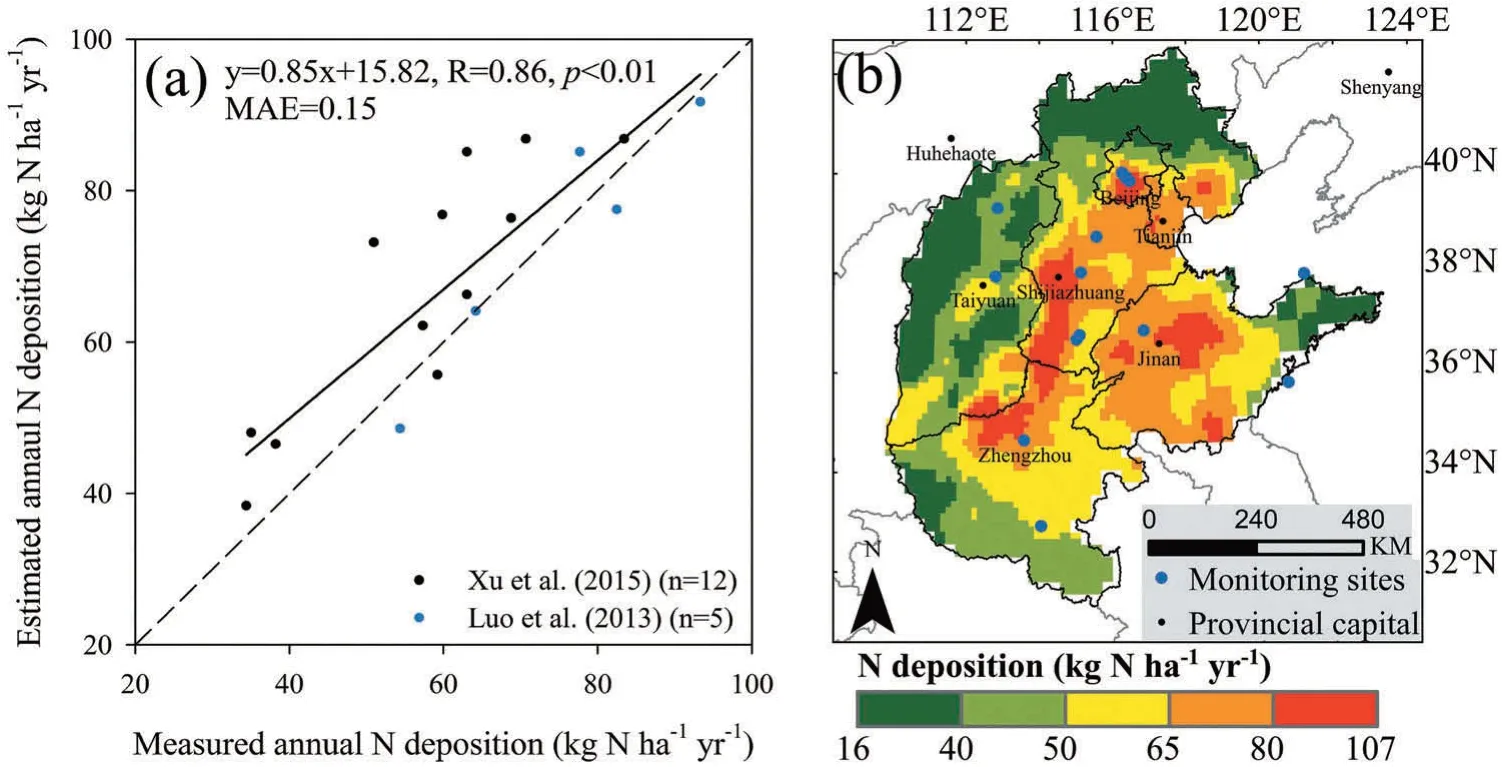
Figure 1.(a)Comparison between the measured and estimated annual N deposition and(b)the spatial distribution of N deposition.
The average wet N deposition in North China was 19.7 ± 4.1 kg N ha−1yr−1(Figure S3(i)). This result is comparable to the ground-monitoring results of 23.9 and 24.6 kg N ha−1yr−1reported by Pan et al. (2012)and Xu et al.(2015), respectively(Table S1). Among the components of wet deposition,the spatial distributions ofwNH4+andwNO3−deposition (Figure S3(f, g)) are not completely consistent with those of NH4+-N and NO3−-N deposition (Figure S3(j, k)). The main reason is that the spatial distribution of wet deposition is affected by emission sources and precipitation. Pan et al. (2012)reported a positive relationship between monthly wet N deposition and precipitation.The areas in this region,where the annual rainfall (Figure S3(l)) is higher than 580 mm (average precipitation), are mainly near the eastern coast. This corresponds to the high wet N deposition area (except for eastern Shangdong Province) (Figure S3(i)). The main reason for the low wet N deposition of eastern Shandong Province may be the low emission sources.
Due to the different emission sources of NOxand NH3,the spatial patterns of atmospheric NH4+-N deposition and NO3−-N deposition are different. The primary sources for NH3are intensive agricultural production,such as domestic animals and N fertilizer application(Galloway et al. 2004). The high NH4+-N deposition was mainly scattered in agricultural areas in the suburbs of cities, such as the west of Jinan, northwest of Zhengzhou,and south of Beijing(Figure S3(j)).However,NOxcomes mostly from industry, power plants, and transportation (Wang et al. 2012). The high NO3−-N deposition was mainly distributed in points (Beijing and Tianjin),in a triangular area(Jinan and its two eastern cities), and along a city belt (from Shijiazhuang to Zhengzhou) (Figure S3(k)). Interestingly, the spatial distribution of NO3−-N(Figure S3(k))was very similar to that of total N deposition(Figure 1(b)),mainly because NO3−-N dominates in this region, accounting for 57% of the total N deposition.
3.3. Seasonal variation of dry and wet N deposition
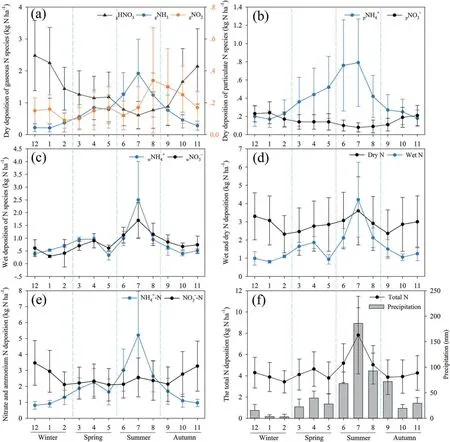
Figure 2.Seasonal variations of the atmospheric deposition flux of N species in North China.
The monthly dry N deposition flux ranged from 0.21 to 1.92 kg N ha−1/month forgNH3and from 0.17 to 0.79 kg N ha−1/month forpNH4+(Figure 2(a, b)). The seasonal variation ofgNH3andpNH4+deposition is in agreement with NH3emissions (Liu et al. 2017d), for which the highest concentrations occurred in summer, followed by spring, autumn, and winter. The dominant cropping system in this region is a winter wheat–summer maize rotation. Farmers usually apply N fertilizers (mainly as urea and ammonium bicarbonate)in March–April,June–August, and October (Xu et al. 2015). In addition, high temperatures in summer will favor ammonia volatilization from fertilizers,animal waste,city garbage,farmers’toilets,and vehicles(Pan et al.2013).Therefore,thegNH3andpNH4+deposition in summer and spring is significantly higher than that in autumn and winter.However,a previous study showed that thepNH4+deposition flux was higher in winter due to high NOxand SO2concentrations caused by the formation of secondary ammonium aerosols(Shen et al.2011).This difference indicates thatpNH4+deposition is dependent on variable emissions, deposition velocity, and meteorological conditions.
The monthly dry N deposition flux ranged from 0.61 to 2.48 kg N ha−1/month forgHNO3,from 0.09 to 0.34 kg N ha−1/month forgNO2,and from 0.08 to 0.24 kg N ha−1/month forpNO3−(Figure 2(a,b)).ThegHNO3andpNO3−showed their highest values in winter, and then in autumn and spring, with minimum values in summer.The consumption of coal or wood for heating and cooking in this region can lead to large NOxemissions, subsequently causing high concentrations of NOxin winter(Yang et al. 2010) and further contributing topNO3−(Shen et al. 2013); then, HNO3is removed by precipitation (Liu, Zhang, and Lu 2016). ThegNO2deposition showed no obvious seasonal variation. Generally, high temperatures in summer can increase the transformation ofgNO2togHNO3(Lamsal et al. 2008). Both the emissions and atmospheric conditions determine the seasonal variations of NO2concentrations. In addition,the seasonal variations in NO2deposition velocities are different under different land surface conditions(Nowak,Crane, and Stevens 2006). All the above factors determine the seasonal variations ofgNO2deposition. The variations of monthlygNO2deposition are in agreement with the findings of Zhang et al. (2017), who showed that the peak value occurred in August and the lowest value in February.
The monthly wet N deposition flux ranged from 0.33 to 2.50 kg N ha−1/month forwNH4+and from 0.29 to 1.70 kg N ha−1/month forwNO3−(Figure 2(c)). The seasonal variations of those two N species were in agreement with the variations of precipitation,which showed that the highest value occurred in summer. ThewNH4+andwNO3−in summer accounted for 45%and 41%of the annualwNH4+andwNO3−deposition, respectively.Correspondingly, precipitation in summer (Figure 2(f))accounted for 60% of the annual precipitation in this region. This indicates that precipitation is an influential factor for the seasonal variations of wet N deposition(Pan et al. 2012). Of course, wet N deposition is also related to the seasonal variations of NOxand NH3emissions. For example, thewNH4+deposition flux (2.50 kg N ha−1/month) in July was significantly higher than thewNO3−deposition flux (1.70 kg N ha−1/month), which is closely related to ammonia volatilization from N fertilizers.
The monthly dry and wet N deposition flux ranged from 2.30 to 3.57 kg N ha−1/month for dry N deposition and from 0.82 to 4.20 kg N ha−1/month for wet N deposition(Figure 2(d)).Overall,the monthly dry N deposition was higher than the monthly wet N deposition (except for July), indicating that dry deposition (64% of the annual N deposition) was the dominant form of N deposition in this region. The proportion is slightly higher than the results of 61% reported by Pan et al.(2012)and 57%reported by Xu et al.(2015).
3.4. Seasonal variation of NH4+-N and NO3−-N deposition
The monthly ammonium (sum ofgNH3,pNH4+, andwNH4+) and nitrate (sum ofgNO2,gHNO3,pNO3−, andwNO3−) N deposition flux ranged from 0.81 to 5.21 kg N ha−1/month for NH4+-N deposition and from 2.10 to 3.47 kg N ha−1/month for NO3−-N deposition(Figure 2(e)). In general, the monthly NO3−-N deposition was higher than the monthly NH4+-N deposition(except for summer), indicating that NO3−-N deposition (57% of the annual N deposition) is the main form of N deposition in this region. The NH4+-N deposition was higher in spring and summer and lower in autumn and winter. On the contrary, the NO3−-N deposition was higher in autumn and winter and lower in spring and summer. This is consistent with seasonal variations in the sources and intensity of NOxand ammonia emissions. Ammonia mainly comes from agricultural fertilizer ammonia volatilization (usually applied in spring and summer) (Shen et al. 2009), in addition to industry, power plants,and transportation, and domestic heating, which are also important sources of NOxemissions (Shen et al.2013).
The monthly N deposition flux ranged from 3.41 to 7.77 kg N ha−1/month (Figure 2(f)). Comparing with Figure 2(e), we can see that the variational trend of N deposition in spring and summer was consistent with that of NH4+-N deposition, while the variational trend of N deposition in winter and autumn was consistent with that of NO3−-N deposition. This is closely related to the sources and intensity of NOxand ammonia emissions mentioned above. The results show that NH4+-N deposition dominates in summer,while NO3–N deposition dominates in other seasons in this region. The extreme points of monthly N deposition fluxes are December, April, and July, respectively,and the NO3−-N/NH4+-N deposition flux ratio in December, April, and July is 4.3, 1.0, and 0.5, respectively. It also reflects the seasonal variation trend of NOxand NH3emissions.
4. Conclusions
This study estimates the total N deposition flux in North China to range from 16.3 to 106.5 kg N ha−1yr−1,with an average of 54.5 ± 17.2 kg N ha−1yr−1.High N deposition fluxes are mainly concentrated in urban and agricultural land areas, especially in urban and built-up land, while low N deposition fluxes are mainly found in forest and grassland areas,which are less affected by human activities. ThegHNO3andpNO3−deposition shows a clear seasonal variation, with high deposition occurring in winter and spring and low deposition appearing in summer and autumn.On the contrary,gNH3andpNH4+show high deposition in summer and autumn and low deposition in winter and spring. ThegNO2deposition did not show a strong seasonal pattern, with high values from August to October and low ones in February.The seasonal variations ofwNH4+andwNO3−deposition are significantly influenced by precipitation,and the maximum values appear in autumn (especially in July). The maximum value of total N deposition was found to occur in summer, while the difference in N deposition between winter,spring,and autumn was not significant.
Satellite-retrieved N deposition is helpful to assess the status of N deposition without ground measurements,and the results presented here provide a basis for the formulation of a satellite-based N deposition monitoring program in China in the future.In addition,the generated spatial and seasonal patterns of atmospheric N deposition in North China provide basic information for evaluating the influence of N enrichment on regional biogeochemical cycles, such as in forests, grasslands, and farmland ecosystems.However,there are uncertainties in our inference model,such as the input data,the CTM,the Vd,and the constructed model itself. Therefore, in addition to overcoming these existing difficulties, future research should focus on satellite inversions of N deposition with higher spatial and temporal resolutions.Such data could be used to identify hotspots of N deposition and provide powerful means for government supervision.
Acknowledgments
The authors acknowledge the use of OMI NO2columns(http://www.temis.nl/) and IASI NH3columns (http://www.ulb.ac.be/cpm/atmosphere.html),NO2and NH3profiles from MOZART-4(http://www.acd.ucar.edu/wrf-chem/mozart.shtml), and the land-use map of China(http://www.globallandcover.com).
Data availability
The data used are listed in the tables and supplementary material.All other data are archived at Nanjing University and may be obtained from X. Y. Zhang (lzhxy77@163.com or zhangxy@nju.edu.cn)upon request.
Disclosure statement
No potential conflict of interest was reported by the authors.
Funding
This study was supported by the National Natural Science Foundation of China[grant numbers 41471343 and 41601457].
杂志排行

Atmospheric and Oceanic Science Letters的其它文章
- Are typhoon and marine eutrophication the possible missing sources of high dissolved organic nitrogen in wet deposition?
- Impact of an accidental explosion in Tianjin Port on enhanced atmospheric nitrogen deposition over the Bohai Sea inferred from aerosol nitrate dual isotopes
- Atmospheric nitrogen deposition in Yangtze River Delta:insights gained from the nitrogen content and isotopic composition of the moss Haplocladium microphyllum
- Changes in PM2.5 sensitivity to NOx and NH3 emissions due to a large decrease in SO2 emissions from 2013 to 2018
- Dry deposition of ammonia around paddy fields in the subtropical hilly area in southern China
- Comparisons of the effects of different drying methods on soil nitrogen fractions:Insights into emissions of reactive nitrogen gases(HONO and NO)