Changes in PM2.5 sensitivity to NOx and NH3 emissions due to a large decrease in SO2 emissions from 2013 to 2018
2020-10-09XUGungyiZHANGQinqinYAOYuZHANGXingying
XU Gungyi,ZHANG Qinqin,YAO Yu n ZHANG Xingying
aShenzhen Research Academy of Environmental Science,Shenzhen,China; bNational Satellite Meteorological Center,China Meteorology Administration,Beijing,China; cState Environmental Protection Key Laboratory of Sources and Control of Air Pollution Complex,Beijing,China;dDepartment of Atmospheric Sciences,University of Illinois at Urbana Champaign,Urbana,IL,USA
ABSTRACT The authors evaluated and compared the behavior of PM2.5 with respect to NOx and NH3 emission changes in high(the year 2013)and low(the year 2018)SO2 emission cases.Two groups of simulations were conducted based on anthropogenic emissions from China in 2013 and 2018,respectively.In each group of simulations,a respective 25%reduction in NOx and NH3 emissions were assumed.A sensitivity factor(β)was defined as the relative change in PM2.5 concentration due to 1%change in NOx or NH3 emissions.In the high SO2 emissions case, PM2.5 was more sensitive to NH3 (0.31) emissions change than NOx(0.21).Due to the significant decrease in SO2 emissions from the high to low SO2 emissions case,the sensitivity of PM2.5 to NOx increased to 0.33,while its sensitivity to NH3 decreased to 0.22.The result implies that now and in the future,PM2.5 is/will be less sensitive to NH3 emissions change,while NOx emissions control is more effective in reducing the surface PM2.5 concentration.Seasonally,in the low SO2 emissions case,the sensitivities of PM2.5 to NOx and NH3 in winter were higher than those in summer,indicating that to deal with severe winter haze more attention should be paid to the emissions control of inorganic PM2.5 precursors,especially NOx.
KEYWORDS SO2 emissions;PM2.5 sensitivity to NOx;PM2.5 sensitivity to NH3;emissions control strategy
1. Introduction
Secondary inorganic aerosols(sulfate,nitrate,and ammonium; simplified to SNA) are important constituents of PM2.5, occupying up to a half of the total PM2.5mass(Pan et al. 2016; Wang et al. 2014). Sulfur dioxide (SO2),nitrogen oxides(NOx),and ammonia(NH3)are precursors of SNA.In the atmosphere, SO2and NOxare oxidized to sulfuric acid(H2SO4)and nitric acid(HNO3),and then they are neutralized by NH3. NH3prefers to form ammonium sulfate((NH4)2SO4)first for its stability.Ammonium nitrate(NH4NO3) is semi-volatile, and the low temperature and high humidity are favorable for NH4NO3staying in the condensation state. Emission changes of SO2, NOx, and NH3will lead to changes in SNA concentration and then PM2.5concentration.
The sensitivity of PM2.5to SO2, NOx, and NH3emission changes is estimated to evaluate emission control strategies and to design effective emission control policies(Wang et al. 2013; Zhang et al. 2019, 2015b). Wang et al. (2013)reported that from 2000 to 2006, a large increase in SO2(60%)and NOx(80%)emissions resulted in a 60%lifting of the SNA concentration over China.Since then,from 2006 to 2015, changes in SO2(−16%) and NOx(+16%) emissions have led to an overall decrease in the surface SNA concentration, while an increase in NH3emissions has offset the benefit of SO2and NOxemissions control(Wang et al.2013).Fu et al. (2017) and Wang et al. (2013) pointed out the necessity of NOxand NH3emissions control for the high sensitivity of PM2.5with respect to NOxand NH3emissions change. However, these studies were conducted at a relatively high SO2emissions level. From 2013 through 2017, observations from satellites have indicated a significant decrease in the SO2column over China(Figure S1),and SO2emissions from China were estimated to have decreased by 59% (Zheng et al. 2018). Considering the thermodynamic equilibrium among H2SO4, HNO3, and NH3,a sharp reduction in SO2emissions will alter the sensitivity of the PM2.5response to NOxand NH3emission changes(Wang et al.2013).
The purpose of this paper is to assess the influence of the large SO2emissions reduction from 2013 to 2018 on the sensitivity of PM2.5to NOxand NH3emissions control and make recommendations for future emission control policies with respect to PM2.5precursors. We introduce the model and simulation scenarios in section 2.In section 3,we discuss the sensitivity of PM2.5to NOxand NH3emission changes at different SO2emission levels.Concluding remarks are given in section 4.
2. Model and simulation
2.1. Model description
We used the GEOS-Chem global chemical transport model (http://www.geos-chem.org), v11-1. The global version with a horizontal resolution of 2° × 2.5° was employed,driven by the MERRA-2 meteorology field. All simulations in this study used meteorology fields from December 2012 to December 2013, and the first month was for spin-up. The aerosol species considered in the GEOS-Chem model include SNA aerosol, carbonaceous aerosol, dust aerosol, sea salt, and marine POA (primary organic aerosols).SNA aerosol simulation coupled to gasphase chemistry was originally described by Park et al.(2004). SNA thermodynamics are calculated using the module of ISORROPIA II, developed by Fountoukis and Nenes (2007). The default anthropogenic emissions in GEOS-Chem are from EDGAR v4.2 (EC-JRC/PBL, http://edgar.jrc.ec.europa.eu), and NH3emissions are from the MASAGE inventory developed by Paulot et al.(2014).We overwrote the anthropogenic emissions in East Asia with the MIX inventory(Li et al.2017).
GEOS-Chem has been used to simulate PM2.5and its constituents in China,and it has been proven to have good skill in simulating the spatiotemporal distribution and concentration level of aerosols. Zhang et al. (2015a) reported a spatial correlation coefficient (R) of 0.65 between modeled and simulated PM2.5in China,and Zhang et al.(2018)reported an R of 0.85 for the day-to-day variation of PM2.5.Both found an underestimation of ~40%in the PM2.5concentration simulated by the model,but the bias was within a reasonable performance level for chemical models to simulate PM2.5(Eder and Yu 2006; Stewart et al. 2019).GEOS-Chem also performs well in simulating SNA aerosols.Wang et al. (2013) and Zhang et al. (2015b) reported a good ability of GEOS-Chem to simulate SO42−at weekly,monthly, and seasonal scales. However, the model was found to underpredict the SO42−concentration during severe haze days for a large percentage of them(Wang et al. 2014). It was improved through adding a heterogeneous oxidation procedure of SO2to H2SO4in the model, which was included in the simulations carried out in this work.NO3−and NH4+overestimation is a typical problem of chemical models (Stewart et al. 2019; Wang et al.2013).Heald et al.(2012)recommended to reduce the HNO3concentration when it is read into the SNA aerosol chemical module in the model,which was also included in this study.
2.2 Simulation scenarios
Two groups of simulations were conducted based on the emissions in the years 2013 and 2018,which are referred to as the high and low SO2emission cases,respectively.We assumed a separate 25% decrease in NOxand NH3emissions from China and calculated the sensitivity of PM2.5to them.
As mentioned,the default MIX inventory in GEOS-Chem is for the year 2010, and we scaled it up to obtain the emissions for 2013 and 2018. According to Zheng et al.(2018),from 2010 to 2013,the emissions of the main PM2.5precursors, i.e. SO2, NOx, non-methane volatile organic carbon(NMVOC),NH3,elemental carbon(EC),and organic carbon(OC),changed by −9%,5%,9%,4%,1%,and −3%,respectively.After the Air Pollution Prevention and Control Action Plan was delivered in 2013,emissions of the above species dropped largely from 2013 through 2017, especially for SO2. The relative emissions change of the six precursors were −59% for SO2, −21% for NOx, 2% for NMVOC,−3%for NH3,−28%for EC,and −32%for OC.We assumed emission changes were linear from 2010 to 2013 and from 2013 to 2017,and then performed a linear extrapolation for the year 2018.The scale factors are displayed in Figure 1.
3. Sensitivity of PM2.5 to NOx and NH3 emissions at different SO2 emission levels and in different seasons
Here, we discuss the sensitivity of PM2.5with respect to NOxand NH3emissions control in different SO2emission cases and different seasons. We defined an efficiency factor (β) following the work of Zhang et al. (2019),Zhang et al.(2015b)to quantify and compare the PM2.5sensitivities to NOxemissions change. β is defined as follows:
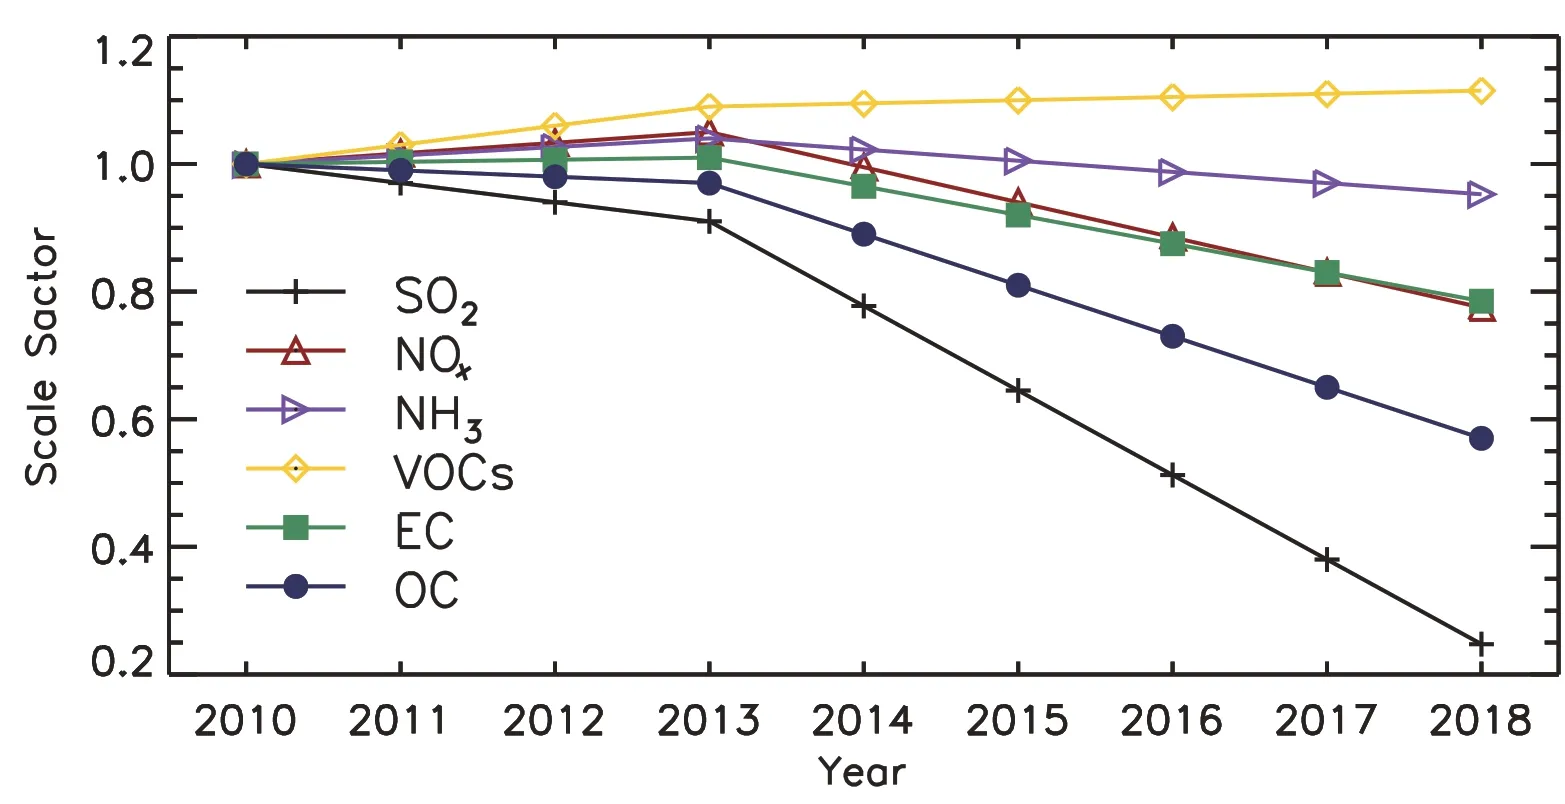
Figure 1.Emission scale factors based on the year 2010 for the main PM2.5 precursors.
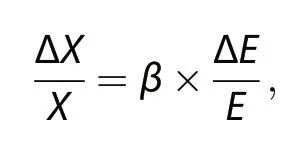
Figure 2 shows the annual mean PM2.5distribution in the high and low SO2emission cases and the difference between them.The PM2.5concentration was much higher in the east than in the northeast or west,for both the high and low SO2emission cases.Therefore,we focused on the east of China (22°–42°N, 102°–122°E) where the PM2.5concentrations were highest.The annual mean PM2.5concentration over East China decreased by 10.3 μg m−3(19.6%)due to the emissions reduction from the high to low SO2emissions case, 55% of which was driven by a reduction in the sulfate concentration. Seasonally, the reduction in the PM2.5concentration was lower in winter(January,February,and December)than in summer(June,July,and August).Relatively,the PM2.5reduction rate was 17.8%in winter,which was lower than the annual mean level; and it was 28.2% in summer, which was much higher than the annual mean rate of decrease.This indicates that the formation of aerosols is more easily affected by the emissions of precursors in summer.
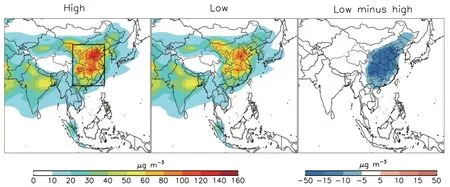
Figure 2.Annual mean PM2.5 concentrations in the high and low SO2 emission cases,and their difference.The black box denotes the region of interest.
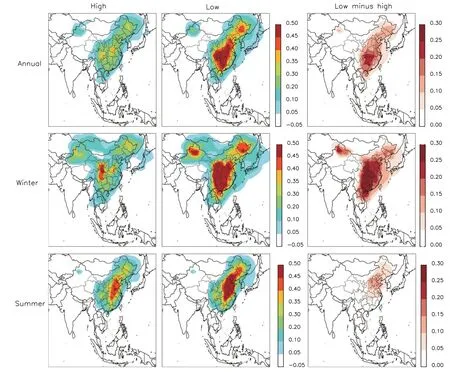
Figure 3.PM2.5 sensitivity to NOx emissions change in the high(left-hand column)and low(middle column)SO2 emission cases,and their difference(right-hand column).The rows show the annual(top),winter(middle),and summer(bottom)mean.
As shown in Figure 3,in the high SO2emissions case,the annual mean PM2.5sensitivity with respect to NOxemissions reduction (β) was 0.21 over the region of interest.Seasonally,β in winter(0.22)and summer(0.23)was close to that of the annual mean.There was a sharp increase in β(53.3%) from the high to low SO2emissions case at the annual mean level. In other words, under low SO2emissions,the behavior of PM2.5becomes more sensitive to NOxemissions change.This indicates that now and in the future, NOxemissions control is/will be more effective in reducing the PM2.5concentration. The increase in β from the high to low SO2emissions case varied from season to season. For the East China regional mean, β increased by more than 80% in winter, while in summer the rate of increase was approximately 20%. Different to that in the high SO2emissions case, the wintertime β was much higher than the summertime one in the low SO2emissions case.In winter,a reduction in SO2emissions would release more free NH3into the atmosphere,making NH4NO3more sensitive to NOxemissions change.This explains the large increase in β in winter.The results imply that now and in the future,NOxemissions control is/will be more effective in dealing with severe winter haze than in previous years.
The behavior of PM2.5with respect to NH3emissions control is displayed in Figure 4.In the high SO2emissions case,PM2.5was 47.6%more sensitive to NH3than to NOxemissions change, with an annual mean β of 0.31.Seasonally,β was higher in winter(0.43)than in summer(0.24), in contrast to that in the NOxemissions control condition. The sensitivity of PM2.5to NH3emissions change fell by 30.1%from the high to low SO2emissions case, and the decrease was more significant in winter(32.6%)than in summer(20.7%).Notably,in the low SO2emissions case,the sensitivity of PM2.5to NH3emissions change(0.22)was 32.7%lower than it was to NOxemissions change. The result indicates that (1) when SO2emissions decrease, more free NH3is released to the atmosphere,making NH3emissions control less effective at reducing the surface PM2.5concentration;and(2)now and in the future, it is/will be more effective to reduce the PM2.5concentration by controlling NOxrather than NH3emissions.
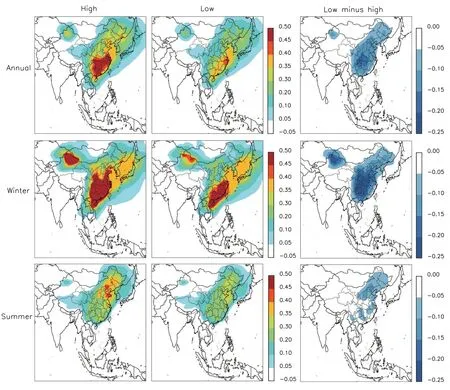
Figure 4.PM2.5 sensitivity to NH3 emissions change in the high(left-hand column)and low(middle column)SO2 emission cases,and their difference(right-hand column).The rows show the annual(top),winter(middle),and summer(bottom)mean.
4. Conclusion
The reduction in emissions of the precursors of PM2.5from 2013 to 2018 resulted in a 19.6% decrease in the surface PM2.5concentration over East China (22°–42°N,102°–122°E),most of which was driven by the significant decrease in the sulfate concentration. The substantial decrease in SO2emissions and the sulfate concentration were expected to have altered the sensitivity of PM2.5to NOxand NH3emission changes.Therefore,we conducted model sensitivity studies to assess the changes in PM2.5sensitivities to NOxand NH3emission changes owing to the large decrease in SO2emissions from 2013 to 2018.
In the high SO2emissions case(the year 2013),PM2.5was 47.6%more sensitive to NH3emissions change than NOx,which was mostly driven by winter.From the high to low SO2emissions case,the PM2.5sensitivity factor(β)for NH3decreased by 30.1%, while for NOxit increased by 53.3%,and the PM2.5sensitivity was 48.6%higher to NOxthan NH3.Seasonally,in the low SO2emissions case,the PM2.5sensitivities to both NOxand NH3were higher in winter than in summer.
Based on the results of this work,we conclude that now and in the future,the behavior of PM2.5is/will become less sensitive to NH3emission changes, while NOxemissions control is more effective at reducing the surface PM2.5concentration,especially in winter.
Disclosure Statement
No potential conflict of interest was reported by the authors.
Funding
This work was supported by the National Natural Science Foundation of China[grant number 41805098].
杂志排行

Atmospheric and Oceanic Science Letters的其它文章
- Are typhoon and marine eutrophication the possible missing sources of high dissolved organic nitrogen in wet deposition?
- Spatial and seasonal patterns of atmospheric nitrogen deposition in North China
- Impact of an accidental explosion in Tianjin Port on enhanced atmospheric nitrogen deposition over the Bohai Sea inferred from aerosol nitrate dual isotopes
- Atmospheric nitrogen deposition in Yangtze River Delta:insights gained from the nitrogen content and isotopic composition of the moss Haplocladium microphyllum
- Dry deposition of ammonia around paddy fields in the subtropical hilly area in southern China
- Comparisons of the effects of different drying methods on soil nitrogen fractions:Insights into emissions of reactive nitrogen gases(HONO and NO)