Comparisons of the effects of different drying methods on soil nitrogen fractions:Insights into emissions of reactive nitrogen gases(HONO and NO)
2020-10-09WUDinminDENGLinlinLIUYnzhuoXIDiZOUHuilnWANGRuhiSHAZhiminPANYupnHOULijunnLIUMin
WU Dinmin,DENG Lin lin,LIU Ynzhuo,XI Di,ZOU Huiln,WANG Ruhi,SHA Zhimin,PAN Yupn,HOU Lijunn LIU Min
aKey Laboratory of Geographic Information Sciences,Ministry of Education,School of Geographic Sciences,East China Normal University,Shanghai,China; bInstitute of Eco-Chongming,Shanghai,China; cState Key Laboratory of Soil and Sustainable Agriculture,Institute of Soil Science,Chinese Academy of Sciences,Nanjing,China; dSchool of Agriculture and Biology,Shanghai Jiao Tong University,Shanghai,China;eState Key Laboratory of Atmospheric Boundary Layer Physics and Atmospheric Chemistry,Institute of Atmospheric Physics,Chinese Academy of Sciences,Beijing,China; fState Key Laboratory of Estuarine and Coastal Research,East China Normal University,Shanghai,China
ABSTRACT Reactive nitrogen(Nr)emission from soils,e.g.,nitrous acid(HONO)and nitric oxide(NO),is a key process of the global nitrogen(N)cycle and has significant implications for atmospheric chemistry.To understand the underlying mechanisms of soil Nr emissions, air-dried or oven-dried soils are commonly used in the laboratory. To date, few studies have compared the effects of different drying methods on soil Nr gas fluxes and N fractions.Here,the authors studied soil water content,pH, (in)organic N content, and Nr gas fluxes of air-dried, freeze-dried, oven-dried, and fresh soils from different land-use types. The results showed that the soil pH of air-dried and oven-dried samples was significantly lower compared with fresh soil from farmland and grassland,but higher compared with forest soil. The difference in soil pH between freeze-dried and fresh soil (mean ±standard deviation: 0.52 ±0.31) was the lowest. In general, all drying methods increased the soil NH4+-N, NO3−-N, and dissolved organic N contents compared with fresh soil (P < 0.05). The maximum HONO and NO flux and total emissions during a full wetting–drying cycle of fresh soil were also increased by air-drying and oven-drying (P <0.001), but comparable with freeze-dried soil(P > 0.2).In conclusion,all drying methods should be considered for use in studies on the land–atmosphere interface and biogeochemical N cycling,whereas the freeze-drying method might be better for studies involving the measurement of soil Nr gas fluxes.
KEYWORDS Freeze-dried;nitrogen cycling;NOx;soil pH;gas flux
1. Introduction
Soil nitrogen (N) cycling strongly affects Earth’s atmosphere through the release of reactive nitrogen (Nr)gases, including ammonia, nitrous acid (HONO), nitric oxide (NO), and nitrogen dioxide (NO2) (Oswald et al.2013; Schlesinger and Hartley 1992).The contribution of HONO photolysis to OH radicals can be up to 80%,which directly affects the regional and global atmospheric chemistry (Li et al. 2012). Soil HONO and NO emissions are driven by nitrification and denitrification processes,and have been found to be related with soil pH,inorganic N content(e.g.,NH4+-N, NO2−-N, NO3−-N),and microbiological processes(Donaldson,Bish,and Raff2014;Oswald et al.2013;Su et al.2011;Wu et al.2019).The turnover of soil N could significantly affect the rate of release of Nrgases (Scharko et al. 2015). Microbial biomass nitrogen(MBN) can reflect the mineralization ability of soil microbes (Jenkinson and Parry 1989), and can also be used as a replenishment source for soil N(Shen,Pruden,and Jenkinson 1984). Therefore, quantifying soil Nrgas fluxes and (in)organic N content are crucial towards a comprehensive understanding of atmospheric chemistry and biogeochemical N cycling.
Although more and more field campaigns are being conducted to measure soil HONO and NO fluxes(Liu et al.2010;Tang et al.2019;van Dijk et al.2002;Xue et al.2019),it is still necessary to explore the mechanisms and controlling factors of soil HONO and NO emissions through simulation experiments in the laboratory. Field soil samples are usually sieved and dried before conducting soil HONO and NO flux measurements in laboratory conditions(Oswald et al.2013;Wu et al.2019),while fresh soil samples are normally used for soil inorganic N and MBN analysis.For long-term storage,soil samples are often airdried or oven-dried, which are then used to study soil N fractions and other physiochemical properties (Blake et al. 1999; Cassman and Munns 1980; Vance, Brookes,and Jenkinson 1987). Another drying method, freezedrying, was also introduced for measuring soil N mineralization(Mack 1963;Stahr et al.2018).
Soil-drying processes can significantly affect N fractions and mineralization(Lin,Muehling,and Sattelmacher 1997;Scherer, Werner, and Rossbach 1992). Lin, Muehling, and Sattelmacher (1997) showed that soil organic N was significantly increased with drying temperature, but not for NH4+-N and NO3−-N. The explanation was the death of microbes at higher temperatures and the chemical oxidation of soil N. However, Scherer, Werner, and Rossbach(1992) showed that soil NH4+-N and organic N were significantly increased at a drying temperature of 105°C compared with field-fresh soil,while freezing/thawing resulted in higher soil NO3−-N content. Nevertheless, the drying temperature is recommended to be below 40°C(van Erp,Houba,and Beusichem 2001).Soil drying also changes the content of exchangeable ions(Blake et al.2000)and the pH of saturated soil(Ding et al.2019;Nielsen et al.2017),and tends to accelerate N mineralization (Haney et al. 2004;Mikha, Rice, and Milliken 2005). However, few studies have compared the effects of different drying methods on soil Nrgas fluxes and biogeochemical N cycling(Bartlett and James 1980).
In this study,we aim to(1)study the difference in soil HONO,NO,and NO2emissions,soil N fractions and pH in air-dried,freeze-dried,oven-dried,and fresh samples,and(2)identify the best drying approach to treat soil samples.
2. Materials and methods
2.1 Soil sampling
Soil samples were collected in September 2018 in Shanghai, representing farmland, forest, and grassland,separately.More detailed information is provided in the supplementary material (Text S1). A stainless-steel shovel was used to collect soil samples at 0–5 cm. At least three sampling points were collected to get a mix of samples.Each soil sample was collected with three replicates. Therefore, we obtained 36 samples in total. Soil samples were placed in sterile plastic bags after collection and immediately transported to the laboratory in an ice box.
2.2 Pretreatment of soil samples
After removing roots, seeds, worms, debris, and other visible items, the soil samples were passed through a 2-mm sieve,divided into four equal parts,and treated as follows:
(1) Air-dried soil samples were placed on a tray in a thin layer and stored in a clean and tidy indoor ventilated place (~23°C) for 7 d. During the airdrying process, soil samples were flipped and large soil blocks were crushed to accelerate the drying.
(2) Freeze-dried soil samples were placed in a refrigerator at −20°C for 8 h, and then moved into small pouches for uniform drying. The pouches were placed in a lyophilizer (Scientz-18 N, China) and dried at −50°C for 72 h under vacuum conditions(0.05 MPa).
(3) Oven-dried soil samples were placed in a clean kraft envelope and dried in an oven at 40°C for 24 h.During the drying process,soil samples were turned over in time to ensure that they were evenly heated.
(4) Fresh soil samples were kept at field moisture level and stored at 4°C until further analysis.
All dried soil samples were stored at room temperature until further analysis.The total organic carbon(TOC)content and particle size fractions of these soils are listed in Table S1.
2.3 Soil chemical properties and N fractions analysis
The soil gravimetric water content (SWC) was determined by oven-drying at 105°C for 6–8 h. The soil pH was measured at a 1:2.5 (weight/volume, w/v) soil to water ratio using a pH meter (Mettler Toledo FE28,Switzerland). Soil inorganic N (NH4+and NO3−) and dissolved organic nitrogen (DON) were extracted by 2M potassium chloride solution at a 1:5(w/v)soil to solution ratio, and further determined by a continuous flow analyzer (Skalar San++ System, Netherlands). Soil MBN was determined by a chloroform fumigation–extraction technique (Yan, Wang, and Yang 2007), were analyzed with a TOC/N analyzer (Shimadzu TOC-L, Japan). All of the soil N fractions were calculated based on the dry weight of soil.
2.4 Fluxes of HONO,NO,and NO2 from soils
Emissions of Nrgases(HONO,and NOx=NO+NO2)from soils were measured using a dynamic chamber system,which has been described in detail in Wu et al. (2019).Briefly, 50 g of the homogeneous mixed soil sample was placed in a petri dish(inner diameter=9.4 cm)and wetted with purified water until the maximum water holding capacity was reached.Then, the petri dish containing the soil sample was moved to a Teflon chamber (volume:~10 L) and flushed with purified air (without CxHy, water vapor,HONO,NOx,O3,etc.)at a constant flow rate of 6 L min−1.Mixing ratios of HONO in the headspace were continuously monitored by a stripping coil coupled with highperformance liquid chromatography (SC-HPLC, Agilent 1200, USA) based on the reaction of sulfanilamide and N-(1-naphthyl)-ethylenediamine dihydrochloride (Huang et al. 2002). The temporal resolution and lower detection limit were 6 min and ~4 ppt,respectively.Concentrations of NOx, O3, CO2, and H2O were measured by a chemiluminescence analyzer (Thermo 42i-TL, USA), an ozone analyzer (Thermo 49i, USA), and a LI-COR (LI-COR 840A,USA),respectively.The fluxes of HONO and NOxwere calculated as follows:
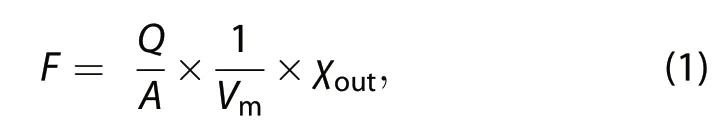
where F is the flux of HONO,NO,or NO2(ng m−2s−1,in terms of N, which is the same as follows), Q is the purging flow rate(m3s−1),A is the area of soil(m2),Vmis the molar volume of air(m3mol−1),and χoutis the headspace mixing ratio at the outlet of the chamber(ppb).
Total soil emissions of HONO, NO, and NO2(μg m−2)during a full wetting–drying cycle were calculated as follows(Weber et al.2015):
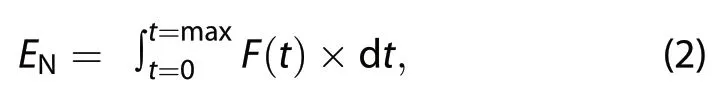
where ENis the total soil Nrgas (HONO, NO, or NO2;μg m−2), and F(t) is the Nrgas flux at the measurement time t.
2.5 Statistical analysis
The differences in soil chemical properties and N fractions between different drying methods were tested using one-way ANOVA according to Tukey’s HSD test at a significance level of P < 0.05.The differences in Nr(HONO, NO, and NO2) fluxes from soils between different drying methods were tested using the Kruskal–Wallis at a significance level of P <0.05.
3. Results and discussion
3.1 Soil water content and pH
The soil water content is an important factor affecting soil Nrgas fluxes and other physiochemical properties(Ding et al.2019;Gordon,Haygrath,and Bardgett 2008;Oswald et al. 2013). As expected, the SWC was significantly lower in all dried soils compared with fresh soil(Table 1). In general, the SWC of freeze-dried soils was the lowest, following by oven-dried and air-dried soils.Previous work has shown that freeze-drying causes greater damage to the stability of soil aggregates than other drying methods(Staricka and Benoit 1995),which may result in a lower moisture content in freeze-dried soil samples(Horn et al.1994).Higher soil temperatures could cause more soil water loss and a lower SWC in oven-dried(40°C)compared with air-dried(~23°C)soils.Compared with fresh soil, all drying treatments reduced the soil pH for farmland and grassland soils(Figure 1). Generally, the soil-drying process changes the activity of soil inorganic ions (such as Ca2+, Al3+,Mg2+) and organic ions (Blake et al. 2000; Haynes and Swift 1989), resulting in variation in soil pH measurements after drying, grinding, and rewetting (Ding et al.2019; Nielsen et al. 2017). The soil pH of air-dried samples was similar to that of oven-dried samples for grassland and forest soils,whilst that of freeze-dried samples was significantly lower than that of air-dried and ovendried samples for forest soil but significantly higher for grassland soil. Meanwhile, the differences in soil pH between freeze-dried and fresh soils (mean ± standard deviation: 0.52 ± 0.31) were smaller compared with airdried and oven-dried soils (mean ± standard deviation:0.72±0.38 and 0.64±0.36,respectively),indicating that the freeze-drying method might be better for simulating the soil pH of fresh samples. A previous study showed that the effect of soil drying was towards acidification,although both acidification and alkalization could occur(Courchesne, Savoie, and Dufresne 1995). Soil pHchanges were found to be significantly correlated with soil organic carbon and exchangeable aluminum,which can be explained by the dissociation of weak-acid organic functional groups and the displacement of exchangeable aluminum and the subsequent hydrolysis of water (Courchesne, Savoie, and Dufresne 1995). We did not analyze the soil dissolved organic carbon and exchangeable aluminum content; however, interestingly,our results showed a significantly positive relationship between soil pH and MBN, but not DON or other N fractions (P = 0.022, Figure S1). The reasons for changes in soil pH during drying should be studied further.
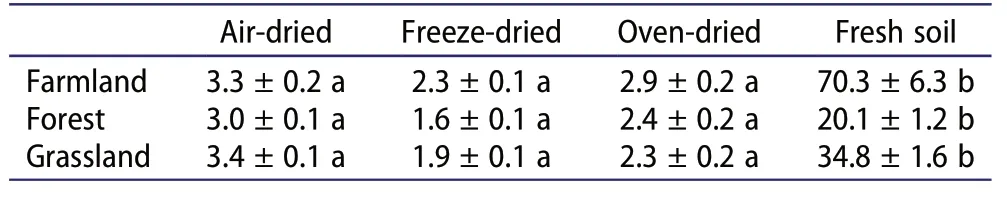
Table 1.Soil gravimetric water content(%)after different drying methods.Data are shown as mean±standard deviation(n=3).Different lowercase letters(a,b)indicate a significant difference between treatments at P < 0.05 according to Tukey’s HSD test.
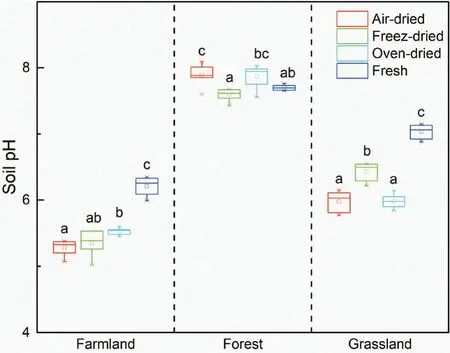
Figure 1. Comparison of soil pH treated with different drying methods with different land-use types. The horizontal lines above and below the boxes show the maximum and minimum values of the dataset, while the upper and lower boundaries of the boxes represent the upper and lower quantiles. The solid line in the middle of the box is the median value of the dataset. Boxes followed by different letters indicate statistically significant differences between treatments at P < 0.05 according to Tukey’s HSD test (n = 6 here, because each replicate was measured twice).
3.2 Soil N fractions
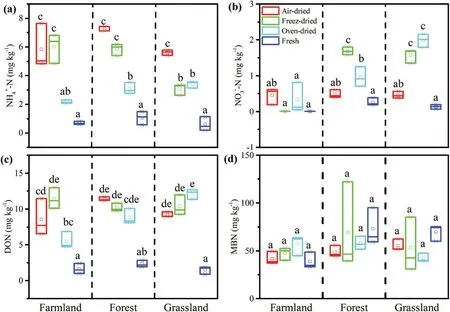
Figure 2.Comparison of soil(a)NH4+-N,(b)NO3−-N,(c)dissolved organic nitrogen(DON),and(d)microbial biomass nitrogen(MBN)treated with different drying methods with different land-use types.Boxes followed by different letters indicate statistically significant differences between treatments at P < 0.05 according to Tukey’s HSD test(n=3).
In general,soil drying significantly enhanced the soil NH4+-N, NO3−-N, and DON content compared with fresh soil,but not the MBN content (Figure 2). The increased amount of soil NO3−-N caused by different drying treatments ranged from 0 to 2 mg kg−1, which was smaller than that of NH4+-N (1–7 mg kg−1) and DON (3–11 mg kg−1).The results are consistent with the results of Su et al.(2005) and indicate that the soil-drying process significantly improves N mineralization (Seneviratne and Wild 1985).The temperature of soil drying can also affect soil ammonification and nitrification (Haynes and Swift 1989), which further affect the soil NH4+-N and NO3−-N content(Figure 2).The soil NH4+-N content was the highest for air-dried samples, followed by freeze-dried and oven-dried samples. The highest soil NO3−-N contents were detected in the freeze-dried forest and oven-dried grassland soils, while the soil NO3−-N contents were not statistically significantly different among the farmland samples. Previous research has shown that soil freezing can result in a significant increase in the N mineralization rate and mineral N content,which might be explained by the disruption of microbial tissues in a similar way to drying(DeLuca,Keeney,and McCarty 1992).
Soil DON plays a significant role in N cycling,and can be converted to NH4+-N by microorganisms(Jones et al.2004). As DON originates from the decomposition of organic matter (Jones et al. 2004), a higher soil DON content caused by drying can be expected (Figure 2).A previous study showed that air-drying increased the soil DON content by a 3- to 10-fold amount (Jones and Willett 2006),which is a similar magnitude to that in our results.
Figure 2 shows that the soil MBN was not significantly affected by the different drying methods. However,Gordon, Haygrath, and Bardgett (2008) showed that the soil MBN was significantly reduced by drying,possibly attributable to more leaching of dissolved inorganic and organic N. Our results showed that more soil DON was detected in the different dried samples (Figure 2),unfortunately, we do not have the data of leaching of DON.The relationships among these nutrients should be studied further.
3.3 Soil Nr gas fluxes
Consistent with previous studies(Oswald et al.2013;Wu et al. 2019), large HONO, NO, and NO2emissions were observed(Figure S2).The underlying mechanisms of soil HONO emissions have been attributed to the chemical equilibrium between soil pH and nitrite(Su et al.2011),direct emissions from ammonia-oxidizing bacteria(Oswald et al. 2013), or nitrate reducers (Wu et al.2019). As drying significantly reduced the soil water content (Table 1) and pH (Figure 1), and increased the soil NH4+-N,NO3−-N,and DON content(Figure 2),we also expected a significant shift in the soil Nrgases. Indeed,air-drying and oven-drying significantly increased the maximum soil HONO and NO flux from different landuse types,but not the NO2flux(Figure 3).The maximum HONO and NO fluxes from freeze-dried soils were comparable with that from fresh soil,perhaps because of the lower soil nitrate content in freeze-dried farmland soil(Figure 2; Wu et al. 2019), or the difference in soil pH between freeze-dried and fresh soils being much smaller than in the other drying methods (Figure 1). Further,Spearman’s rank correlation analysis showed that the maximum soil HONO flux was significantly positively related to NO3−-N content (Figure S3), but not with other soil edaphic factors. These results indicate that soil HONO emissions might be dominated by nitrate reduction by nitrate reducers rather than the nitrification process or chemical equilibrium(Wu et al.2019).
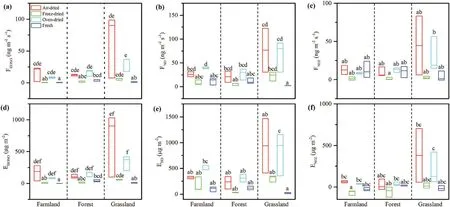
Figure 3.Comparisons of the(a–c)maximum soil HONO,NO,and NO2 flux and(d–f)total emissions during a full wetting-drying cycle with different drying methods from different land-use types. Boxes followed by different letters indicate statistically significant differences between treatments at P < 0.05 according to the Kruskal–Wallis test(n=3).
Total soil emissions of HONO, NO, and NO2during a full wetting–drying cycle were also affected by the different drying methods, and had a similar trend to the maximum Nrgas fluxes (Figure 3). Again, total soil emissions of HONO,NO,and NO2from freeze-dried soils were comparable with the fresh soil.
Previous studies have shown that a dynamic chamber system can simulate field-soil NO flux measurements (Rummel et al. 2002; van Dijk et al. 2002).van Dijk et al. (2002) compared field and laboratory fresh-soil NO flux using dynamic chamber measurements and found that the calculated and measured NO fluxes agreed well, both for forest and pasture,over the entire measurement period. For HONO measurements, a full wetting–drying cycle is normally applied to simulate field flux measurements,which can represent a wider range of SWC (Oswald et al. 2013; Sörgel et al. 2015; Wu et al. 2019). Owing to the variation in global soil moisture, it is necessary to gather soil HONO and NO flux data from 0%to 100% of the water-holding capacity for the best estimation of global soil HONO and NO emissions(Porada et al. 2019; Wu et al. 2019). Therefore, airdried or oven-dried soils are often used for soil HONO and NO flux measurements and estimating global emission budgets, while fresh soil samples tend to be used for mechanistic studies (Bhattarai et al. 2018; Mushinski et al. 2019). In this study, the maximum soil Nrgas flux and total Nrgas emission of freeze-dried soil were comparable with those of fresh soil, indicating that freeze-dried samples might be best for simulating fresh samples when studying soil Nrgas emissions.
4. Conclusion
All the drying methods considered in this work significantly affected the soil Nrgas fluxes,N fractions,and pH,and should,therefore,be considered for use in studies of the land–atmosphere interface and biogeochemical N cycling. However, compared with air-dried and ovendried soils, the use of freeze-dried soils might be better applied in soil Nrgas flux and N fraction studies.Considering the wide use of air-dried soil samples for long-term storage,we suggest freeze-dried soil samples could be an alternative for future studies.
Disclosure Statement
No potential conflict of interest was reported by the authors.
Funding
This work was sponsored by the National Natural Science Foundation of China [grant numbers 41807449, 41761144062,and 41730646], the Shanghai Pujiang Program [grant number 18PJ1403500], and the Fundamental Research Funds for the Central Universities.
ORCID
Dianming WU http://orcid.org/0000-0002-0414-9430
Yuepeng PAN http://orcid.org/0000-0002-5547-0849
杂志排行

Atmospheric and Oceanic Science Letters的其它文章
- Are typhoon and marine eutrophication the possible missing sources of high dissolved organic nitrogen in wet deposition?
- Spatial and seasonal patterns of atmospheric nitrogen deposition in North China
- Impact of an accidental explosion in Tianjin Port on enhanced atmospheric nitrogen deposition over the Bohai Sea inferred from aerosol nitrate dual isotopes
- Atmospheric nitrogen deposition in Yangtze River Delta:insights gained from the nitrogen content and isotopic composition of the moss Haplocladium microphyllum
- Changes in PM2.5 sensitivity to NOx and NH3 emissions due to a large decrease in SO2 emissions from 2013 to 2018
- Dry deposition of ammonia around paddy fields in the subtropical hilly area in southern China