Spatial pattern analysis of forest landscape in Changbai Mountain
2020-09-23ZHANGKaixinCHENShengboandWUQiong
ZHANG Kaixin, CHEN Shengbo and WU Qiong
College of Geo-Exploration Science and Technology, Jilin University, Changchun 130026, China
Abstract: Land use and land cover change is one of the important topics in the global change study with the development of satellite-based remote sensing technologies. This study employed 3D landscape pattern metrics to analyze the dynamics of land cover types around Heaven Lake in Changbai Mountain area from 2010 to 2015. The results indicated that forest land occupied the most proportion and increased from 61.9% in 2010 to 66% in 2015 due to government forest protection policy. The mean elevation of vegetation, including agriculture, fo-rest, grass and shrub was much lower compared with other land cover types (water, wetland, imperious land and bare land) in both 2010 and 2015. The elevation of agriculture land increased from 1 700 m in 2010 to 1 890 m in 2015 a decreased land proportion. Considering the adjacent relationship between the local agriculture land and forest land, the transformation from agriculture land to forest land was obvious in the lower elevation area. The study showed that the selected 3D landscape pattern metrics had the ability and efficiency to describe the spatiotemporal variations of mountainous landscape, and significant correlation existed between land cover and local terrain.
Keywords: LULC; 3D landscape metrics; terrain; forests
0 Introduction
Land use and land cover change (LULC) is the most direct expression of the interaction between human activities and natural environment (Turner, 1989; Ojimaetal., 1994; Turneretal., 1994; DeFriesetal., 2007). During recent years, socio-economic issues including population expansion, built-up land expansion, and environmental degradation have become increasingly significant due to urbanization (Chen, 2007; Shresthaetal., 2012; Sunetal., 2017). The frequent human activities increase the pressure on the natural environment and directly affect the structure and functions of natural ecosystems, causing a variety of ecological security issues such as environment pollution, land degradation and the decrease of biodiversity (Branoff, 2017; Sharleyetal., 2017; Khaledianetal., 2017).
Landscape ecology emphasizes the relationship among landscape pattern, ecological process and scale, of which the landscape pattern analysis focuses on the composition, spatial configuration and spatiotemporal dynamics of landscape (Turner, 1989). The metrics for landscape recognition are usually calcula-ted based on the patch mosaic model (PMM), and have been widely applied to understand how landscape pattern influences ecological process and to quantify the spatiotemporal characteristics of landscape variations (Cushmanetal., 2008; McGarigaletal., 2009). However, traditional landscape metrics are almost designed in 2D space, lacking of 3D or vertical information, such as elevation, aspect and slope (Hoechstetteretal., 2008; Frazier & Kedron, 2017; Wuetal., 2017). Lots of literatures show that these 3D features have a wide influence on the ecological processes, such as water cycling, urban thermal environment, and atmosphere pollutants accumulation (Hoechstetteretal., 2008; Wuetal., 2017; Kedronetal., 2018).
With the development of three-dimensional information extraction technology (e.g., SAR, LiDAR and oblique photogrammetry), a set of 3D landscape metrics has been introduced and discussed by combining the traditional 2D landscape metrics with 3D landscape features (Hoechstetteretal., 2008; Frazier & Kedron, 2017; Wuetal., 2017; Kedronetal., 2018). 3D landscape analysis can avoid the insufficiencies in 2D space that takes the patch as homogeneous, and takes the heterogeneity within the patches into the metrics calculation (Frazier & Kedron, 2017; Wuetal., 2017). In this study, the 3D landscape metrics were employed, for two objectives: (1) testing the feasibility and effectiveness of the 3D landscape metrics in measuring the mountainous landscape; (2) analyzing the spatiotemporal variations of land use and land cover change.
1 Materials and methods
1.1 The study area
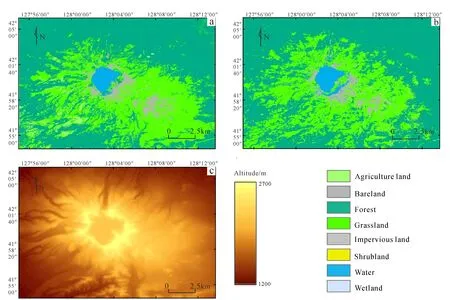
The Heaven Lake in Changbai Mountain area is located in the south of Jilin Province, China, and belongs to China and North Korea with central latitude of 42°00′N and longitude of 128°03′E. Songhua River, Tumen River and Yalu River originate from the Hea-ven Lake, and the horizontal distance from the bottom to top of the mountain is very long and is with obvious variation of flora and fauna assemblages. In the vertical direction, four natural landscape zones from temperate to cold were spatially distributed: mixed Korean pine and broadleaf forest zone (below 1 100 m), spruce-fir forest zone (1 100--1 700 m), sub-alpine mountain birch forest zone (1 700--2 000 m), and alpine tundra zone (above 2 000 m). The land classification data was downloaded from the National Remote Sen-sing Center of China and National Earth System Science Data Center with the resolution of 30 m, while the DEM was extracted from the SRTM data with the same resolution (Fig.1).

Fig.1 Land cover in 2015 (a) and 2017 (b) as well as DEM in the study area (c)
1.2 Methods
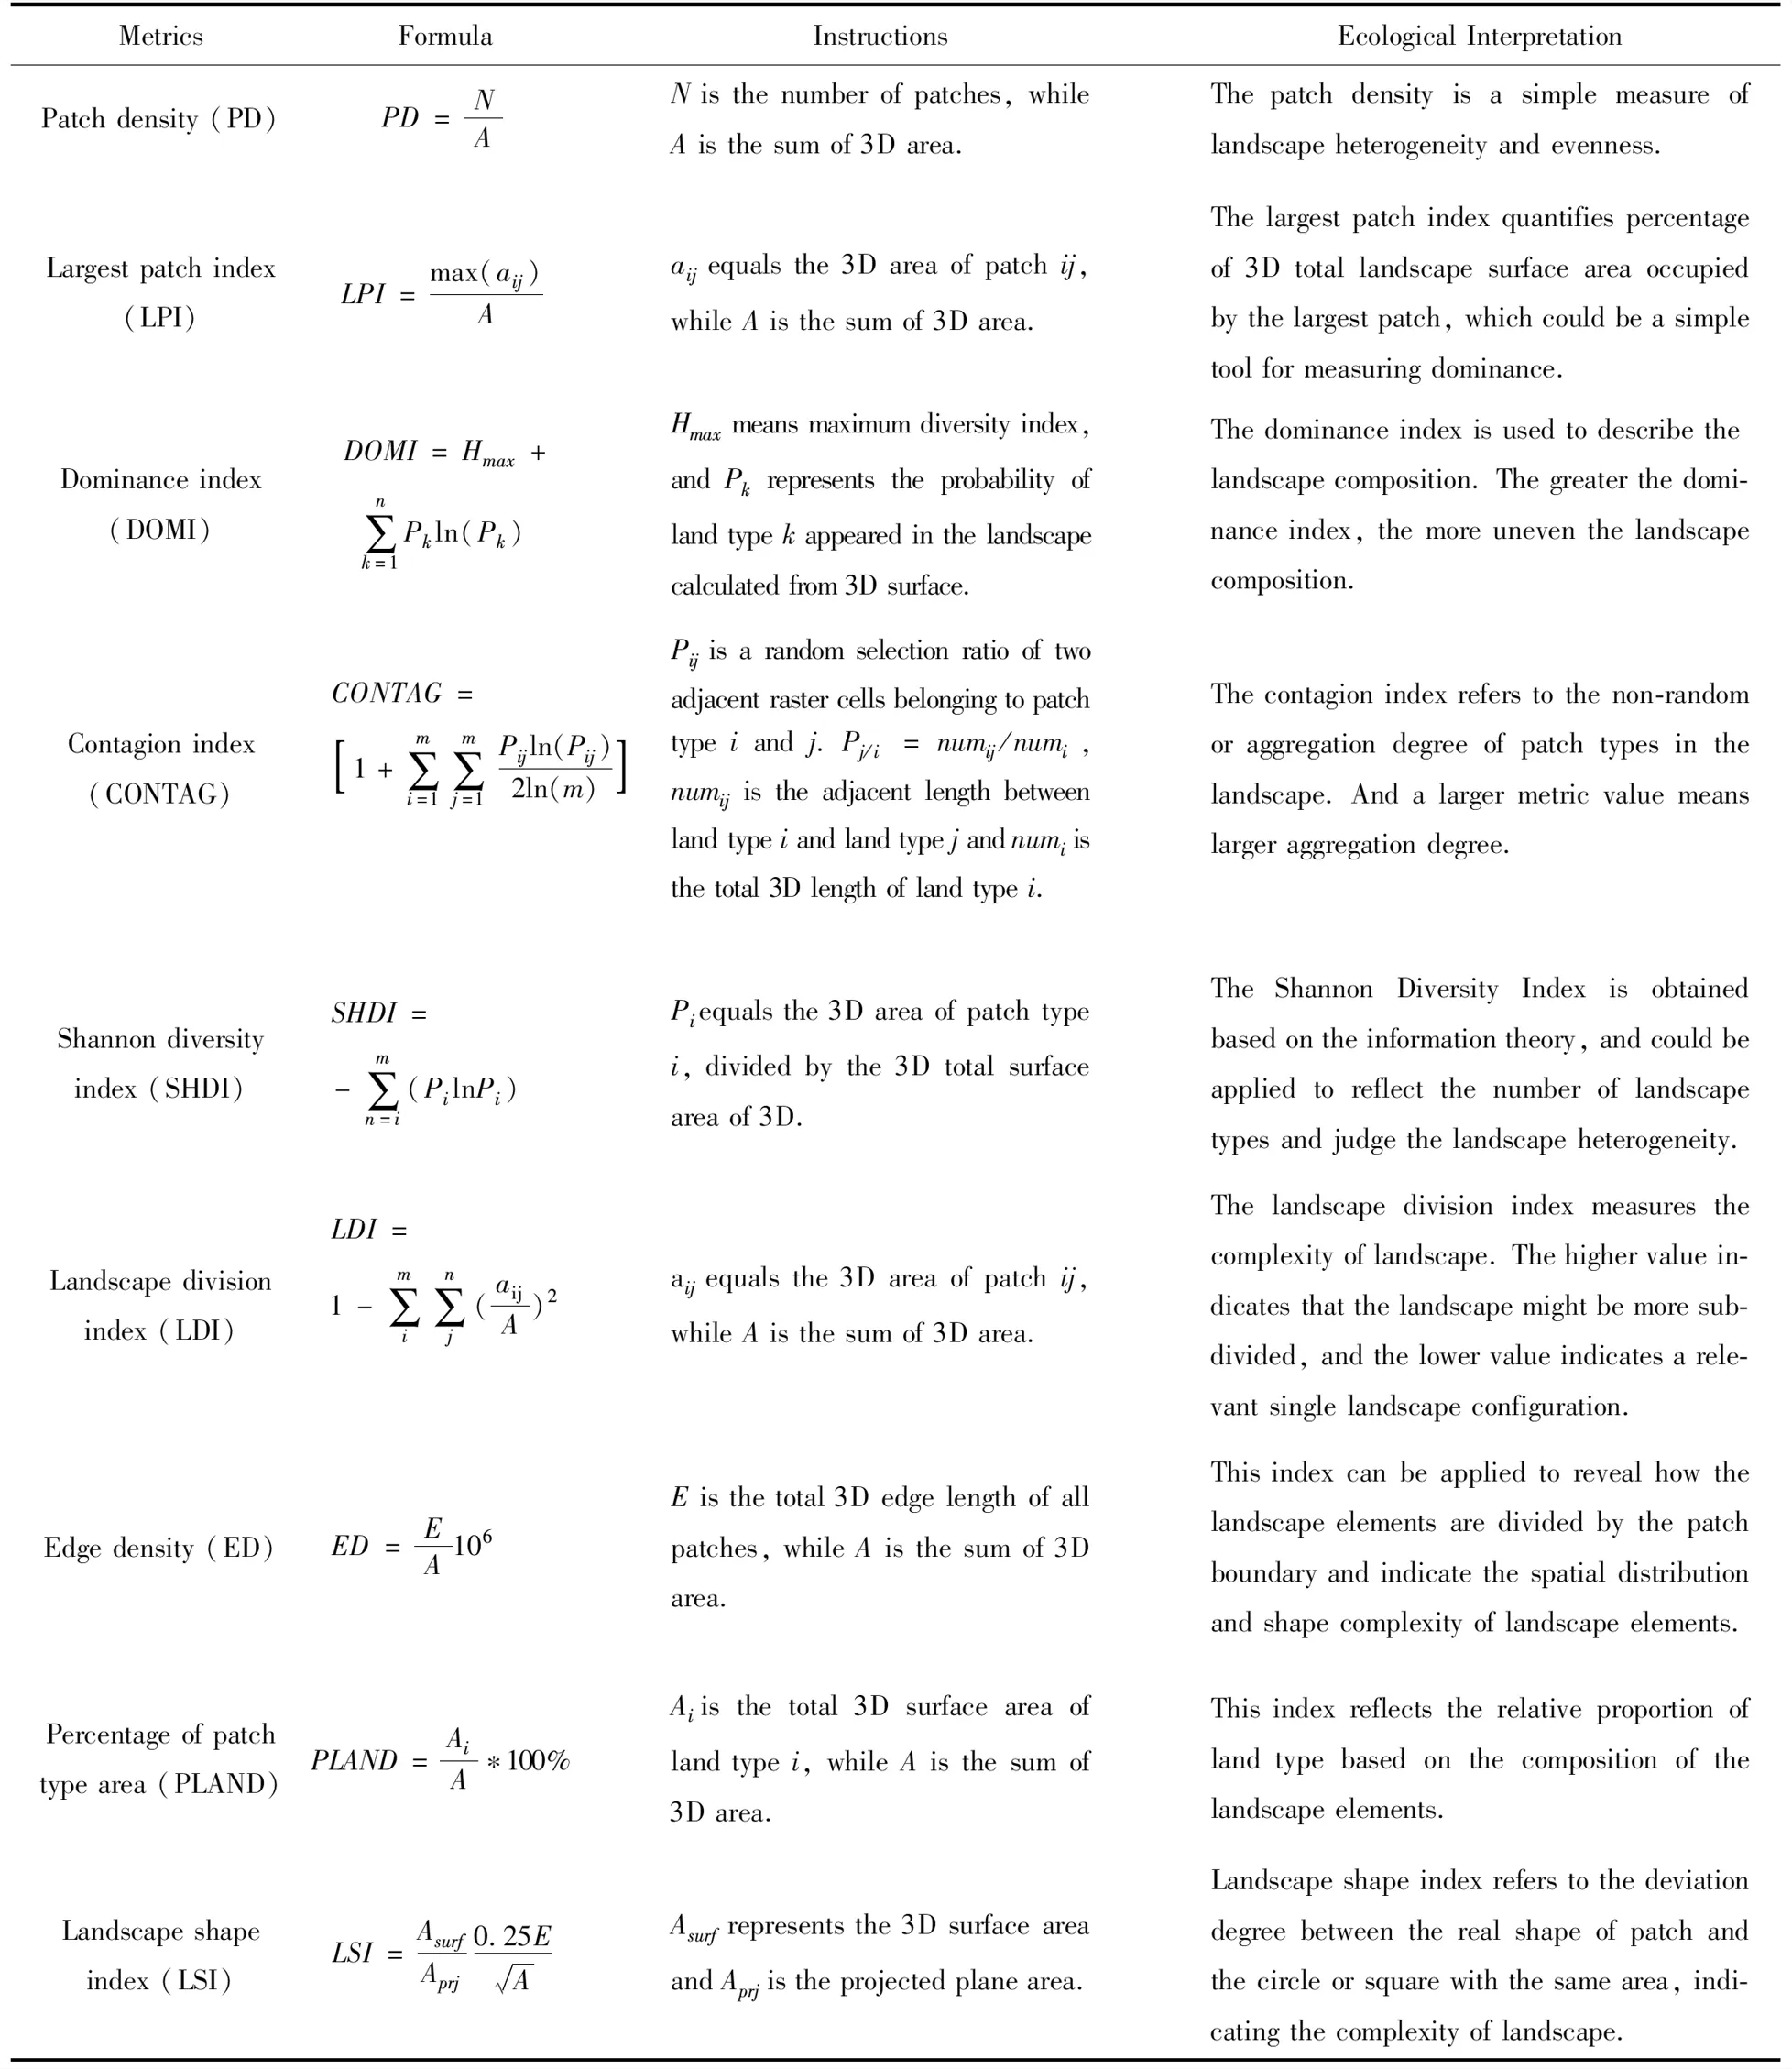
Nine 3D landscape metrics derived from 2D space was selected to characterized the 3D landscape in the study area (Wuetal., 2017). And the calculation formula is listed in Table 1 with the corresponding ecological significances.
2 Results
Table 2 shows the results calculated using 3D landscape metrics based on landscape level. The landscape fragmentation decreased significantly in 2015 compared with 2010. In the study area, the number of landscape patches (NP) decreased from 16 351 (2010) to 13 317 (2015), while the patch density (PD) also showed a decreasing trend from 30.071 in 2010 to 24.554 in 2015. The largest patch index (LPI) showed an opposite variation with the dominance index, meaning that some small patches were replaced by those belonging to the prominent land type. The contagion index was 69.659 in 2015, higher than that in 2010 (67.779), indicating the increase of dominance land type with relatively high connection degree. The lower Shannon Diversity Index (SHDI)(0.892) and division index (0.617) in 2015 reflected that the landscape diversity and complexity of landscape decreased due to the local terrain undulation and government protection policy. Genera-lly, the landscape consisted of single patch may gain the 0 value of division index, and separate patch with cell level may reach the maximum value of this index, which indicated a maximally subdivided landscape. The value of edge density (ED) was 570.664 in 2015, exceeds that in 2010 (506.049), mainly due to the decrease of patches number and landscape fragmentation.
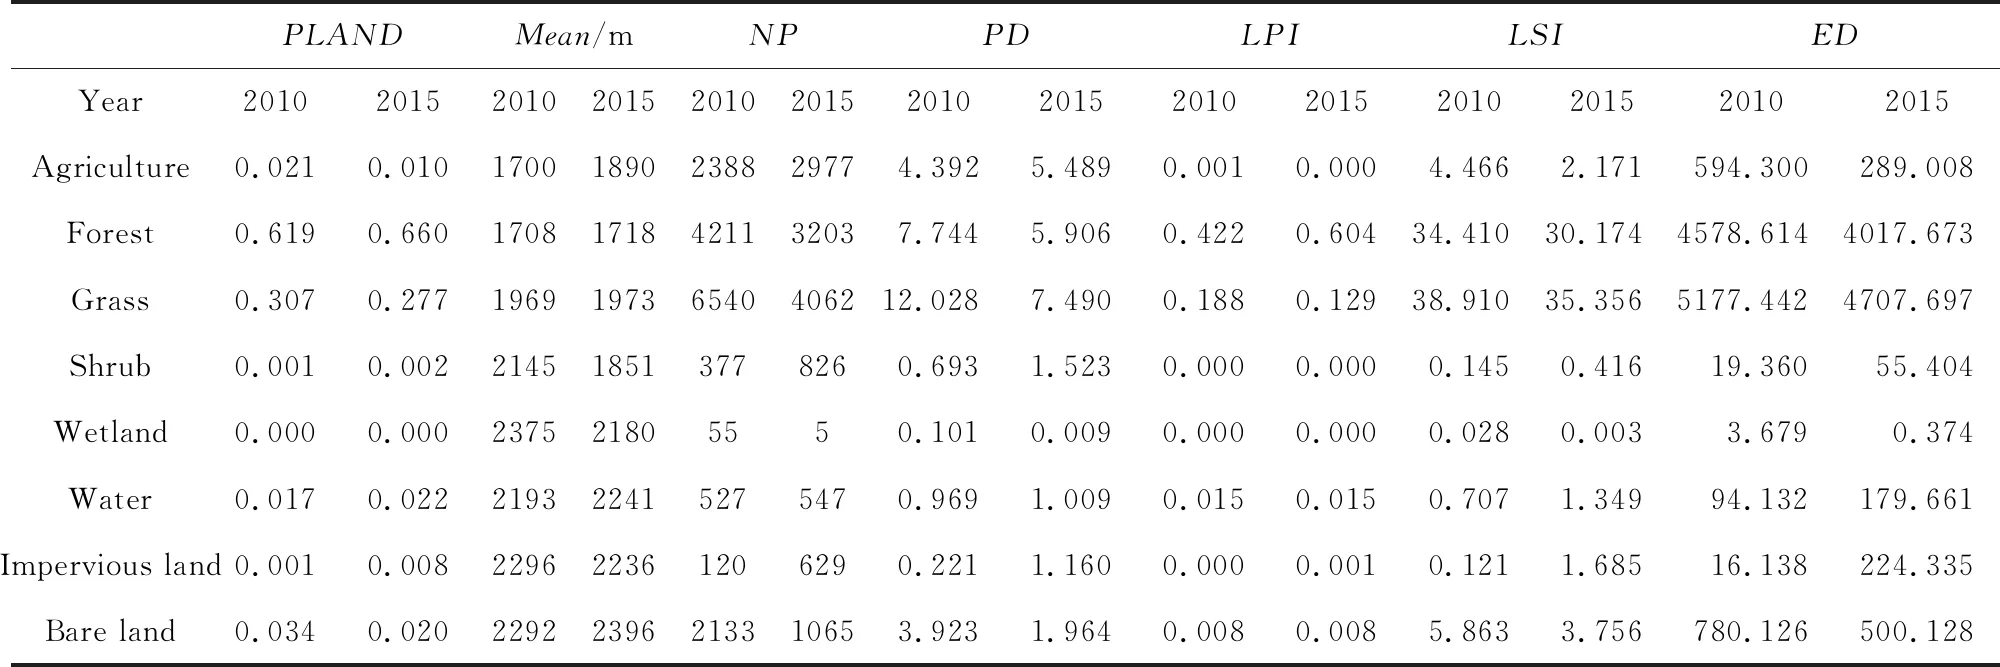
Table 3 shows the results of 3D landscape metrics based on the class level. From the results of percentage of patch type area (PLAND), the forest land occupied the most area, and increased from 61.9% in 2010 to 66% in 2015 due to government protection policy. The mean elevation of vegetation (agriculture, forest, grass and shrub) is much lower than that of other land cover types (water, wetland, imperious land and bare land) in both 2010 and 2015. The spatial distribution characteristics of these land types were mainly affected by the increase of elevation with a decrease tendency of air temperature. The results displayed a significant increase of the elevation of agriculture land from 2010 to 2015 (1 700 m and 1 890 m, respectively), but the land proportion decreased from 2.1% to 1.0%. Considering that the agriculture land was adjacent to the forest land, the results proved that there was obvious transformation from agriculture land to forest land. Similarly, the mean elevation of shrub decreased while the land proportion increased, indicating that the transformation from bare land to shrub occurred when taking the variations of bare land’s elevation and proportion into consideration due to local people’s protection and natural factors changes. The NP of grassland was the highest in both 2010 and 2015 among the land cover types, but it decreased from 6 540 in 2010 to 4 062 in 2015. The PLAND indicated that forest land occupied the most, while the NP indicated that the grassland exceeded the others. The differences reflected a much more fragmented grassland than others. The patch number of agriculture land increased from 2 388 to 2 977 in this period, but the land proportion decreased, which reflected that the total 3D area of agriculture land decreased and some agriculture patches were replaced by other land cover types. The patch density of forests was much higher than the others due to more complex 3D terrain on the forest. The forest land had higher lar-gest patch index in both 2010 and 2015, and the results tended to increase from 0.422 in 2010 to 0.604 in 2015 because the largest patch in the forest absorbed adjacent patches belonging to other land cover types.

Table 1 Selected 3D landscape pattern metrics and relevant ecological significance

Table 2 Calculated 3D landscape metrics on landscape level in 2010 and 2015
The landscape shape index (LSI) showed that the vegetation changes were higher than other land cover types between 2010 and 2015. Among the vegetation, the LSI of grassland was highest in both years (38.910 and 35.356, respectively), showing the shape of grassland patches is much more complex compared with others due to local terrain variations. The forest land and grassland are the main land types in the study area, and the decrease in shape comple-xity between 2010 and 2015 indicates that smaller patches are replaced by the dominant land types, which in turn leads to decrease of the patches number as well as landscape edge complexity. Similar variation characteristics occurred in the edge density index. Both the forest land and grassland exceeded others in 2010 and 2015, but the calculated values tended to decrease within this period.

Table 3 Calculated 3D landscape metrics on class level in 2010 and 2015
3 Discussion
Global and regional land use and land cover change have attracted more and more concern around the world with the development of satellite-based remote sensing technologies (Turner, 1989; Turneretal., 1994; DeFriesetal., 2007). The reasons causing dynamics of land cover types in Changbai Mountain area mainly include two parts: natural factors and human activities. The former consists of local terrain and climate characteristics, while the later refers to the local residents’ protection and government policy, particularly returning cultivated land to forest. As a basic geographical element, the terrain correlates with the land use and land cover changes and affects landscape heterogeneity significantly by changing the spatial distribution of sunshine, water and temperature (McGarigaletal., 2009; Wuetal., 2017). Generally, the influence of terrain on the land use almost remains unchanged because of relatively stable environment within a certain time. The temporal variations of land use and land cover are mainly controlled by local government. The Heaven Lake in Changbai Mountain is a famous tourist resort in Jilin Province, and Changbai Mountain forest region is one of the largest natural forest areas in China, which has the function of maintaining the balance of air and water circulation, and protecting the soil from wind and rain and alleviating the harm caused by environmental pollution. Due to long-term intensive over-logging, the number of over-ripe forests that can be harvested decreased sharply, and the local government had spent lots of human and material resources to cultivate new forests to avoid the harm caused by the reduction of virgin forest as much as possible. The new forests are usually designed with certain regularity of shape, and absorb the adjacent smaller patches, which leads to the decrease of landscape edge complexity and the increase of landscape dominance degree.
During recent years, massive numerical statistical methods and ecological models, such as landscape pattern metrics, rule-based regression model, ordinal least square and geographically weighted regression, have been proposed and discussed to describe the landscape pattern characteristics and to reveal how landscape pattern affects ecological process (Davisetal., 2016; Guoetal., 2016). The traditional landscape pattern metrics were widely applied to capture the spatial heterogeneity of land use and land cover types, but most of them were employed in 2D space, which ignored the third dimensional information (McGarigaletal., 2009; Wuetal., 2017; Kedronetal., 2018). Moreover, the internal homogeneity is one important standard of land classification, leading to the missing of height changes inside the same land type. The 3D landscape metrics discussed in this study have proofed the suitability and effectivity to describe the landscape structure and spatial heterogeneity, and the internal terrain undulation inside the same land type was included in the landscape pattern analysis. Further expanded application in other fields includes the potential to analyze the spatial distribution variations of urban heat island, its expanding regularity over time, the precision agriculture and forestry. The changes of landscape metrics are quantitative reflection of the temperature pattern characteristics, and the intensity of UHI would be evaluated by means of the metrics variations over locations. For the application of precision agriculture and forestry of 3D landscape metrics, the growth status of vegetation has time-dependency and location-dependency due to the uneven allocation of CO2, light and water (Bergenetal., 2009; Wuetal., 2017). The 3D landscape me-trics are competent to predict the changes of vegetation growth and estimate the yield of crops based on the vegetation height, surface area and volume cha-racteristics.
However, there are still several deficiencies. The scale effect is rarely involved in this study, and the multi-scale characteristics of land use and land cover changes might be more reliable and valuable compared with the calculated value under a given scale (Arnfield, 2003; Wu, 2004; Wuetal., 2017). Besides, the surface texture parameters were not included. In the man-made landscapes, most of the land use types are mosaiced with regularity and texture characteristics (e.g., isotropy and anisotropy), which may be detected by the surface texture parameters (Wuetal., 2017; Kedronetal., 2018). In the past decades, massive amounts of ecological metrics have been proposed to reveal the relationship among landscape patterns, ecological processes and scales. Since the landscape features and ecological significance expressed by these metrics might be similar and spatially correlated, how to select the metrics with weak correlation needs more consideration.
4 Conclusions
This study employed 3D landscape pattern me-trics to analyze the dynamics of land use and land co-ver types from 2010 to 2015 in Changbai Mountain area. According to the experimental results, the following conclusions were drawn:
(1) The selected 3D landscape pattern metrics have the ability and efficiency to describe the spatiotemporal dynamics of Changbai Mountain area landscape between 2010 and 2015. On the landscape le-vel, larger patches replaced the smaller ones, leading to the increase of dominant land type proportion as well as the decrease of landscape diversity and evenness. On the class level, the fragmentation of grassland was the highest among all the land types as indicated from patches number and patch density. Besides, the results showed that forest land occupied the most area, and the proportion of forest land increased with the decrease of grassland and agriculture land, which indicated that agricultural land and grassland have transformed into forest land due to local government policy protection and terrain undulation.
(2) Significant correlation between land cover and local terrain was identified using 3D landscape metrics. Indicators relevant to the elevation information of patches indicated that the mean altitudes of vegetation was much lower than the others (e.g., water, imperious surface and bare land). Among the vegetation, the agricultural land was the lowest (1 700 m) in 2010, but in 2015, the forest land turned to be the lowest (1 720 m), showing the boundary of forest land decreasing and obvious transformation from agriculture land to forest land due to the policy of returning the cultivated land to forests.
杂志排行
Global Geology的其它文章
- Determining water well sites based on electrical structure in Taobei District of Baicheng
- Structure analysis of shale and prediction of shear wave velocity based on petrophysical model and neural network
- Influence of wettability of shaly sandstone on rock electricity parameters
- U-Pb-Hf isotopes of Neoarchean Shuimowan tonalites in southern margin of North China Craton: constraints on petrogenesis
- Method for extracting angle-domain common image gathers in Kirchhoff beam migration
- Controlling factors of sphalerite and galena deposition in Baiyinnuo’er skarn deposit, Inner Mongolia, China
