Structure analysis of shale and prediction of shear wave velocity based on petrophysical model and neural network
2020-09-23ZHUHaiXUCongLIPengandLIUCai
ZHU Hai, XU Cong, LI Peng* and LIU Cai
1. College of Geo-Exploration Science and Technology,Jilin University,Changchun 130026, China;2. Northeast Electric Power Design Institute Co., Ltd of China Power Engineering Consulting Group,Changchun 130026, China
Abstract: Accurate shear wave velocity is very important for seismic inversion. However, few researches in the shear wave velocity in organic shale have been carried out so far. In order to analyze the structure of organic shale and predict the shear wave velocity, the authors propose two methods based on petrophysical model and BP neural network respectively, to calculate shear wave velocity. For the method based on petrophysics model, the authors discuss the pore structure and the space taken by kerogen to construct a petrophysical model of the shale, and establish the quantitative relationship between the P-wave and S-wave velocities of shale and physical parameters such as pore aspect ratio, porosity and density. The best estimation of pore aspect ratio can be obtained by minimizing the error between the predictions and the actual measurements of the P-wave velocity. The optimal porosity aspect ratio and the shear wave velocity are predicted. For the BP neural network method that applying BP neural network to the shear wave prediction, the relationship between the physical properties of the shale and the elastic parameters is obtained by training the BP neural network, and the P-wave and S-wave velocities are predicted from the reservoir parameters based on the trained relationship. The above two methods were tested by using actual logging data of the shale reservoirs in the Jiaoshiba area of Sichuan Province. The predicted shear wave velocities of the two methods match well with the actual shear wave velocities, indicating that these two methods are effective in predicting shear wave velocity.
Keywords: shale; rock-physics model; BP neural network; prediction of shear wave velocity
0 Introduction
Unconventional oil and gas resources such as shale gas have been the research hotspots in recent years. The interpretation and evaluation of shale gas are quite different from conventional oil and gas reservoirs, so higher requirements are imposed on the study of shale gas (Guoetal., 2014). Since June 2019, there has been an earthquake at a magnitude of 6.0 and multiple aftershocks at magnitudes above 5.0 in Yibin City, Sichuan Province. Sichuan Basin is an important shale oil and gas production area in China, frequent seismic activities have raised concerns about shale oil and gas exploration and development. People want to know the underground situation and the causes of earthquakes, therefore, it is of great significance to analyze the pore structure and predict the shear wave velocity of shale.
Shear wave velocity is necessary for pre-stack inversion and seismic attribute extraction (Sunetal., 2008). In actual logging, shear wave velocity data is not acquired in many wells (Chuetal., 1995). For this reason, researchers have done a lot of research to predict shear wave velocity. Earlier shear wave velocity prediction methods were mainly based on empirical relationships. Hanetal. (1986) discussed the empirical relationship between the velocity and porosity of pure sandstone through ultrasonic tests and fitted the corresponding empirical formulas under different pressure conditions. Castagna and Greenberg (1992) discovered a way to estimate the shear wave velocity based on the empirical relationship between the P-wave velocity and the linear mixing law of rock skeleton components. De Souseetal. (2019) found a hybrid method based on the Greenberg-Castagna equation to estimate the S-wave velocity. The shear wave velocity prediction method based on petrophysical model has become the main method of shear wave velocity prediction (Baietal., 2012). Xu and White (1996) described several geometries of sandstone and mudstone pores based on the K-T theory (Kuster & Toksöz, 1974), and proposed an equivalent medium model for sandstone-mudstone reservoirs. Yunetal. (2004) integrated the Biot-Gassmann model to obtain the shear wave velocity information of the reservoir through relevant parameters such as rock composition, porosity, temperature and rock surface pressure. Xu and Payne (2009) used the Xu-White model to study carbonate pores, and successfully introduced the mo-del to carbonate rocks to estimate S-wave velocity. Yin and Li (2015) applied Raymer formula and Xu-White model, and used nonlinear optimization algorithms to invert the P-wave velocity and S-wave velocity based on the analysis of pore structure. Huetal. (2014) studied the anisotropy of shale, and established the physical model of anisotropic shale using Brown-Korringa theory to describe the effect of rock pore fluid.
Recently, artificial intelligence and deep lear-ning have risen rapidly. Many researchers have also applied intelligent algorithms such as neural network algorithms to predict the S-wave velocity. The neural network method uses a large number of well logging data, the strong non-linear relationship between the shear wave velocity and other logging data was obtained through network training, and then the shear wave velocity was predicted according to the trained relationship (Chaoetal., 2014; Lietal., 2015; Parvizietal., 2015). BP neural network is one of them. It has great flexibility and adaptability when solving non-linear problems, and can implement complex functional relationship transformation (Wang, 2013).
Most of the methods applied to conventional re-servoirs such as clastic rocks and carbonate rocks are improved and adjusted to the shale structure analysis and parameter prediction (Wangetal., 2010; Chenetal., 2013; Dengetal., 2015). This paper combined the shale mineral composition, pore type and organic matter (kerogen) structural characteristics, established a physical model to predict the shear wave velocity of shale containing organic matter. In addition, the BP neural network algorithm is introduced into the shear wave prediction. By training the BP neural network to simulate the relationship between the physical parameters and elastic parameters of the shale reservoir, the P-wave and S-wave velocities of shale are directly calculated from the reservoir para-meters. Finally, the above two methods are tested with actual logging data, and the test results show that both methods have good applicability and accuracy.
1 Methods and principles
1.1 Voigt-Reuss-Hill model
The Voigt-Reuss-Hill model is used to calculate the equivalent elastic modulus of the rock matrix. Voigt proposed equal strain average, which is the upper limit of the effective elastic modulus of the N-phase mineral mixture. Reuss proposed equal stress average, which gives the lower limit of the effective elastic modulus of the mineral mixture. The modulus parameters of actual rock measurements must fall between the estimated values of the Voigt upper limit and the Reuss lower limit. Therefore, Hill (1965) proposed to take the arithmetic average of the results of these two models, which is the Voigt-Reuss-Hill model:
(1)
(2)
(3)
Whereirepresentsi-th mineral component,fiandMirepresent the size of the rock mineral component and the corresponding elastic modulus of each component, respectively.MVis the Voigt upper limit,MRis the Reuss lower limit, andMVRHis the average of Hill. When the rock-solid mineral composition and pore space are given, the Voigt-Reuss-Hill model can estimate the equivalent elastic modulus of the rocks.
1.2 SCA petrophysical model
SCA model is the abbreviation of self-consistent model. Berryman (1980) proposed the self-consistent approximation theory for equivalent medium. The ba-sic idea is to assume that the multiphase medium with solution is located in an infinite matrix, and by constantly adjusting the elasticity parameter to match the elasticity parameter of the background medium with the multiphase medium, the elasticity modulus of the background medium can then be equivalent to the multiphase rock medium using the following formulas:
(4)
(5)

1.3 Gassmann equation
To obtain the elastic modulus of fluid-saturated rocks, fluids need to be added to the pores of dry rocks using the theory of fluid replacement. Gassmann (1951) and Biot (1956) gave the formula for calculating the equivalent elastic modulus of fluid-saturated rocks, namely the Gassmann equation:
(6)
μsat=μdry
(7)
WhereKdryis bulk modulus of rock skeleton,Ksatis bulk modulus of saturated rock;K0is bulk modulus of mineral;Kflis effective bulk modulus of fluid;φis porosity;μdryis effective shear modulus of rock skeleton andμsatis effective shear modulus of saturated rock.
From the relationship between rock elasticity parameters and rock velocity, the P-wave velocity (Vp) and S-wave velocity (VS) of fluid-saturated rocks can be calculated.
(8)
(9)
2 Calculation with petrophysical model
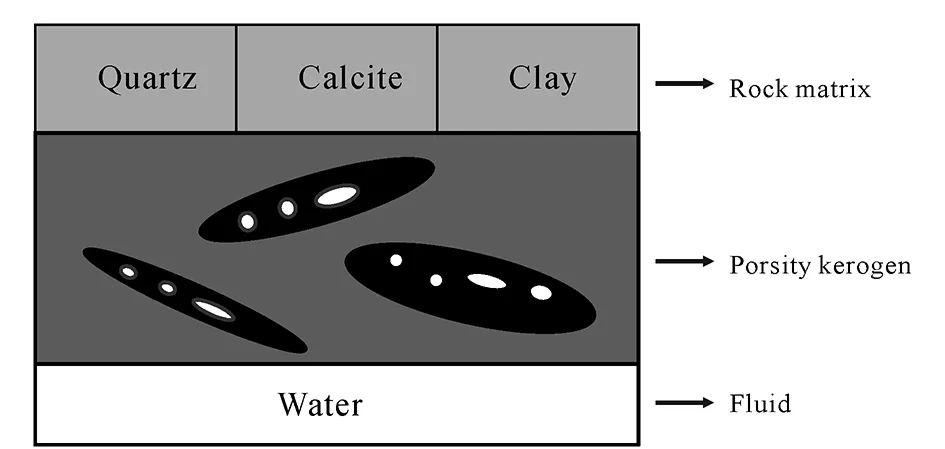
Fig.1 Equivalent organic shale material structure
When building a petrophysical model of organic shale, it is necessary to consider the mineral composition and pore structure characteristics of the formation. As shown in Fig.1, shale is equivalent to a mixture consisting of rock matrix, organic matter such as kerogen, pores and fluids. The rock matrix minerals consist of quartz, calcite, dolomite and clay. The pores are divided into two types: effective pores and ineffective pores (disconnected pores in the rock). Effective pores are equivalently composed of crack pores and spherical pores, and the adaptive adjustment of volume fractions of spherical pores and fractured pores are used to describe the complex pore types in the rocks. Kerogen is neither a solid mineral nor a fluid and it is added to the dry rock skeleton in our model as a mineral.
The modeling process of organic shale is shown in Fig.2. The modeling process can be divided into the following steps:
1) According to the mineral composition of shale in the study area, Voigt-Reuss-Hill model (formulas (1), (2) and (3)) is used to calculate the bulk mo-dulus and shear modulus of the rock matrix. The elastic modulus of the mineral used in calculation is shown in Table 1, which can be measured in the laboratory. The volumetric fraction of the mineral can be mea-sured by logging data.
2) Based on the SCA model (formulas (4) and (5)), pores and organic matter (mainly kerogen) are added to the rock matrix to obtain the bulk modulus and shear modulus of the dry rocks.
3) Calculating the bulk modulus and density of the mixed fluids such us water, gas and oil in the shale using the Wood equation.
4) The Gassmann theory (formulas (6) and (7)) is used to add fluid into the dry rock to obtain the equi-valent bulk modulus and shear modulus of the final fluid-saturated rock.
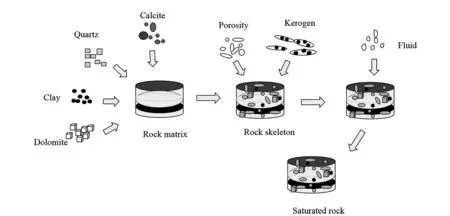
Fig.2 Schematic diagram of shale rock physical model

Table 1 Elastic parameters and density of rock composition
5) Finally, formulas (8) and (9) are used to calculate the P-wave and S-wave velocities of fluid-satura-ted rocks.
The process of predicting shear wave velocity by petrophysical model is shown in Fig.3, the objective functionmin|VPc-VPm| is calculated with the P-wave velocity as a constraint, by minimizing the error between the calculated P-wave velocity and the actual measured P-wave velocity by the model, the optimal pore aspect ratio is obtained by inversion. The pore aspect ratio is subsequently used to calculate the shear wave velocity.
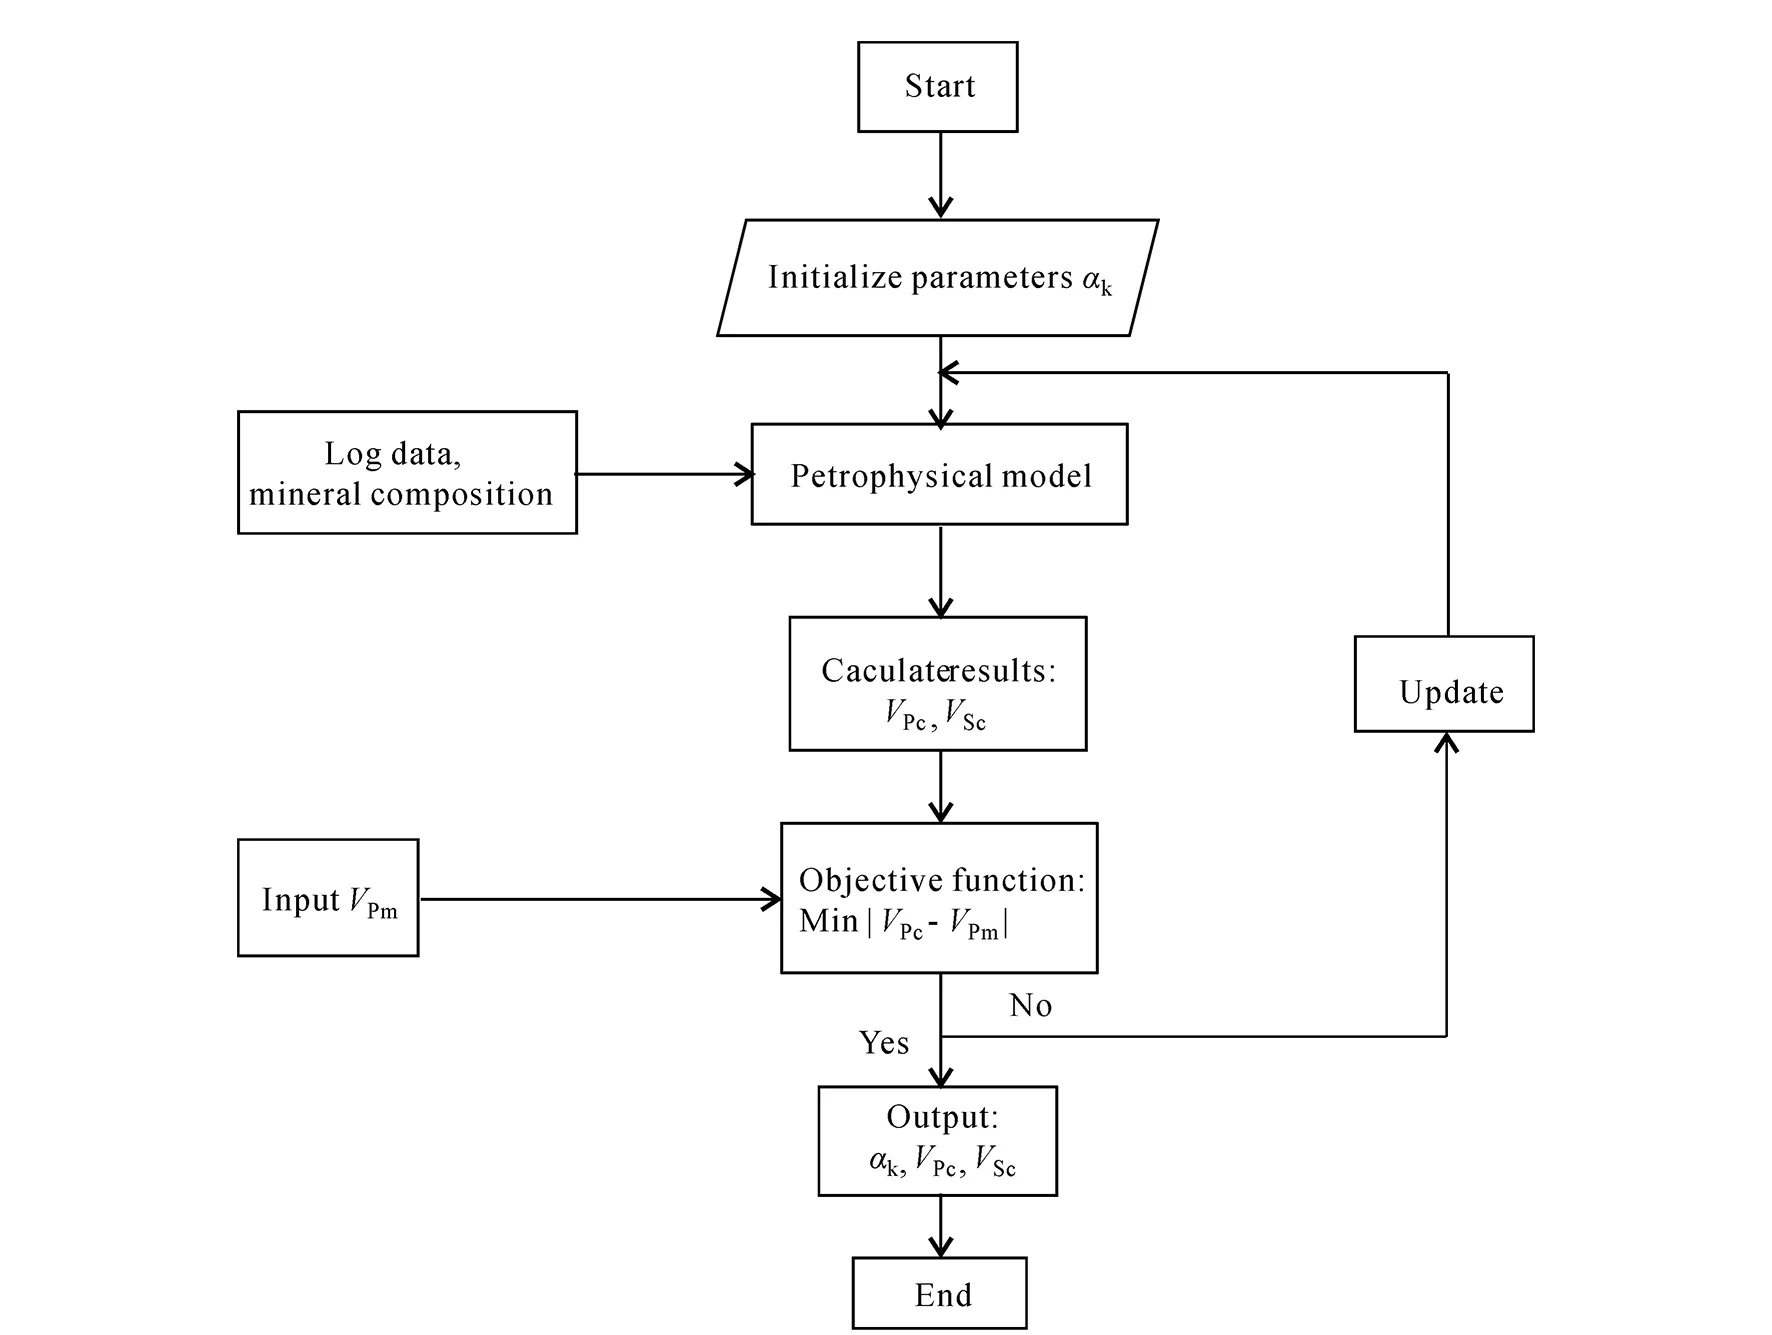
Fig.3 Flow chart of shear wave prediction based on rock physics model
3 Calculation of shear wave velocity with BP neural network
BP neural network is a multi-layer feedforward neural network back propagation algorithm, which is widely used in the simulation of non-linear functions. BP neural network algorithm is used to predict the elastic parameters of shale in this study, and to establish the quantitative relationship between the physical parameters and elastic parameters of the organic shale.
The structure of the BP neural network is shown in Fig.4. The BP neural network neurons are arranged hierarchically, which consists of input layer, hidden layer and output layer. The upper and lower layers are connected to each other, but there is no connection between the neurons in each layer. The BP neural network calculation is mainly divided into two stages. The first stage is the forward propagation of the signal, from the input layer through the hidden layer, and finally to the output layer. The second stage is the back propagation of errors, from the output layer to the hidden layer, and finally to the input layer, adjusting the weights and thresholds of the hidden layer to the output layer and the input layer to the hidden layer.
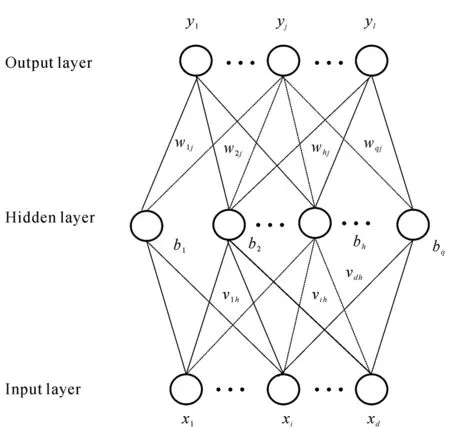
Fig.4 Schematic diagram of BP neural network structure
As shown in Fig.4, the inputαhand outputbhof theh-th hidden neuron are:
(10)
The inputβjand outputzjof theh-th output layer neuron are:
(11)
Wherexiis thei-th neuron in the input layer,bhis theh-th neuron in the hidden layer,vihis the weights of thei-th input layer neuron, andwhjis the weights of thej-th hidden layer neuron,gandfrepresent the excitation functionsigmoidfunction andtanhfunction, respectively.
The error between the output of the BP neural network and the expected output is:
(12)
Whereyjis thej-th neuron in the output layer, andzjis the output of thej-th neuron in the output layer.
According to the method of sample learning, part of the data is provided as training samples. The activation values of neurons are propagated from the input layer through the hidden layer to the output layer. Each unit in the output layer obtains the input response of the network. Reducing the error between the expected output and the actual output, the weights and thresholds are adjusted layer by layer from the output layer through the middle layer, and finally return to the input layer. This process is continued until the error of the network output is reduced to the accuracy requirement, or until the number of learning times set in advance. The BP neural network has now been trained well, and can be used to predict data after calculating the input data. The flow chart of the S-wave velocity prediction by the BP neural network is shown in Fig.5.
4 Results and discussions
In order to verify the two S-wave velocity prediction methods proposed in this paper, they have been applied to the Longmaxi Formation shale in Jiaoshiba area, Sichuan Province. Well A in the study area is selected for S-wave velocity calculation. When using BP neural network to predict S-wave velocity, training data need to be input to train the neural network, log data from three wells adjacent to well A were selected as training data.
Fig.6 shows the well logs of organic shale gas reservoirs in well A of the study area, where the log curves are gamma (GR), P-wave and S-wave velocities (VP) and (VS) of the sonic log, density, porosity (φ) and volumetric fractions of minerals. The depth of organic shale is 2 330--2 410 m, and the depth of gas reservoirs is between 2 395--2 410 m, which shows high kerogen content and high gas content, mainly characterized by low velocity and low density on logs. It also shows the actual measured P-wave and S-wave velocities of Well A. The consistency of P-wave and S-wave velocities is very strong, and the volumetric fraction of each mineral component is given. The mineral components are mainly quartz, calcite, kerogen, clay and minor pyrite.
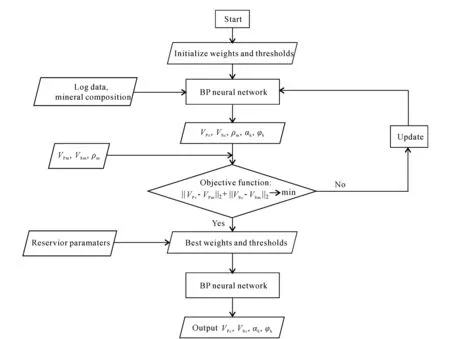
Fig.5 BP neural network S-wave prediction flow chart

(a) Gamma; (b) P-wave velocity; (c)S-wave velocity; (d) density; (e) porosity; (f) volumetric fraction.Fig.6 Well log data of shale gas reservoirs
The data of well A in the study area was input into the petrophysical model proposed in this paper. Fig.7 shows the calculation results of the pore aspect ratio and S-wave velocity of well A. It shows that the pore aspect ratio and pore structure of the shale are relatively stable. Within the shale reservoir interval, the predicted shear wave velocity curve matches well with the measured shear wave velocity curve, and the trends of them are consistent. The errors between the estimated velocities and the actual measured velocities are small, indicating that the shear wave velocity prediction method based on petrophysical model for the shale is reasonable. The correlation coefficient between the calculated P-wave velocity and the mea-sured value is 0.99, and the average relative error is 0.04%. The correlation coefficient between the calculated S-wave velocity and the measured value is 0.90, and the average relative error is 2.30%. The small errors of the calculated P-wave and S-wave velocities with the actual measured values prove that the petrophysical model used in this paper is accurate and effective in calculating the S-wave velocities.

Fig.7 Prediction results of shear wave velocity of shale reservoir based on petrophysical model
When using the BP neural network algorithm to predict the shear wave velocity, the neural network is firstly trained with the log data from three wells adjacent to well A. The physical parameters such as porosity, density, clay content and mineral composition are used as input layers to the BP neural network shown in Fig.4, the P-wave velocity is the expected output. The BP neural network is trained, with the weights and thresholds continuously updated in the process of obtaining the minimum error. When the error reaches the accuracy requirements, the most appropriate weights and thresholds are obtained, and the neural network training is completed. The optimal weights and thresholds are applied to the BP network, and then the reservoir parameters are input to calculate the P-wave and S-wave velocities. Table 2 shows the relative errors and correlation coefficients of the training data prediction results. The relative errors of the three training wells are 0.021, 0.030 and 0.017, the correlation coefficients are 0.976, 0.982 and 0.990, with an average relative error of 0.023 and an average correlation coefficient of 0.983. The results show that the BP neural network is well trained, and the calculation results are highly accurate. Therefore, this neural network can be used in the data prediction. The rms error results of the BP neural network training shows that the rms error basically meets the accuracy requirements after 35 iterations, and the iteration number is set to 45 in this paper. According to the training results, the trained BP neural network is used to predict the physical parameters of the reservoir, and the data of Well A is input to the BP neural network for calculation.

Table 2 Relative errors and correlation coefficients of predicted shear wave velocity and measured velocity
Fig.8 shows the prediction results of the trained BP neural network with well A data as input. (a) is the P-wave velocity of the organic shale reservoir, (b) is the S-wave velocity of the organic shale reservoir, (c) is pore aspect ratio and (d) is kerogen porosity. Among them, the pore aspect ratio distribution is relatively stable, which is consistent with the variation trend in Fig.7c. The volumetric fraction of kerogen porosity in shale shown in Fig.8d is mainly between 0.02--0.04, which is basically consistent with the organic matter pores from geological studies. The relative error between the predicted value of the shear wave velocity of Well A and the actual value is 0.025, and the correlation coefficient is 0.988. The shear wave velocity curve predicted by the neural network agrees well with the measured shear wave velocity curve, indicating that the accuracy of the shear wave velocity prediction method based on BP neural network for the organic shale reservoirs is very high, which proves that this method is very effective in predicting shear wave velocity of organic shale reservoirs.
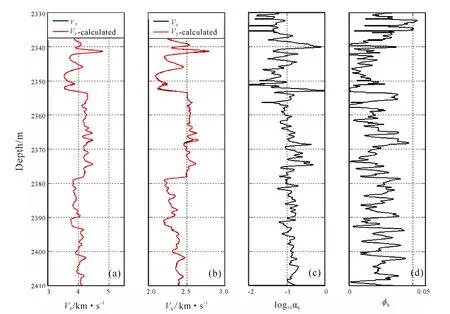
Fig.8 Prediction results for shale reservoir based on BP neural network
5 Conclusions
(1) This paper proposes two methods based on the petrophysical model and the BP neural network algorithm to estimate the shear wave velocity of organic shale. The former method establishes a quantitative relationship between the elastic modulus of equivalent shale and physical parameters such as pore aspect ratio, porosity and mineral composition based on the petrophysical model. The elastic modulus is used to calculate the P-wave and S-wave velocities and inverse the pore aspect ratio, which are then used as constraints to predict the shear wave velocity. The BP neural network method uses a large number of well log data, and the strong non-linear relationship between the shear wave velocity and other logging data is obtained by neural network training, and the shear wave velocity is subsequently predicted based on the trained relationship.
(2) According to the prediction results of shale in the Jiaoshiba area of Sichuan Province, the S-wave velocity results from both methods meet the accuracy requirements, especially the BP neural network me-thod, which has a high coincidence rate of S-wave prediction. The errors between calculated P-wave and S-wave velocities with measured ones are very small, so methods can be effectively applied to the prediction of S-wave velocity of organic shale.
杂志排行
Global Geology的其它文章
- Determining water well sites based on electrical structure in Taobei District of Baicheng
- Influence of wettability of shaly sandstone on rock electricity parameters
- U-Pb-Hf isotopes of Neoarchean Shuimowan tonalites in southern margin of North China Craton: constraints on petrogenesis
- Spatial pattern analysis of forest landscape in Changbai Mountain
- Method for extracting angle-domain common image gathers in Kirchhoff beam migration
- Controlling factors of sphalerite and galena deposition in Baiyinnuo’er skarn deposit, Inner Mongolia, China
