Establishment of a pattern recognition metabolomics model for the diagnosis of hepatocellular carcinoma
2020-09-23PengChengZhouLunQuanSunLiShaoLunZhaoYiNingLiXueGongFan
Peng-Cheng Zhou, Lun-Quan Sun, Li Shao, Lun-Zhao Yi, Ning Li, Xue-Gong Fan
Abstract
Key words: Hepatocellular carcinoma; Pattern recognition; Metabolomics; Biomarkers
INTRODUCTION
Hepatocellular carcinoma (HCC) is the fifth most common cancer and the third leading cause of death due to cancer worldwide[1]. In particular, approximately 50% of the total patients with HCC in the world are from China, owing to the highest carrier prevalence of hepatitis B[2-4]. Early diagnosis of HCC offers patients a better chance for long-term survival[5]. Although imaging technologies such as magnetic resonance imaging and ultrasonography, and serum biomarkers [notably α-fetoprotein (AFP)] are widely used to diagnose HCC in the clinic[6], they are far from satisfactory because they lack sensitivity and specificity[7]. Therefore, there is an urgent and unmet desire for novel screening methods and new biomarkers.
The emergence of metabolomics has provided a powerful tool for discovering novel biomarkers and revealing metabolic pathways of cancer and liver diseases[8,9]. A metabolomics approach to screen individual metabolites or their combinations for the diagnosis of HCC[10]identified a series of potential biomarkers including phenylalanyltryptophan, glycocholate, concanavanine succinic acid, bile acid, long chain fatty acid, and so on for future clinical application[5,7,11]. However, none of these markers have thus far been validated for clinical applications. Metabolomics datasets commonly contain hundreds to thousands of variables; however, biomarkers are identified using conventional data processing methods such as principal component analysis (PCA), partial least squares discriminant analysis (PLS-DA), orthogonal partial least squares discriminant analysis (OPLS-DA), and binary logistic regression[11,12]. With the advent of data processing technology to handle big data, it is incumbent upon researchers in this area to adopt advanced methods such as pattern recognition to seek new biomarkers and to establish mathematical models that facilitate screening for HCC.
In previous studies, we established a pattern recognition metabolomics method based on sequential feature selection combined with linear discriminant analysis (LDA) to evaluate the severity of fulminant hepatic failure and for the differential diagnosis ofClostridium difficileinfection[13,14]. In the current study, ultra-performance liquid chromatography-mass spectroscopy (UPLC-MS) was used to characterize the serum metabolomes of patients with HCC, patients with cirrhosis, and healthy controls. Furthermore, the pattern recognition method developed herein was used to process multivariate data with the aim of developing a novel metabolomics diagnostic model and identifying novel biomarkers for HCC screening purposes.
MATERIALS AND METHODS
Patients and samples
Between March and August 2016, samples from patients who met the inclusion criteria of HCC diagnosis set by the Ministry of Health were collected[15]. HCC confirmation required histological evidence or two different imaging techniques, or the combination of one imaging technique and an AFP level of > 400 ng/mL. Patients with cirrhosis meeting the criteria described elsewhere[16]based on clinical manifestations, laboratory examinations, and imaging results were included. HCC patients (C group,n= 30) all had cirrhosis, and cirrhosis patients without HCC were included in Y group (n= 29). The Child-Pugh Score in patients in the C group and Y group patients was A or B. Healthy controls (N group,n= 31) were chosen from the general population. The exclusion criteria were Child-Pugh Score C patients, malignant neoplasm (except HCC for C group), metabolic diseases, autoimmune disease, excess alcohol consumption, and known history of toxic exposure. Whole blood samples (3-5 mL) were collected on an empty stomach in the morning in BD Vacutainer®blood specimen collection tubes (Weigao Group, Weihai, China). Whole blood samples were stored at 4°C immediately after collection and were transported to the laboratory in < 30 min. After centrifugation at 3000 × g for 10 min at 4°C, a portion of the serum from the samples was used for biochemical assays and the remaining serum was aliquoted into fresh Eppendorf®tubes and stored at -80°C for metabolomic analysis. Fresh surgical tumor tissue samples were obtained from patients following informed consent.
Virology, biochemical parameters, and histopathology assay
Hepatitis B virus (HBV) and HCV antigens and a biochemical panel including alanine aminotransferase, aspartate aminotransferase, glutamic-oxaloacetic transaminase, total bilirubin, direct bilirubin, total protein, and albumin were assayed in the clinical laboratory. Histopathological samples were prepared as described previously[13].
Chemicals and reagents
Acetonitrile and methanol (HPLC grade) were purchased from Merck (Darmstadt, Germany). Distilled water was purified using a Milli-Q system (Darmstadt, Germany). Fatty acids, amino acids, bile acid, and nucleotide standards were purchased from Sigma-Aldrich (St. Louis, MO, United States). Citric acid, pantothenic acid, and malonic acid were purchased from Supelco (Bellefonte, PA, United States). Lysophosphatidyl cholines (LysoPCs) and lysophosphatidyl ethanolamine were purchased from Avanti Polar Lipids, Inc. (AL, United States).
Sample preparation
Prior to the assay, all samples were thawed on ice. Pooled aliquots (1 μL) of each sample formed the quality control (QC) sample. Metabolites in serum were extracted by methanol (serum/methanol (V/V) = 1:3). The mixture (100 μL) was vortexed for 60 s, and then centrifuged at 14000 ×gfor 10 min at 4°C. Supernatants were dried by nitrogen flow and then re-dissolved in 100 μL methanol. The mixture was again centrifuged at 14000 ×gfor 5 min at 4°C. The resulting clear supernatant was transferred into UPLC vials and stored at 4°C.
UPLC-MS assay
An aliquot (2 μL) of the clear supernatant obtained above was chromatographed on a Thermo Fisher Scientific UltiMate 3000 UPLC system using an ACQUITY UPLC BEH C18 analytical column (i.d. 2.1 mm × 100 mm, particle size 1.7 mm, pore size 130 A˚). Mobile phase A and mobile phase B were water/formic acid (99.9: 0.1, V/V) and acetonitrile/formic acid (99.9: 0.1, V/V), respectively, and the flow rate was 200 μL/min. A linear gradient was optimized as follows: the initial composition of the mobile phase was 95% A and 5% B; 0-2 min, 95% A; 2-9 min, 95%-62% A; 9-14 min, 62%–32% A; 14-22 min, 32%-0% A; 22-30 min, 0-95% A. The column eluent was directed to the mass spectrometer for analyses.
Mass spectrometry was performed on a Thermo Fisher Scientific Q-Exactive Focus Mass Spectrometer operating in positive ion electrospray mode. The instrument parameters were set as follows: Mass range scanned from 50 to 1000, spray voltage was 4000 V, atomization temperature was 300°C, nebulizer pressure was 45 bar, capillary temperature was 350°C, and the capillary voltage was set to 4.00 kV; the sampling cone voltage was set to 35.0 V. The instrument parameters for MS/MS analysis were set at different collision energies according to the stability of metabolites (collision energy was set from 15 to 35 eV).
Five injections of QC samples were performed to equilibrate the UPLC-MS systems prior to testing individual patient samples. QC samples were injected after every six patient samples at regular intervals throughout the analytical run. Patient samples were tested in a random manner.
Data processing and statistical analysis
The raw UPLC-MS data of the samples were extracted using MZmine2.3 software and Xcalibur software (Thermo Fisher Scientific), which enabled detection, integration and normalization of the intensities of the peaks to the sum of peaks within the sample and to create a multivariate dataset containing the retention time, m/z, and relative abundances. The parameters were set as follows: Retention time ranging from 0 to 30 min, mass range m/z from 50 to 1000, and mass tolerance at 0.05 Da. For peak integration, peak width at 5% of the height was 1 s, peak-to-peak baseline noise was 0, peak intensity threshold was 100, and retention time window was 0.20 s.
The statistical analysis is shown in Figure 1. In brief, we used SIMCA-P + 12.0 software (Umetrics, AB, Sweden) to perform PCA, PLS-DA, and OPLS-DA. Pattern recognition analysis based on sequential feature selection combined with LDA for diagnosis of HCC, and the Z test [for comparison of area under curve (AUC)] were performed using Matlab Version 8.1 (R2013a) software (MathWorks Inc., Natick, MA, United States). One-way ANOVA, the Chi-square test, and Kruskal–Wallis test were conducted using SPSS v16.0 software (SPSS Inc. Chicago, IL, United States). Differences were considered statistically significant atP< 0.05.
Marker identification
The compounds were identified by searching the Human Metabolome Database (http://hmdb.ca/), PubChem compound database (http://www.ncbi.nlm.nih.gov), and our own compound database that includes metabolites previously identified by us. Finally, the compound was verified by comparing the mass spectra and retention time of potential biomarkers with authentic standards (Supplementary Figures 1-5).
RESULTS
Study population and clinical characteristics
Demographic data and clinical characteristics of the subjects are shown in Table 1. Thirty patients with HCC (all with cirrhosis, C group), 29 patients with cirrhosis (all without HCC, Y group), and 31 healthy controls (N group) were enrolled. There were no significant differences in age and sex among the three groups, and no significant differences in the causes of liver injury and Child-Pugh Score between C group and Y group. The levels of AFP, glutamic-oxaloacetic transaminase, and alanineaminotransferase were relatively higher and the level of albumin was relatively lower in patients with HCC than in patients with cirrhosis and healthy controls. The histopathology results of patients with HCC are shown in Supplementary Figure 6. We used the Chinese staging system to stage HCC[15], and 11 cases were stage IIIa, 12 cases were stageIIb, one case was stageIIa, 5 cases were stageIb, and one case was stageIa.

Table 1 General characteristics of patients and healthy controls
Quality control of UPLC-MS assay
QC samples clustered compactly in the middle of the PCA score plot (Figure 2A). The coefficient of variation (CV) of identified metabolites in QC samples ranged from 2.09% to 16.27% with a median CV of 7.83% (Table 2).
Metabolic profiles of serum samples
Patients with HCC, patients with cirrhosis, and healthy controls showed no significant differences in the base peak intensity chromatogram (Supplementary Figure 7). The three groups intermixed with each other in the PCA score plot, although there was a tendency to separate along PC1 (Figure 2B). Characterization of metabolic differences among the three groups using PLS-DA and OPLS-DA showed that the three groups also intermixed with each other in the PLS-DA score plot (Supplementary Figure 8). The PLS-DA score plot of the HCC groupvsthe cirrhosis group also intermixed with each other (Supplementary Figure 9). Validation plots of the PLS-DA models acquired through 20 permutation tests were used for cross-validation purposes (Supplementary Figures 10 and 11). Analysis of the PLS-DA score plot for all three groups revealed that R2 = (0.0, 0.401) and Q2 = (0.0, -0.35); cross-validation of the PLS-DA score plot of C group and Y group revealed that R2 = (0.0, 0.645) and Q2 = (0.0, -0.507). Although the PLS-DA model showed intermixing of the three groups, they could be separated in the OPLS-DA model (Figure 3A). OPLS-DA score plots of the HCC groupvshealthy controls (Figure 3B), the cirrhosis groupvshealthy controls (Figure 3C), and the HCC groupvsthe cirrhosis group (Figure 3D) demonstrated very clear separation. However, the R2 and Q2 values were not high enough in the three OPLS-DA models.
Biomarkers for HCC
Potential biomarkers were characterized by variable importance in the projection values retrieved from the PLS-DA model combined with the Kruskal–Wallis test (P<0.05). Potential biomarkers were identified by a preliminary search of the HMDB andPubChem compound databases and verified by comparing the mass spectra and retention time of potential biomarkers with authentic standards. As shown in Table 2 and Supplementary Figure 12, the levels of most metabolites, including proline, were lower in patients with HCC than in healthy controls and patients with cirrhosis (Figure 4A). However, the levels of glutamic acid, pyrrolidine, and damascenone were higher in patients with HCC than in healthy controls; glutamic acid, kynurenic acid, vanillic acid, and hydroxypurine (Figure 4B) were higher in patients with HCC than in patients with cirrhosis.
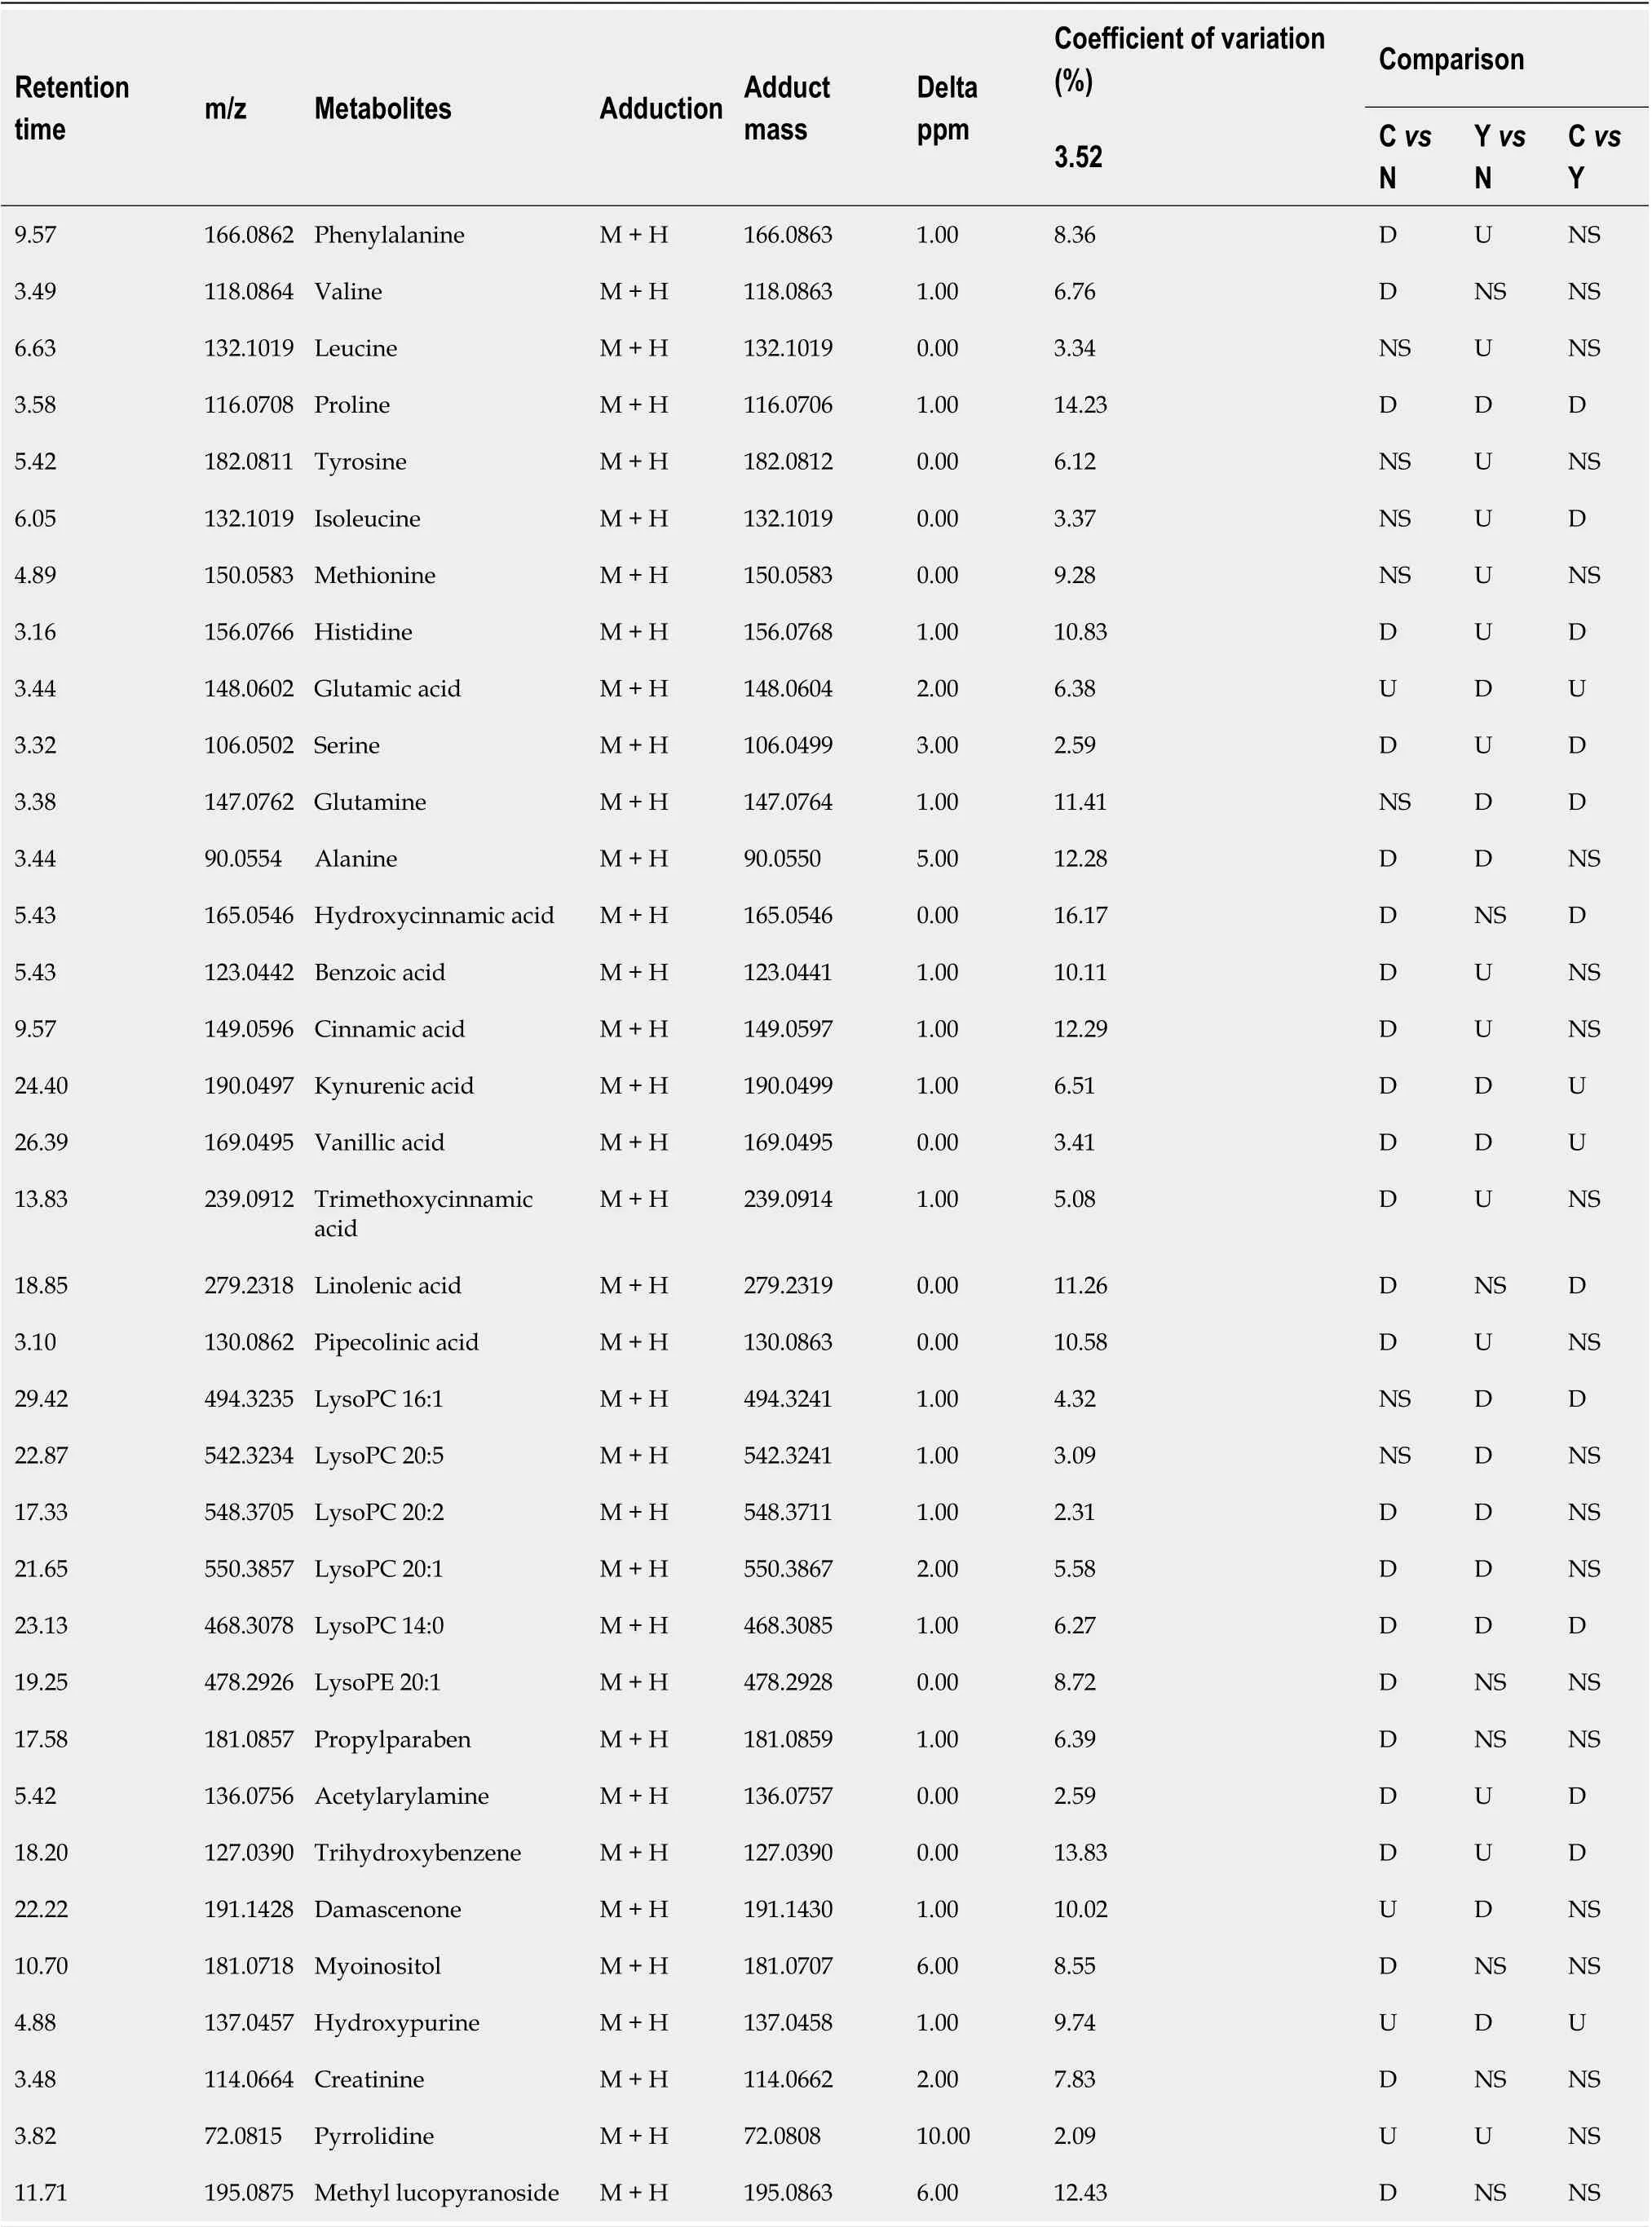
Table 2 Significantly altered metabolites

Pattern recognition for diagnosis of HCC

Figure 2 Principal component analysis. A: The principal component analysis score plot of all samples including quality control samples. R2X = 0.134 cum, Q2 = 0.106 cum; and B: The principal component analysis score plot of all three groups, hepatocellular carcinoma group (C group) cirrhosis group (Y group), and healthy controls (N group). R2X = 0.139 cum, Q2 = 0.103 cum. QC: Quality control; PCA: Principal component analysis; HCC: Hepatocellular carcinoma.
We intended to establish a PLS-DA model or OPLS-DA model with the aim of distinguishing patients with HCC from patients with cirrhosis. However, as the metabolomes of HCC and cirrhosis are not very different, the efficiency of the models was not robust enough to discriminate the two groups using ordinary PLS-DA or OPLS-DA models. Therefore, we used pattern recognition, an advance data processing method, to achieve our aim. To enable this, the dataset was randomly split into a training set and a validation set. The training set comprised 20 HCC samples and 20 cirrhosis samples, and the validation set comprised 10 HCC samples and nine cirrhosis samples. We used sequential feature selection to select the most suitable metabolites for constructing the best performing LDA model based on the training set. The validation set was used to confirm the reliability of the model for discriminating patients with HCC from patients with cirrhosis. When the metabolites hydroxypurine and proline were included in the LDA model, a differential distribution pattern between HCC and cirrhosis began to emerge in the LDA plot (Figure 5). The leaveone-out cross-validation analysis provided accuracy, sensitivity, specificity, a positive predictive value, and a negative predictive value of 95.00%, 100.00%, 90.00%, 0.91, and 1.00, respectively, for the training set, and 78.95%, 100.00%, 60.00%, 0.69, and 1.00, respectively, for the external validation set (Table 3). Validation of AFP as a biomarker to discriminate HCC and cirrhosis provided accuracy, sensitivity, specificity, a positive predictive value, and a negative predictive value of 65.00%, 30.00%, 100.00%, 1.00 and 0.59, respectively, for training samples, and 68.42%, 40.00%, 100.00%, 1.00 and 0.60, respectively, for test samples. For the training samples, the AUC in the LDA model (AUCLDA) was 0.90 (95%CI: 0.81–0.99,P< 0.05, Figure 6A), and AUCAFPwas 0.69(95%CI: 0.52–0.86,P< 0.05, Supplementary Figure 13); AUCLDAwas significantly more than AUCAFP(P< 0.05,Ztest). For validation samples, AUCLDAwas 0.84 (95%CI: 0.67–1.00,P< 0.05, Figure 6B), and AUCAFPwas 0.68 (95%CI: 0.41–0.94,P= 0.191, Supplementary Figure 14); AUCLDAwas significantly larger than AUCAFP(P< 0.05,Ztest).
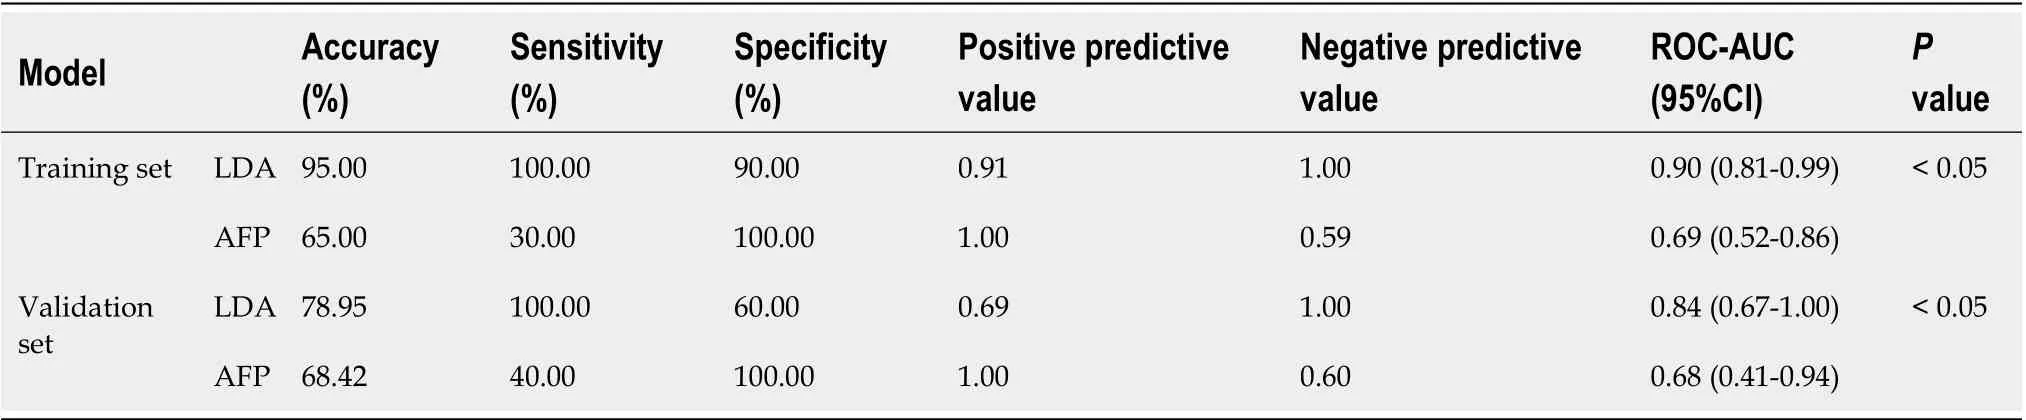
Table 3 The efficiency of the diagnostic model
DISCUSSION
In this study, the serum metabolomes of patients with HCC, patients with cirrhosis, and healthy controls were profiled by UPLC-MS to establish a metabolomics model for the diagnosis of HCC. This approach not only enabled elucidation of HCC pathogenesis but also provided a mathematical model based on possible biomarkers for screening HCC.
The stability of metabolomics data and the comparability of demographic data are the two crucial issues that should be considered prior to statistical analysis[17]. In this study, the reproducibility and stability of metabolomics data are reflected in the compact clustering of QC samples in the PCA score plot, as well as in the low CV of specific metabolites of the QC samples. There were no statistical differences in age and sex among the patients with HCC, patients with cirrhosis, and healthy controls. Also, the constituent ratio of etiology of liver injury (pathogenesis) was comparable between the HCC and cirrhosis groups, all of which confirm the reliability of the UPLC-MS assay and optimal homogeneity of baseline characteristics[9].
The liver is the principal organ for metabolism of carbohydrates, lipids, amino acidsetc[18]. Particularly in HCC, liver disease always results in apparent metabolic dysregulation[19], as in the case of glutamine addiction, a hallmark feature of HCC[20]. The decrease in serum metabolites in patients with HCC is largely due to uptake and utilization of metabolites by the tumor to feed its malignant behavior, as in the case of glutamine addiction[20]. This is evident in HCC tissue that has 20 times higher glutaminase 1 concentration than normal liver tissue[21], leading to 10 times faster consumption of glutamine resulting in diminished glutamine levels in the serum of patients with HCC. On the contrary, an increase in the concentration of serum metabolites in HCC may reflect tumor necrosis. The best illustration of this process is the increase in hydroxypurine in the serum of patients with HCC, likely due to the release of nucleic acids from tumor tissues, which then metabolizes into hydroxypurine under necrotic conditions[22].
Our findings are in line with previous studies that demonstrated diminished levels of serum phospholipid metabolites in patients with liver diseases (including HCC, liver cirrhosis, hepatitis, and liver failure)[7,9]. Indeed, through an untargeted metabolomics approach, we found significantly reduced amounts of phospholipid metabolites in patients with HCC. Reduced serum LysoPC, a molecule associated with malignancies, autoimmune disease, inflammation, and cell signaling[23], is an indicator of liver injury; LysoPC correlates with model for end-stage liver disease score, independently of age, sex, and diet. As the patients with HCC in our cohort also had concurrent liver cirrhosis, the serum LysoPC of C group was lower than that of healthy controls. However, since the severity of liver injury was similar between C and Y groups, the serum LysoPC concentration was not significantly different between these groups. Low levels of LysoPC may be attributed to the inhibition of phospholipase A2 or LCAT activity or perturbed LysoPC acyltransferase activity[7]. More recently, based on studies from our group and others, it was postulated that excessive consumption of LysoPC results in an anti-inflammatory response, leading to low levels of serum and severe immunosuppression in patients with liver diseases[9,23].

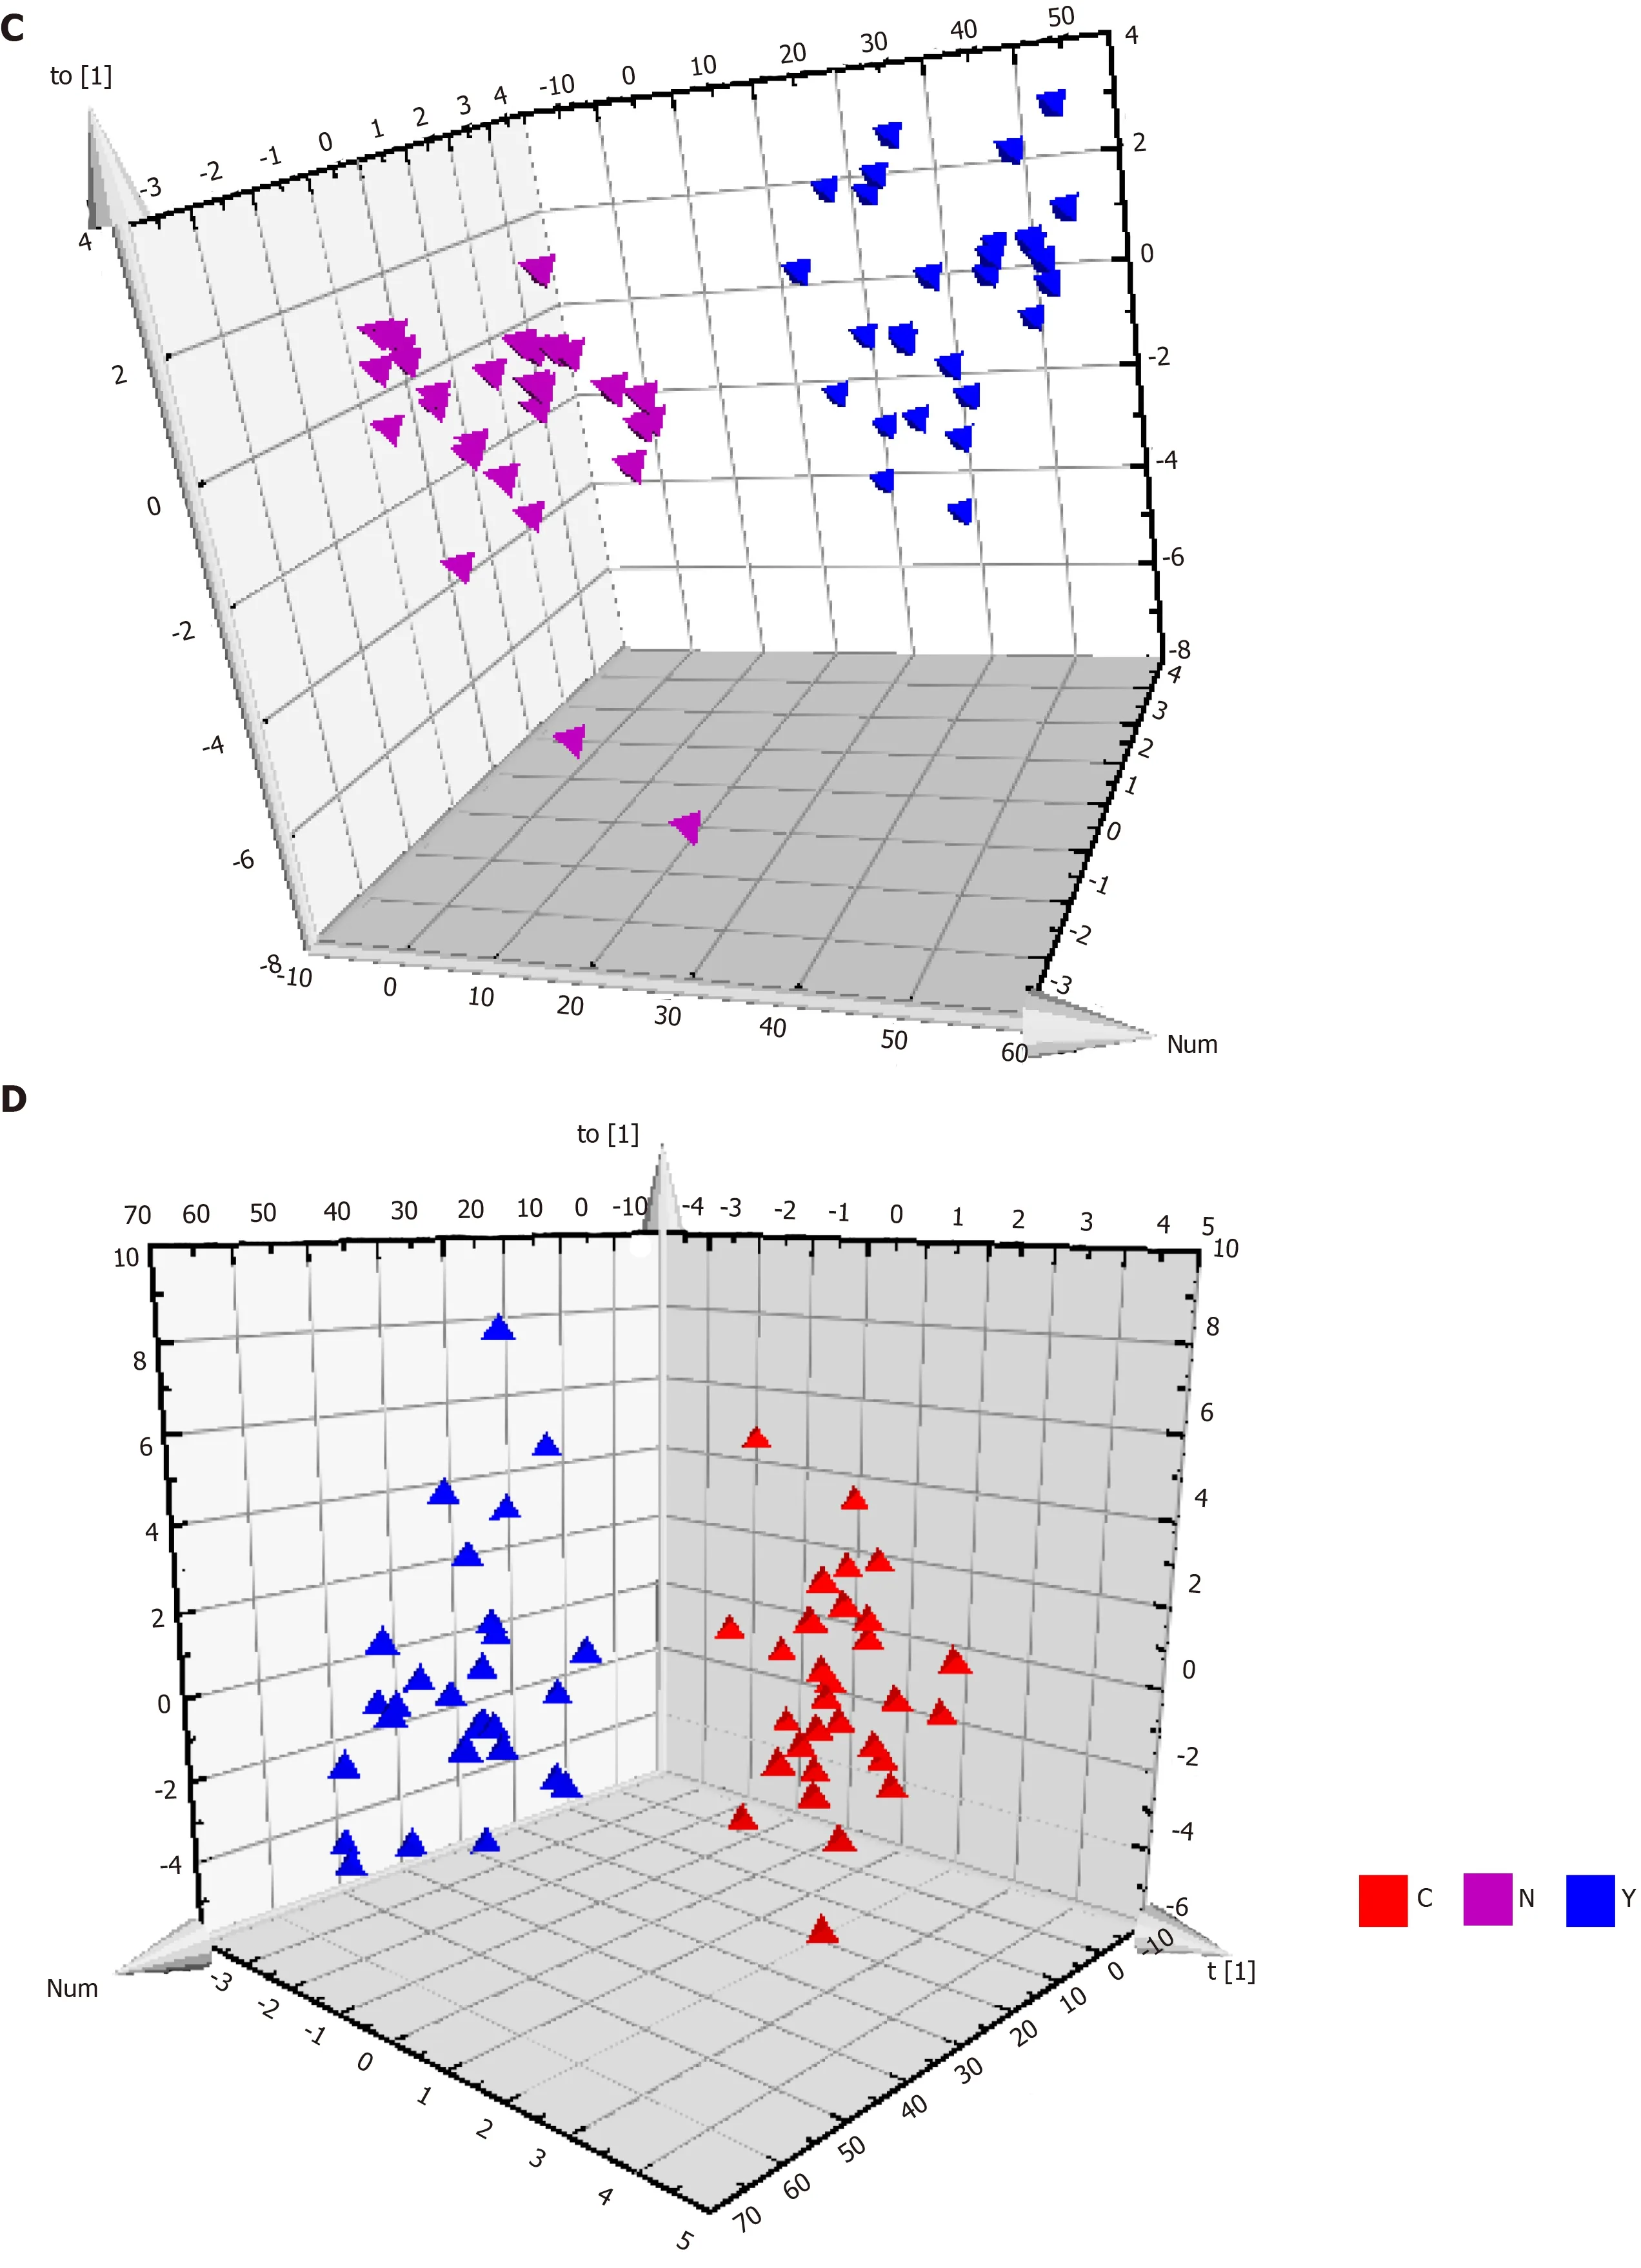
Figure 3 Metabolic profiles of serum from hepatocellular carcinoma patients, cirrhosis patients and healthy controls. A: The orthogonal partial least squares discriminant analysis (OPLS-DA) score plot for all the three groups. Model efficiency: R2X = 0.370 cum, R2Y = 0.838 cum, Q2 = 0.467 cum; B: The OPLS-DA score plot of C group and N group. R2X = 0.187 cum, R2Y = 0.790 cum, Q2 = 0.603 cum; C: The OPLS-DA score plot of Y group and N group. R2X = 0.559 cum, R2Y = 0.962 cum, Q2 = 0.696 cum; and D: The OPLS-DA score plot of C group and Y group. R2X = 0.274 cum, R2Y = 0.812 cum, Q2 = 0.358 cum. OPLS-DA: Orthogonal partial least squares discriminant analysis.
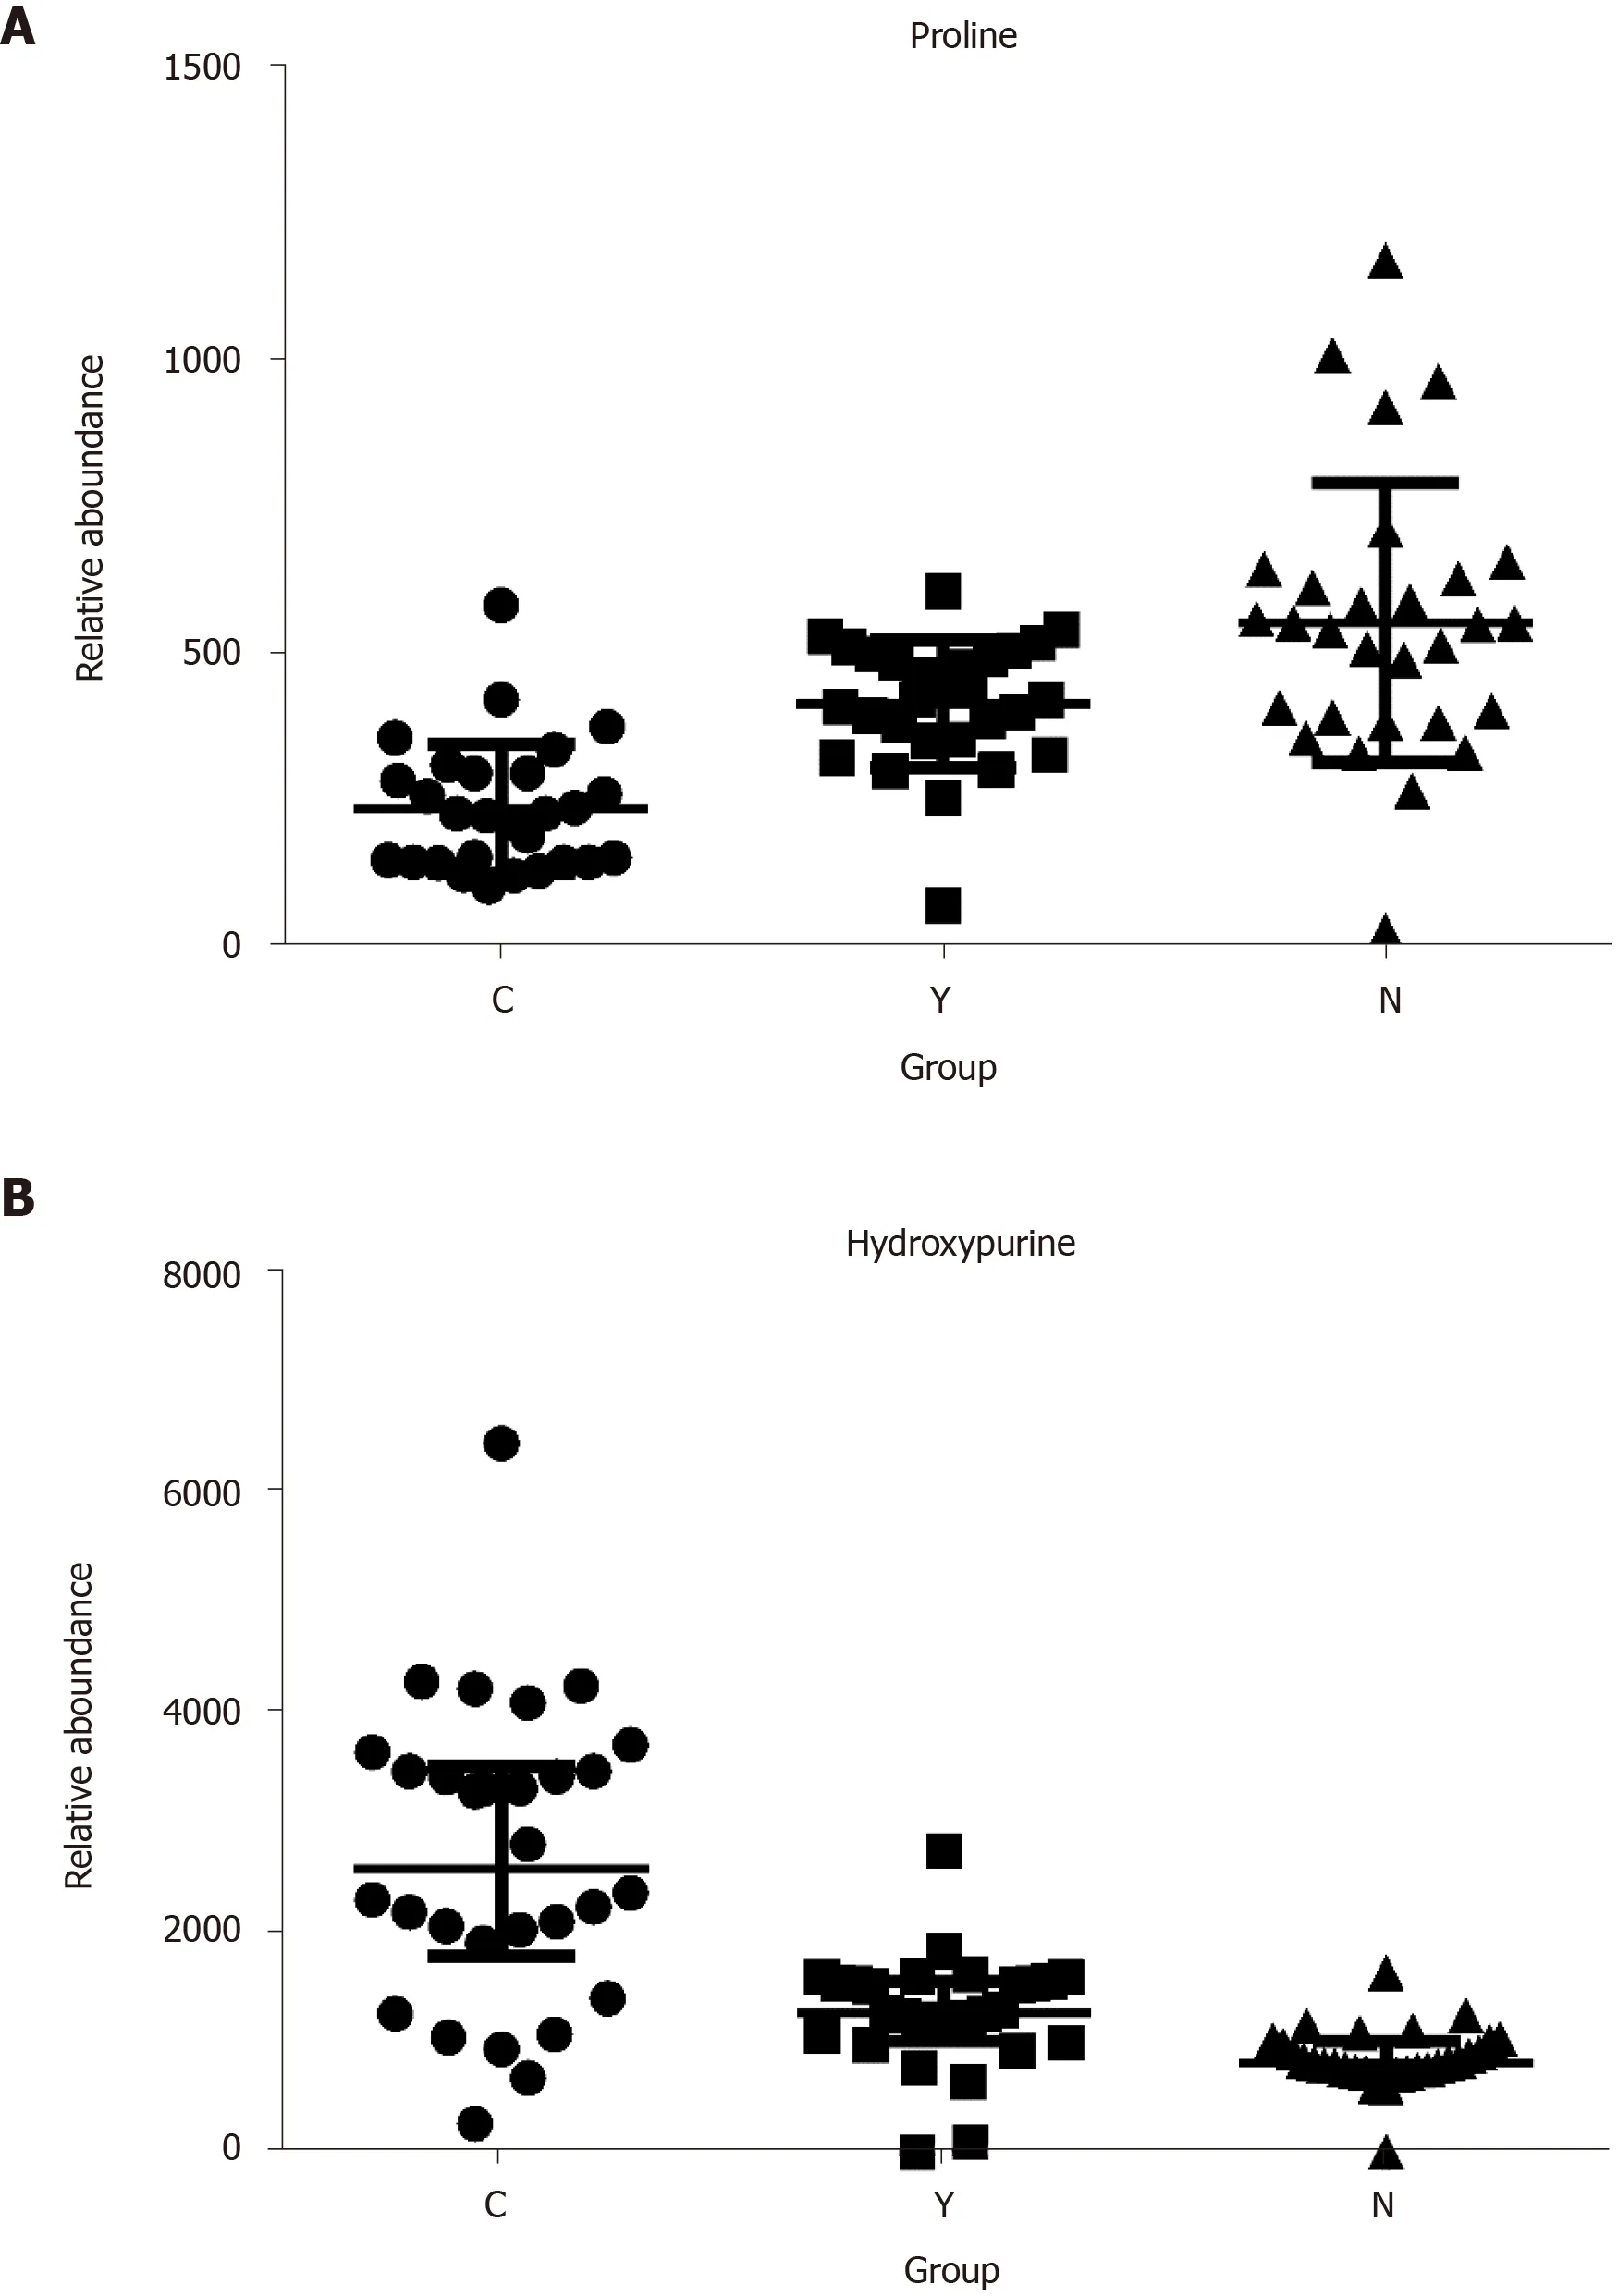
Figure 4 The relative abundance of proline and hydroxypurine in hepatocellular carcinoma patients, cirrhosis patients and healthy controls. A: Proline; B: Hydroxypurine. P < 0.05 in Kruskal-Wallis test in all three comparisons (C vs N, Y vs N, and C vs Y) of each metabolite.
The reduced levels of serum creatinine found in patients with HCC in this study may be attributed to the diminished hepatic conversion of creatine to creatinine in patients with hepatic disease[5]. Another reason may be the decrease in levels of serine and alanine, involved in the synthesis of creatine, in HCC[5]. Down regulation of fatty acids was also found in patients with HCC compared with cirrhotic patients and heathy controls. Fatty acids can be transported into the mitochondria for betaoxidation to generate adenosine triphosphate (ATP) energy, and its metabolism could be perturbed in patients with chronic liver disease[24]. Thus, we hypothesized that differential levels of metabolites in HCC may enable biomarker identification for the diagnosis of HCC.
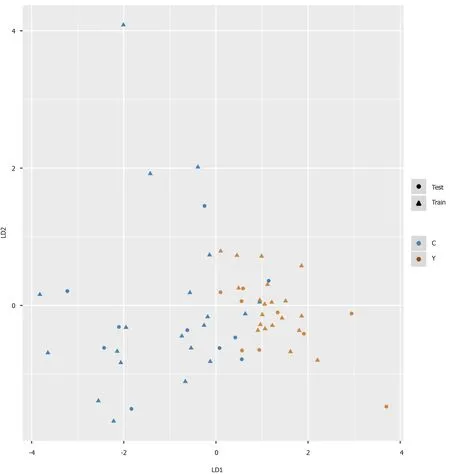
Figure 5 Pattern recognition for the diagnosis of hepatocellular carcinoma. Pattern recognition analysis based on sequential feature selection combined with linear discriminant analysis (LDA) was used to find the most suitable biomarkers for discriminating hepatocellular carcinoma patients from cirrhosis patients in the training set. The validation set was used to confirm the reliability of the model. Hydroxypurine and proline were included in the LDA model. Function 1 and function 2 are the first two eigenvectors. Hepatocellular carcinoma samples and cirrhosis samples demonstrated different distributions in the LDA plot.
As the PCA and PLS-DA models suffered from relatively poor efficiencies in our study and were overfit for the dataset, they were therefore unable to discriminate patients with HCC from patients with cirrhosis. Hence, a pattern recognition approach, based on sequential feature selection combined with LDA, was adopted to find the most suitable combination of biomarkers. This resulted in the generation of an LDA model for the diagnosis of HCC, which included two novel biomarkers, hydroxypurine and proline, highlighting the rapid growth and necrotic characteristics of HCC. As the accuracy, sensitivity, negative predictive value, and AUCLDAwere higher in the LDA model compared to those in the AFP diagnostic model, the relatively better efficiency of the LDA model could ensure proper discrimination of patients with HCC. However, the specificity and positive predictive value of the LDA model were lower than those in the AFP diagnostic model, suggesting that AFP remains a useful biomarker for discriminating patients with HCC from those with cirrhosis. If AFP levels reach the threshold of ≥ 400 ng/mL[15], patients are very likely to be diagnosed with HCC. Our results suggest that the two methods are complementary to each other, and the combination of the two approaches may offer better validation of diagnostic results. Further more, our findings indicated that pattern recognition analysis was better than conventional multivariate statistical analysis for data processing.
In conclusion, competitive access to nutrition and necrosis can be identified in HCC using a metabolomics model based on sequential feature selection combined with LDA, which may be an ideal method for novel biomarker discovery.

Figure 6 Receiver operating characteristic curve of the pattern recognition diagnostic model. A: Receiver operating characteristic curve for the training set of the linear discriminant analysis model. Area under the curve for the training set was 0.90 (95%CI: 0.81-0.99); B: Receiver operating characteristic for the validation (test) set of the linear discriminant analysis model. Area under the curve for the validation set was 0.84 (95%CI: 0.67-1.00).
ARTICLE HIGHLIGHTS
Research background
Early diagnosis of hepatocellular carcinoma (HCC) offers patients a better chance for long-term survival. The current biomarkers are far from satisfactory as they lack sensitivity and specificity. The emergence of metabolomics has provided a powerful tool for discovering novel biomarkers. In previous studies, we established a pattern recognition metabolomics method based on sequential feature selection combined with linear discriminant analysis for differential diagnosis.
Research motivation
There is an urgent and unmet desire for novel screening methods and new biomarkers for the diagnosis of HCC. Whether the pattern recognition method mentioned above could be used to establish a metabolomics model for the diagnosis of HCC is still unknown.
Research objectives
We aimed to use the pattern recognition method to develop a metabolomics diagnostic model and identify new biomarkers for HCC screening.
Research methods
We used ultra-performance liquid chromatography-mass spectroscopy to characterize the serum metabolome of HCC and cirrhosis patients. We then processed the multivariate data using sequential feature selection combined with linear discriminant analysis.
Research results
The concentrations of most metabolites, including proline, were lower in patients with HCC, whereas hydroxypurine levels were higher in these patients. As ordinary analysis models failed to discriminate hepatocellular carcinoma from cirrhosis, pattern recognition analysis was used to establish a pattern recognition model that included hydroxypurine and proline. The leave-one-out cross-validation accuracy and area under curve (AUC) were 95.00% and 0.90 (95% confidence interval (CI): 0.81–0.99) for the training set, respectively, and 78.95% and 0.84 (95%CI: 0.67–1.00) for the validation set, respectively. TheZtest revealed that the AUC of the model was significantly higher than the AUC (P< 0.05) in both the training and validation sets.
Research conclusions
Hydroxypurine and proline might be novel biomarkers for HCC, and the disease could be diagnosed by the metabolomics model based on pattern recognition.
Research perspectives
This study determined the applicability of the pattern recognition metabolomics model for the diagnosis of HCC. Two novel biomarkers for HCC were also found. Future studies should verify the validity of the model and the applicability of the biomarkers in the early diagnosis of patients with HCC.
杂志排行

World Journal of Gastroenterology的其它文章
- Current understanding of the metabolism of micronutrients in chronic alcoholic liver disease
- Monocyte-to-lymphocyte ratio as a prognostic factor in peripheral whole blood samples of colorectal cancer patients
- Clinical and prognostic significance of CC chemokine receptor type 8 protein expression in gastrointestinal stromal tumors
- Initial experience of single-incision plus one port left-side approach totally laparoscopic distal gastrectomy with uncut Roux-en-Y reconstruction
- Feasibility and efficacy evaluation of metallic biliary stents eluting gemcitabine and cisplatin for extrahepatic cholangiocarcinoma
- Impact of interval between neoadjuvant chemoradiotherapy and surgery in rectal cancer patients