Fluid inclusion and H-O isotope study of the Jiguanshan porphyry Mo deposit, Xilamulun Metallogenic Belt: implications for characteristics and evolution of ore-forming fluids
2020-09-13ChanghongWangKeyongWangWenyanCaiJianLiHanlunLiuYicunWang
Changhong Wang · Keyong Wang,2,3 · Wenyan Cai · Jian Li · Hanlun Liu ·Yicun Wang
Abstract We studied the fluid inclusions of the Jiguanshan Mo deposit in China, which is a large porphyry deposit located in the southern Xilamulun Metallogenic Belt. The irregular Mo ore body with various types of hydrothermal veinlets is hosted by Late Jurassic granite porphyry. Intense hydrothermal alterations in the deposit from the core to margin are silicification-potassium feldspar alteration,pyrite-quartz-sericite-fluorite alteration, and propylitic alteration. Based on the mineral assemblages and crosscutting relationships of ore veins, the ore-forming process were divided into three stages and two substages: quartzpyrite veins (stage I) associated with potassic alteration;quartz-molybdenite-chalcopyrite-pyrite veins (substage II-1) and quartz-molybdenite-fluorite veins (substage II-2)associated with phyllic alteration; and fluorite-quartzcarbonate veins (stage III) with carbonation. Five major fluid inclusions (FIs) types were distinguished in the quartz associated with oxide and sulfide minerals, i.e. polyphase brine (Pb-type), opaque-bearing brine (Ob-type), solid halite (S-type), two-phase aqueous (A-type), and vapor (V-type) inclusions. The FIs of stage I were composed of liquid-rich S-, A-, and V-type FIs with homogenization temperatures and salinities of 490 to 511 °C and 8.9 to 56.0 wt% NaCl equiv., respectively. The FIs of substage II-1 are composed of Pb-, Ob-, S-, A-, and V-type FIs with homogenization temperatures and salinities of 352 to 460 °C and 3.7 to 46.1 wt% NaCl equiv, respectively. The FIs of substage II-2 are Ob-, S-, A-, and V-type FIs with homogenization temperatures and salinities of 234 to 309 °C and 3.7 to 39.2 wt% NaCl equiv, respectively. The FIs of stage III are A-type FIs with homogenization temperatures and salinities of 136 to 172 °C and 1.1 to 8.9 wt%NaCl equiv, respectively. Fluid boiling, which resulted in the precipitation of sulfides, occurred in stages I and II. The initial ore-forming fluids of the Jiguanshan deposit had high temperature, high salinity, and belonged to an F-rich NaCl ± KCl-H2O system. The fluids gradually evolved to low temperature, low salinity, and belonged to a NaCl-H2O system. Studies of the hydrogen and oxygen isotope compositions of quartz (δ18OH2O = - 7.3 to 6.3‰,δDH2O = - 104.3 to - 83.3‰) show that the ore-forming fluids gradually evolved from magmatic water to meteoric water.
Keywords Fluid inclusions · Fluid inclusion assemblages ·H-O isotope · Xilamulun Metallogenic Belt · Porphyry Mo deposit
1 Introduction
The Xilamulun Metallogenic Belt (XMB), approximately 400 km long and 300 km wide, on the northern margin of the North China Craton (NCC), is an important Mo-Ag-Pb-Zn producer in China (Fig. 1; Zeng et al. 2012). The ore-forming epoch in the XMB includes three periods:260-220 Ma (Chehugou Mo-Cu and Kulitu Mo-Cu deposits), 160-150 Ma (Jiguanshan Mo and Nianzigou Mo deposits), and 140-120 Ma (Gangzi Mo, Liutiaogou Mo,Xiaodonggou Mo, Hongshanzi Mo-U, Aolunhua Mo-Cu,Banlashan Mo, and Haolibao Mo-Cu deposits). The majority of these deposits have been reported both in the Chinese and international literature (Fig. 1, Wan et al.2009; Zeng et al. 2011, 2012;Wu et al. 2011; Zhang et al.2009).
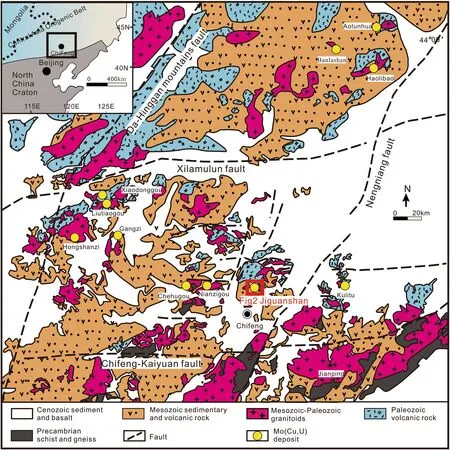
Fig. 1 Geological map of the XMB showing major lithological units, faults and a range of Mo-(Cu) deposits. (modified from Wu et al. 2014)

Table 1 Previous age determinations of JPMD granite porphyry and mineralization
The Jiguanshan porphyry Mo deposit (JPMD) is the largest deposit in the southern part of the XMB (Wu et al.2011). Previous studies yielding granite porphyry ages in the ranges of 223-248 Ma and 155-157 Ma (Table 1). The granite porphyry age of 155-157 agrees with the molybdenite Re-Os ages, which constrain the Mo mineralization by 150-155, indicating that two-period of granite porphyry divided into pre-ore granite porphyry(223-248 Ma) and host granite porphyry (155-157 Ma),moreover, the Mo mineralization in the Jiguanshan deposit occurred in the Late Jurassic.
With respect to the fluid characteristics, the JPMD is quite different from other porphyry Mo(-Cu) deposits,such as the Aolunhua (Ma et al. 2010) and Chehugou (Zeng et al. 2011) deposits in the XMB. However, the JPMD is similar to Climax-type deposits in the USA. i.e., Climax(Hall et al. 1974; Aude´tat 2015), Henderson (White et al.1981; Seedorff and Einaudi 2004), and Cave Peak (Aude´tat et al. 2008; Aude´tat 2010).
Although much research has been done in the JPMD, the study of fluid characteristics and the overall evolution have not been deeply elaborated. Therefore, the nature and evolution of ore-forming fluids in the JPMD has been reconstructed with an exhaustive fluid inclusion study. In this paper, we report a fluid inclusions study of various mineralization veins. Petrography and microthermometry are studied through fluid inclusion assemblages. We determined the sources of fluids by hydrogen and oxygen isotope analyses, analyzed the relationship between oreforming fluids and mineralization, and discuss the deposit formation mechanism for the JPMD.
2 Regional geology
The XMB is situated between the northern margin of the NCC and the Central Asian Orogenic Belt (Fig. 1; Wu et al. 2014). After the Indosinian-Yanshanian movement,the region entered an intracontinental orogenic stage, later overprinted by Paleo-Pacific subduction along the eastern Eurasian margin (Pei et al. 1998; Pirajno et al. 2009).Intense mantle-crust interaction, exchange of materials,and large-scale partial melting of the lower crust resulted in a new magma-fluid metallogenic system that was responsible for the widespread metal mineralization in the XMB(Mao et al. 1999; Zhai et al. 2003).
The XMB is mainly composed of Ordovician-Silurian metamorphic rocks, Permian volcanic and sedimentary rocks, and Jurassic volcanic and sedimentary rocks(BGMRIM 1991; Rui et al. 1994; Zhu et al. 2001; Zeng et al. 2010). The regional structures are mainly represented by E-W- and NE-SW-striking faults. The former is shown by the Chifeng-Kaiyuan fault and the Xilamulun fault,whereas the latter is represented by the Da-Hinggan Mountains fault and the Nenjiang fault (Wu et al. 2014).
The JPMD is situated in the southern part of the XMB and was affected by tectono-thermal events that occurred during the closure of the Paleo-Asian Ocean and later overprinted by the Yanshanian event and the Paleo-Pacific Ocean tectonic regime in the Jurassic (Wu et al. 2014).
3 Ore geology
The JPMD, located 35 km northeast of Chifeng city (Inner Mongolia), is a large porphyry molybdenum deposit. The total Mo resource is estimated at more than 100 Mt of ore with grades ranging from 0.08 to 0.11 wt% (Wu et al.2014).
3.1 Stratigraphy
In the Jiguanshan ore district, the stratigraphic sequence comprises volcanic sedimentary rocks, volcanic lithic tuff,rhyolitic volcanic. The rhyolitic volcanic rocks are of Middle Devonian (387-388 Ma) age, while the volcanic sedimentary rocks are Early Devonian (Wu et al. 2014).The rhyolitic volcanic rocks and volcanic lithic tuff are located in the center, while the volcanic sedimentary rocks are located at the margins (Fig. 2).
3.2 Structures
The JPMD faults are mainly represented by four groups that strike NE-SW, NW-SE, WNW-ESE, and ENEWSW. The ENE faults have strikes of approximately 80°,and the nearby rocks are characteristically brecciated. The WNW-ESE faults are filled by late fluorite veins cutting through the quartz porphyry and granite porphyry (Wu et al. 2011). The intersections of the four groups of faults control not only the output and distribution of the complex but also the spatial distribution of porphyry Mo mineralization (Fig. 2).
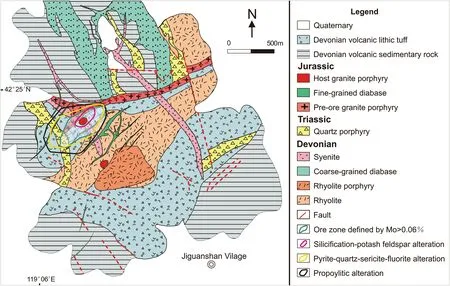
Fig. 2 Geologic map of the Jiguanshan porphyry Mo deposit. (modified from Wu et al. 2014)
3.3 Magmatic rocks
Magmatism was quite intense in the Late Jurassic, resulting in the emplacement of intrusions including fine-grained diabase (149 ± 0.9 Ma, Wu et al. 2011), pre-ore granite porphyry (223-248 Ma, Zeng et al. 2009; Wu et al. 2014),and host granite porphyry (155-156 Ma, Wu et al.2011, 2014).
The pre-ore granite porphyry trending approximately ENE-WSW is located in the central of the ore district. The host porphyry is buried under the pre-ore granite porphyry and rhyolitic volcanic rocks in the ore district with a small branch cropping out in the southeastern part of the deposit.
3.4 Characteristics of mineralization
Molybdenum mineralization is well developed in the granite porphyry, occurring in disseminated form and as veins in the rhyolitic volcanic rock, quartz porphyry syenite, and fine-grained diabase. Molybdenite Re-Os ages have yielded 153-155 Ma (Wu et al. 2011). The shape of the ore body is irregular. The main ore minerals are molybdenite, with minor chalcopyrite, pyrite, sphalerite,and magnetite. The gangue minerals are predominantly feldspar, quartz, and sericite with minor calcite and fluorite.
In the ore district, hydrothermal alteration is widespread with typical characteristics of porphyry deposits. Three alteration zones are recognized from the mineralized core to the margin: silicification-potassium feldspar alteration,pyrite-quartz-sericite-fluorite alteration, and propylitic alteration occur (Fig. 2). Silicification-potassium feldspar alteration occurs mainly in host granite porphyry and syenitic. This alteration is characterized by abundant quartz and K-feldspar with rare biotite and sericite; pyrite-quartzsericite-fluorite alteration is usually observed in the pre-ore granite porphyry, syenite, rhyolitic volcanic rocks, quartz porphyry, and fine-grained diabase. It is characterized by the appearance of pyrite, quartz, sericite, and abundant fluorite; propylitic alteration with carbonate, chlorite, and epidote usually presented in the quartz porphyry, finegrained diabase, rhyolitic volcanic rocks and their fractures.
Based on the ore mineral assemblages and crosscutting relationships, the ore-forming process can be preliminarily divided into three stages, and stage II can be further divided into two substages. These stages include the following:quartz-pyrite stage (stage I), quartz-molybdenite-chalcopyrite-pyrite stage (substage II-1), quartz-molybdenitefluorite stage (substage II-2), and fluorite-quartz-carbonate stage (stage III).
The earliest mineralization is the quartz-pyrite stage(stage I), which is mainly composed of white quartz veins with a small amount of disseminated coarse-grained pyrite(Fig. 3b). The alteration minerals are mainly K-feldspar with minor biotite and sericite. The quartz-molybdenitechalcopyrite-pyrite stage (substage II-1) is characterized by molybdenite occurring as stockwork, while chalcopyrite and pyrite occur disseminated in granite porphyry. The alteration minerals are sericite and pyrite.
The quartz-molybdenite-fluorite stage (substage II-2) is accompanied by a few pyrite grains. The alteration minerals are sericite and pyrite. The fluorite-quartz-carbonate stage (stage III), containing a very small amount of disseminated fine-grained pyrite, often cuts through the early stages (Fig. 3d). The main alteration mineral is carbonate.
4 Samples and analytical methods
4.1 Fluid inclusion analytical methods
Samples of fluid inclusions (FIs) were selected from quartz or fluorite veins of the three metallogenic stages. A detailed investigation of FIs in the quartz and fluorite crystals,including petrography and microthermometry, was conducted on 32 doubly polished thin sections. These investigations were performed at the Geological Fluid Laboratory, College of Earth Sciences of Jilin University,China. The microthermometric measurements were performed using a Linkam THMS-600 heating-freezing stage (from - 180 to + 550 °C) equipped with a Carl Zeiss Axiolab microscope with 10 × and 50 × ultralong working distance objectives. The heating rate was 5 °C/min during the initial stages and was reduced to 0.1 °C/min close to the phase transitions. The uncertainties of the measurements were 0.2 °C at temperatures <31 °C and 2 °C at temperatures >31 °C.
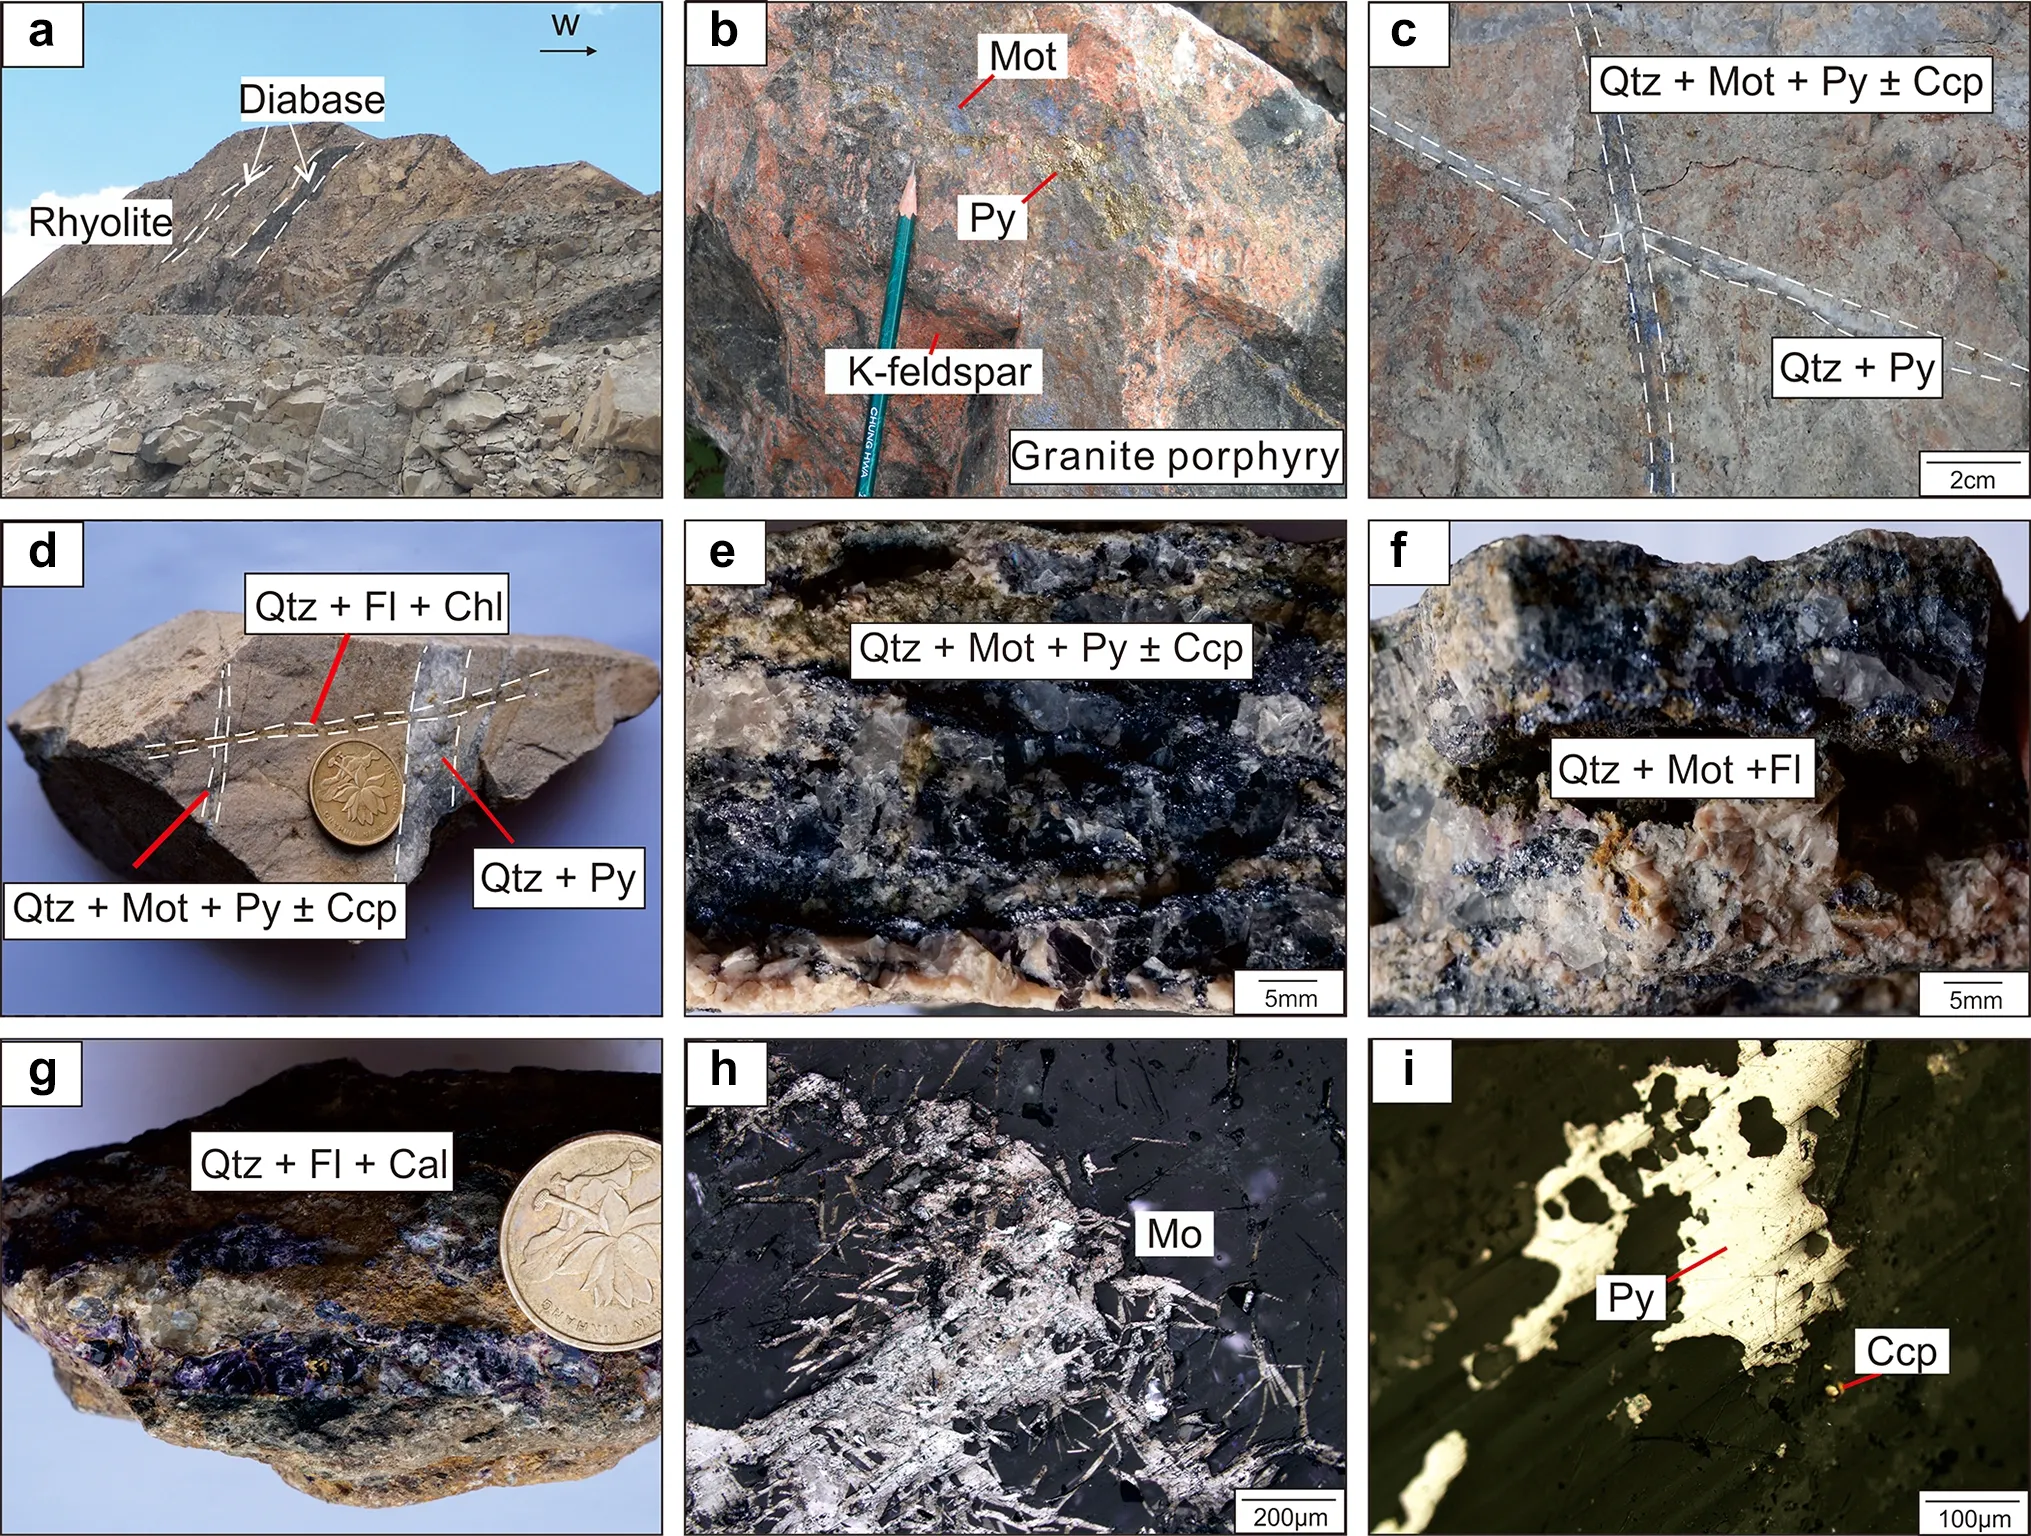
Fig. 3 Three stages of veins and their associated alterations. a NE-SW diabase intrudes rhyolite; b disseminated molybdenite, pyrite and K-feldspar alteration in granite porphyry; c Qtz + Py vein cut by Qtz + Mot + Py ± CCp vein; d Qtz + Py and Qtz + Mot + Py ± CCp veins cut by Qtz + Fl + Chl vein; e Qtz + Mot + Py ± CCp vein in potassic alteration zone; f Qtz + Mot + Fl vein in volcanic lithic tuff;g Qtz + Fl + Cal vein in volcanic lithic tuff; h foliated molybdenite from substage II-1; i pyrite and chalcopyrite particles from substage II-1;Coin = 2 cm. Abbreviations: Mot = molybdenite; Qtz = quartz.; Ccp = chalcopyrite; Py = pyrite; Cal = calcite; Fl = Fluorite
4.2 H-O isotope analytical methods
Ten ore-bearing quartz samples from the three metallogenic stages were selected for detailed hydrogen and oxygen isotope analysis. The H-O isotope analyses were accomplished using a MAT 253EM mass spectrometer at the Analytical Laboratory in the Beijing Research Institute of Uranium Geology, China National Nuclear Corporation(CNNC). Oxygen isotope analyses were carried out on 10 to 20 mg of quartz grains using the conventional BrF5method (Clayton and Mayeda 1963). The oxygen isotopes in quartz water were calculated from the oxygen isotopes of the analyzed quartz using the fractionation equation 10001nαquartz-water= 3.38 × 10⁶T-2- 3.40(Clayton et al. 1972). The hydrogen isotope compositions of fluid inclusions were determined by decrepitation of FIs in quartz samples. The oxygen and hydrogen isotope values are reported relative to the V-SMOW standard, and the analytical precision better than ± 0.2 ‰ for δ18O and ±2 ‰ for δD.
5 Results
5.1 Fluid inclusion types
Petrography and microthermometric study strictly concentrated on fluid inclusion assemblages (FIAs), i.e., closely associated groups or trails of inclusions with visually identical phase ratios and similar shapes (Goldstein and Reynolds 1994). Five types of fluid inclusions were distinguished according to the nature and volume proportions present at room temperature (Fig. 3).
The polyphase brine inclusions (Pb-type) contain a vapor bubble, an aqueous liquid, halite and up to four other transparent and opaque daughter phases at room temperature (Fig. 3a). The inclusions generally have irregular crystal shapes and are typically 20 to 60 μm in size. Sylvite crystals, as the only isotropic crystals other than halite and always as large as the halite crystals, are identified with certainty in only several inclusions. Metallic phases,including hematite (red, platy) and chalcopyrite (opaque,triangular), are usually present in Pb-type inclusions.
The opaque-bearing brine inclusions (Ob-type) contain a vapor bubble, an aqueous liquid, and a halite crystal plus opaque phases, one of which could be chalcopyrite (opaque, triangular) (e.g., Ulrich et al. 2002). The inclusions exhibit oval and irregular shapes, typically 10 and 30 μm(Fig. 4b).
The solid halite inclusions (S-type) contain a vapor bubble, an aqueous liquid, and one or two solid daughter minerals at room temperature (Fig. 4c). The inclusions exhibit oval and irregular shapes, slightly rounded to perfect negative crystal shapes, typically between 5 and 35 μ.The solid daughter minerals are mainly transparent, angular cubic shapes.
Aqueous inclusions (A-type) have high filling ratios,with VH2O/(VH2O+LH2O) <50 vol% (the majority are 10-30 vol%), and occur as irregular-shaped to rounded inclusions (Fig. 4d) in texturally late quartz crystals or as secondary inclusions in earlier quartz. They rarely are larger than 10 μm. They occur in isolation or as clusters along healed crystals and homogenize to liquid during heating (Fig. 4e).
Vapor-rich inclusions (V-type) consist of two phases at room temperature, vapor and liquid water, with VH2O/(VH2O + LH2O) >50 vol% (the majority are 75-90 vol%). These FIs are round or oval in shape and generally 5 to 20 μm in size.
5.2 Relative timing of FIA entrapment
The sequence of fluid entrapment was inferred from the distribution of inclusion assemblages in veins of different ore-forming stages, from petrographic observations of crosscutting trails of inclusions along individual fractures(Ulrich and Heinrich 2001). However, the commonly random distribution of fluid inclusions made the determination of relative timing between FIAs very difficult.
In stage I, a S-type FIA (a3) is cut by a similar trail with a small A-type FIA, indicating that the S-type FIs formed earlier than the A-type FIs (Fig. 4i); there are no crosscutting relationships between vapor and others inclusion assemblages.
In substage II-1, rare crosscutting relationships between inclusion trails indicate that S-type FIAs (a11) formed earlier than Ob-type FIAs (a10), (Fig. 4j) and that S-type FIAs (a13) formed earlier than A-type FIAs (a9) (Fig. 4k,n).
In substage II-2, A-type assemblages cutting through V-type assemblages indicate that A-type FIAs (a15) generally formed earlier than V-type FIAs (a14) (Fig. 4l). Obtype trails (a17) coexist with V-type inclusions in boiling assemblages (Fig. 4m).
Stage III includes only one type of FIA, precluding the relative timing of fluid entrapment.
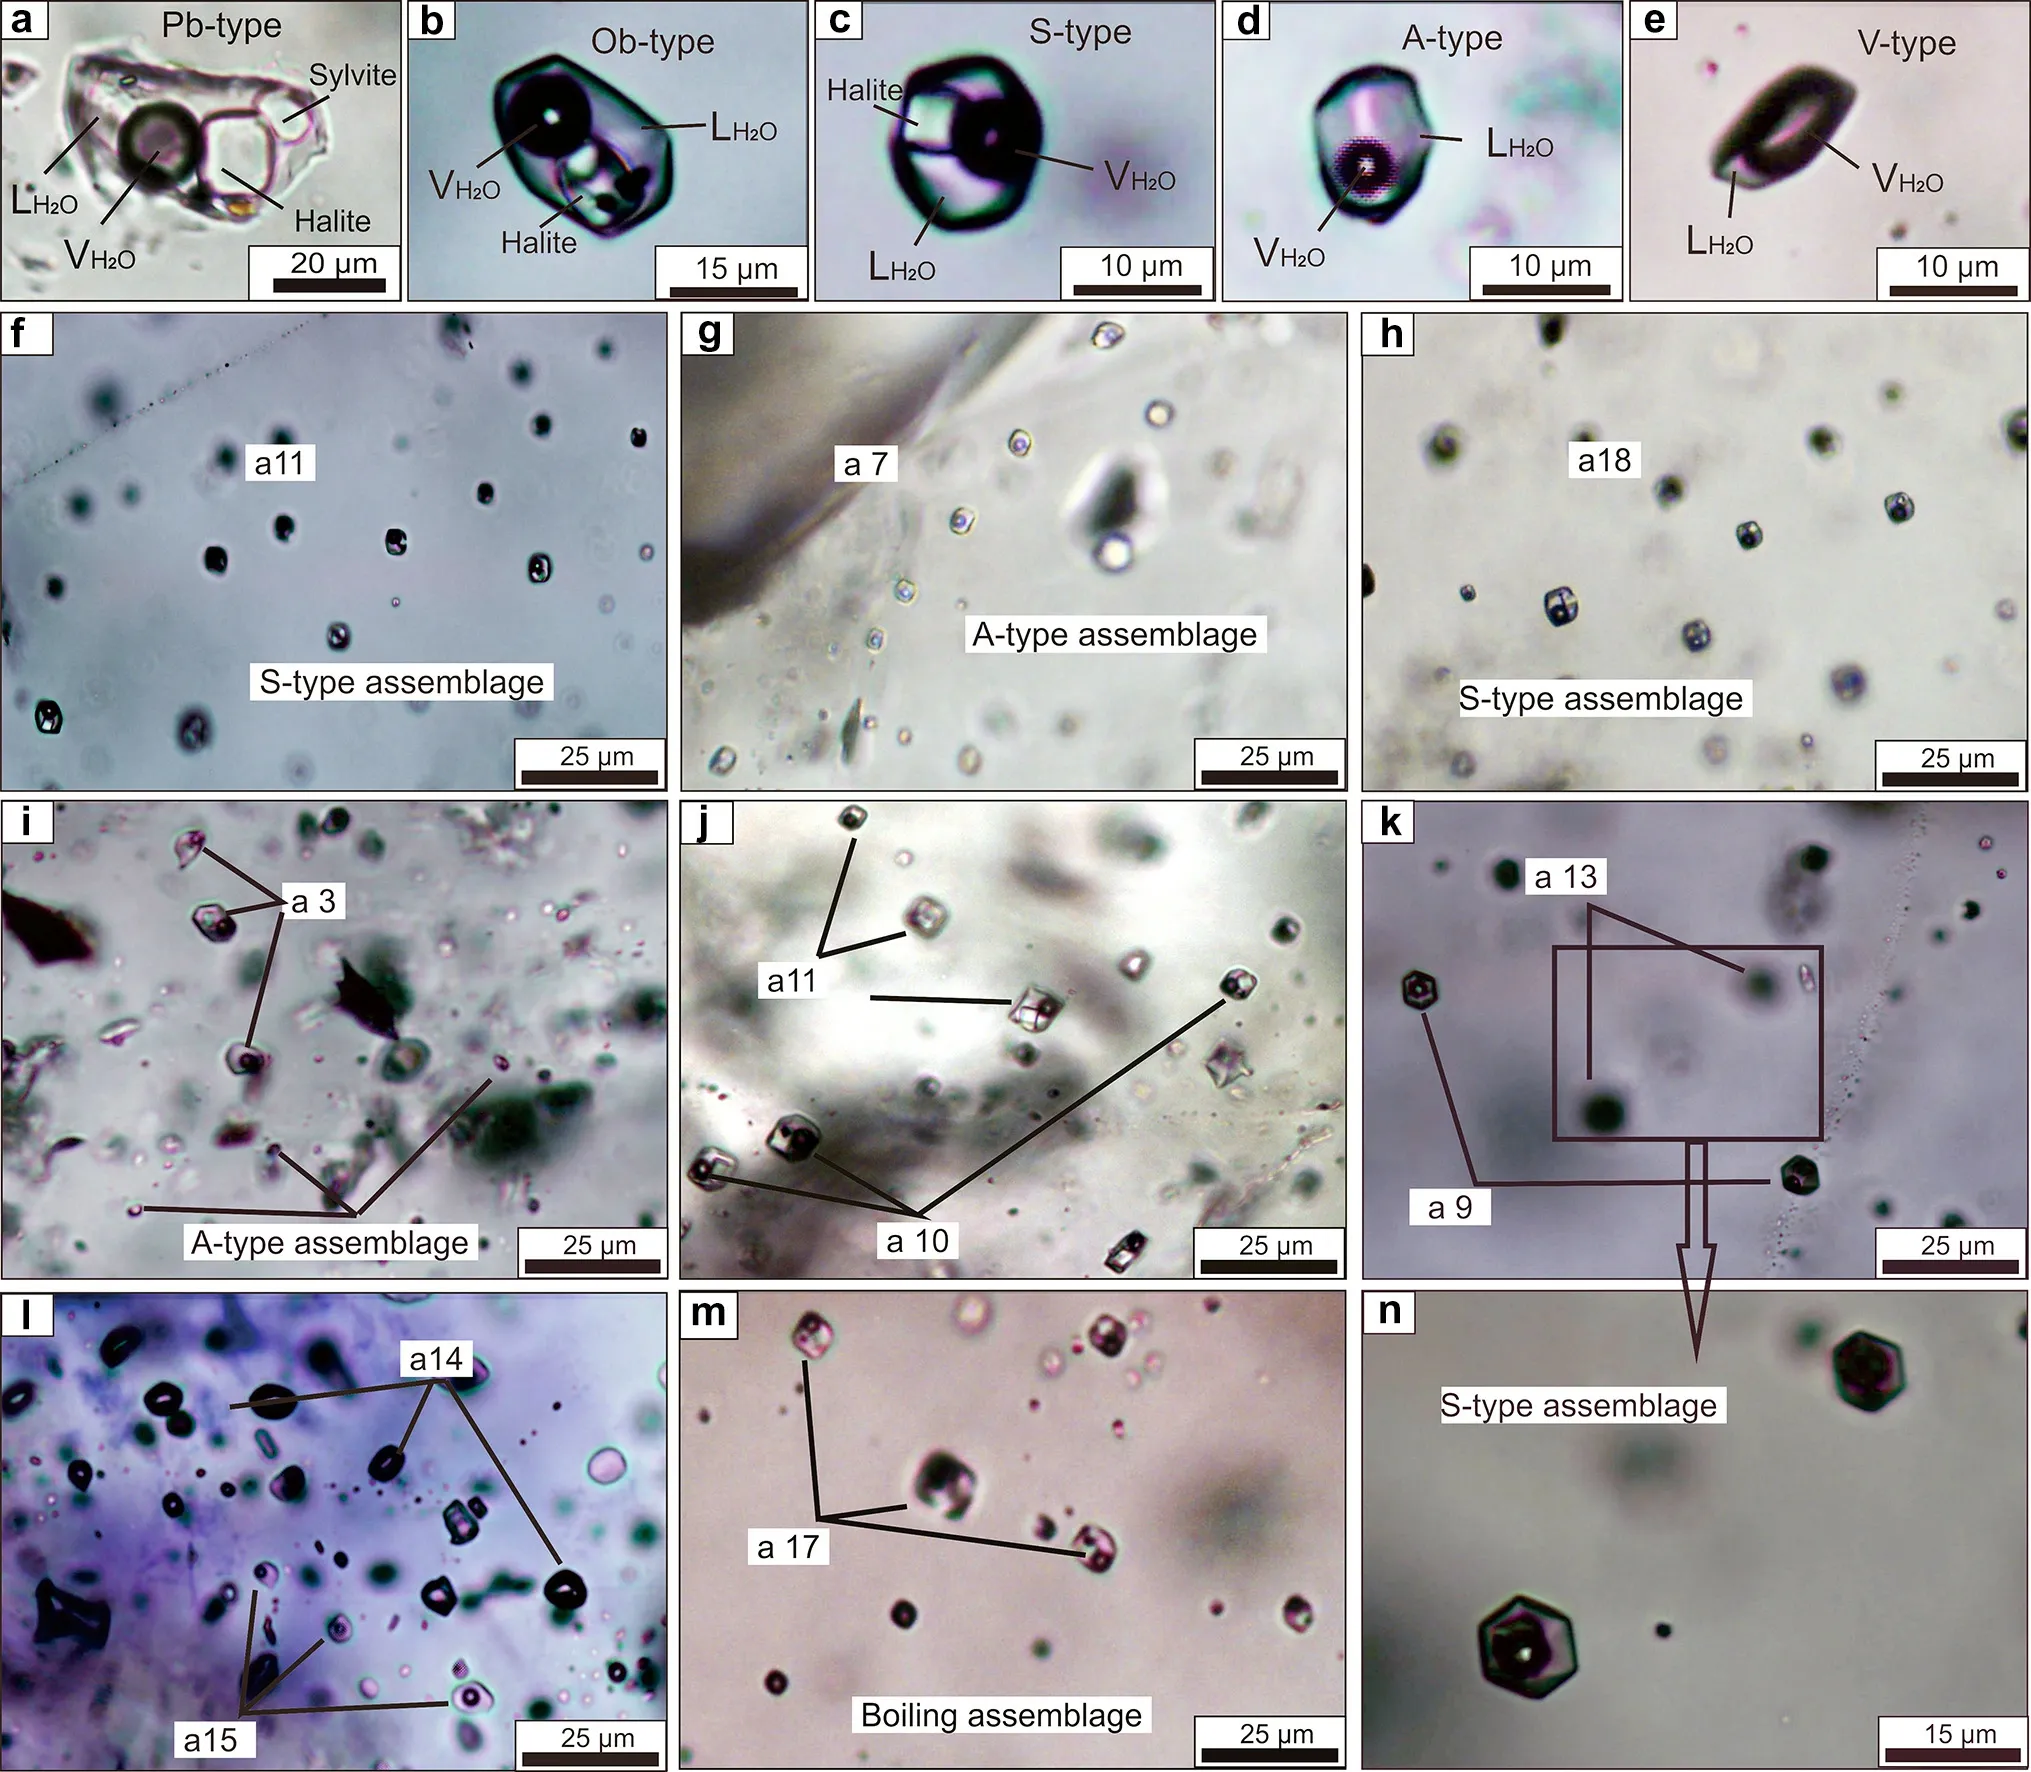
Fig. 4 Photomicrographs of inclusion types and relative timing among assemblages. a Polyphase brine inclusion; b Opaque-bearing brine inclusion; c solid halite inclusion; d Two-phase aqueous inclusion; e Vapor inclusions; f A S-type trail (substage II-1); g An A-type trail(substage II-1); h A S-type trail (substage II-2); i A S-type trail cut by an A-type trail with small inclusions (stage I); j A S-type trail cut by an Ob-type brine trail (substage II-1); k A S-type trail cut by a similar trail with small aqueous inclusions (substage II-2); l A vapor trail cut by an A-type trail trail (substage II-2); m Ob-type trails coexisting with vapor inclusions in boiling assemblages (substage II-2); n The details of S-type trail in Fig. 4k
5.3 Microthermometry
The microthermometric data for FIAs from the three different stages of mineralization are summarized in Table 2 and shown in Fig. 5. Nomenclature of fluid inclusion measurements shown in Table 3. Homogenization of the Ob-type and S-type FIAs occurs either by halite melting or to liquid (Tm(halite) >Th(L) or Th(L)) (Fig. 5).
The total salinities of the fluids (expressed as wt% NaCl equiv.) were calculated on the basis of the ice-melting temperatures in A- and V-type FIs and the halite dissolution temperatures in S-type FIs in the NaCl-H2O system (Hall et al. 1988).
5.3.1 Stage I
A-, V- and S-type FIAs were identified in quartz crystals of stage I (Fig. 4i).
During the freezing to heating process, observing the final ice-melting temperature for most of the V-type FIs was difficult; only a few final ice-melting temperatures(Tm-ice) were observed (a1) that ranged from -8.4 to- 9.2 °C, with calculated salinities of 12.2-13.1 wt%NaCl equiv. Sample a1 was homogenized to a vapor phase at temperatures varying from 492 to 511 °C (Fig. 5, a1).
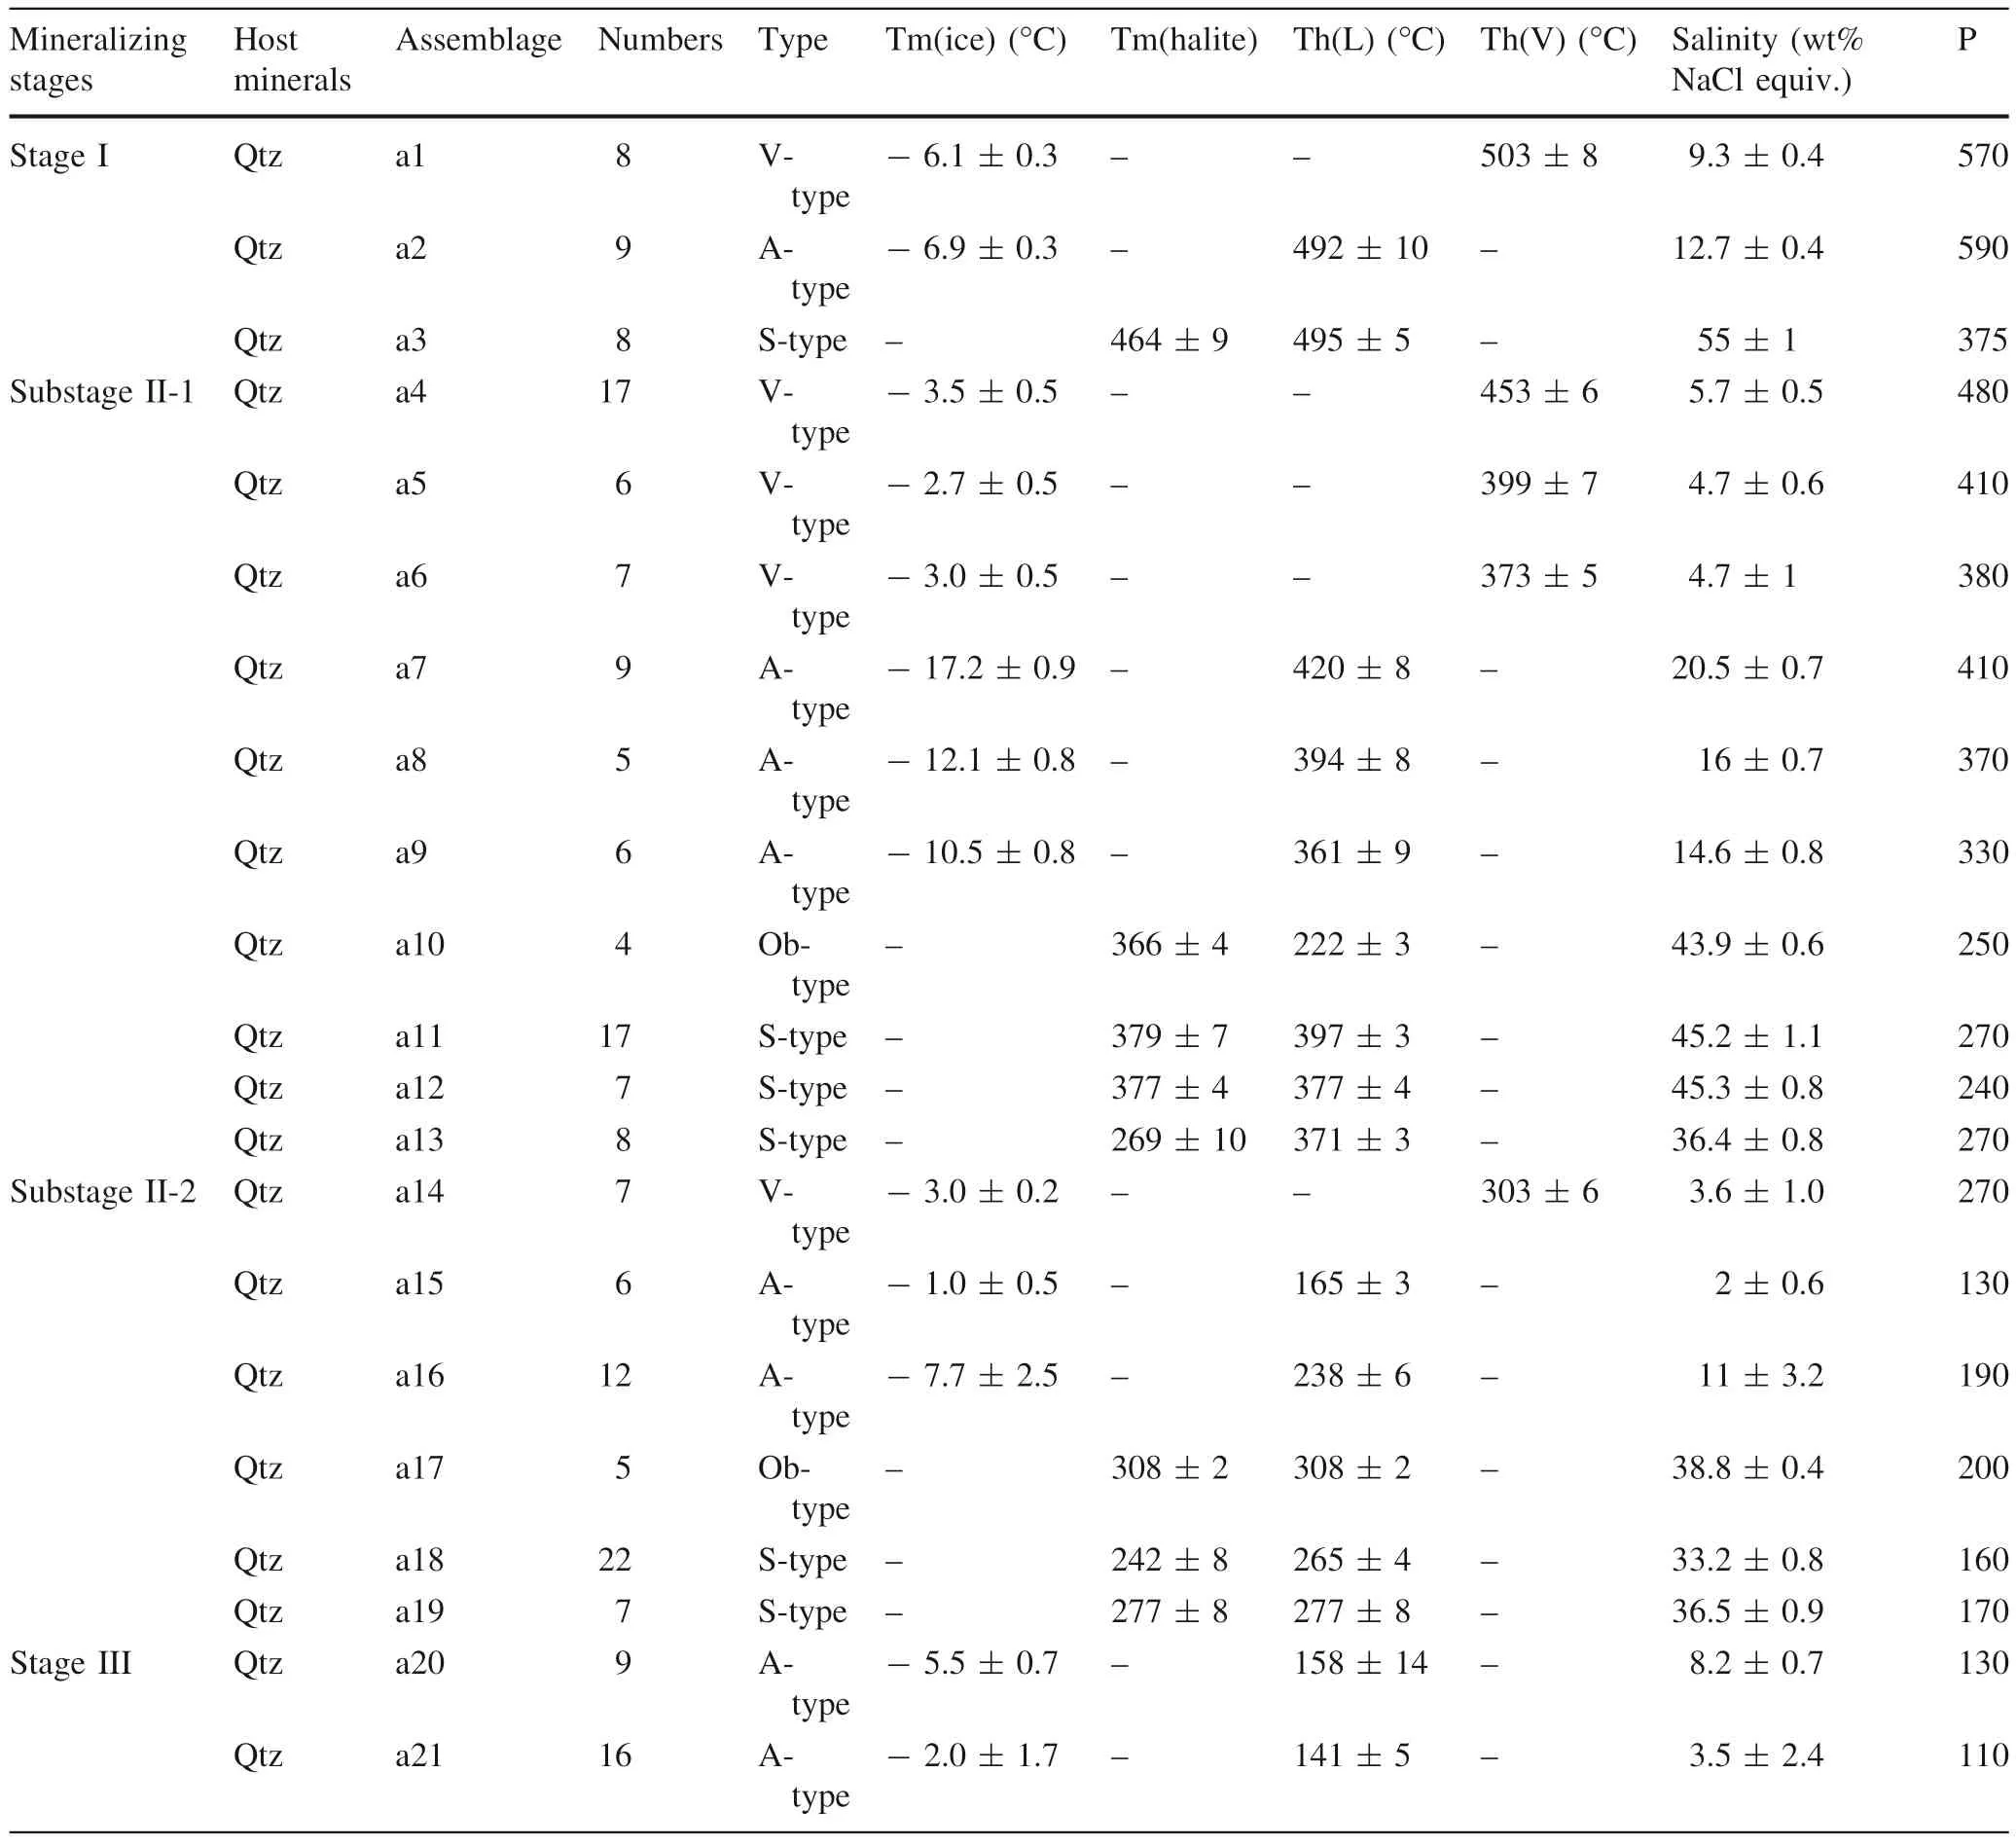
Table 2 Microthermometric data of FIAs in quartz from the JPMD and pressure estimates
The A-type FIAs (a2) yielded final ice-melting temperatures (Tm-ice) of - 7.1 to - 6.6 °C, with calculated salinities of - 10 to - 10.6 wt% NaCl equiv. These FIs were homogenized to a liquid phase at temperatures ranging from 495 to 510 °C (Fig. 5, a2).
For the S-type FIAs (a3), the halite daughter mineral dissolved at temperatures [Tm(halite)] ranging from 490 to 501 °C, after the vapor bubble disappeared, and their salinities were estimated as 54-56 wt% NaCl equiv.(Figs. 4i; 5a3).
5.3.2 Substage II-1
V-, A-, Ob-, and S-type FIAs were identified in quartz crystals of substage II-1 (Fig. 5a). It is worth emphasizing that Pb-type inclusions always occur as single inclusions randomly distributed in this stage, and there is no assemblage of this type.
For the V-type FIAs (Fig. 5, a4, a5, a6), final icemelting temperatures (Tm-ice) were observed that ranged from - 4 to - 2.2 °C, with calculated salinities of 3.7-6.2 wt% NaCl equiv. These V-type FIs were homogenized to a vapor phase at temperatures varying from 379.3 to 457.6 °C.
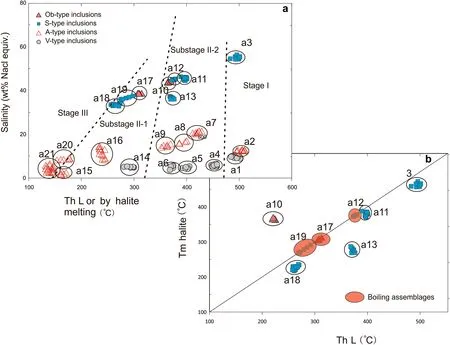
Fig. 5 a Salinity and final homogenization temperature (to liquid or by halite melting) for all inclusion types of the JPMD; b Halite dissolution temperatures and vapor-liquid homogenization temperature to liquid. Inclusions plotting above the line undergo final homogenization by halite dissolution, whereas inclusions below the line homogenize to liquid

Table 3 Nomenclature of Fluid Inclusion Measurements
The A-type FIAs (Fig. 5a, a7, a8, a9) yielded final icemelting temperatures (Tm-ice) of - 17.9 to - 9.8 °C, with calculated salinities of 13.8 to 21.2 wt% NaCl equiv. They were homogenized to a liquid phase at temperatures ranging from 352 to 428 °C.
For the Ob-type FIAs (Figs. 4j and 5a, a10), the halite daughter mineral usually dissolved at temperatures[Tm(halite)] ranging from 364 to 370 °C, after the vapor bubble disappeared, and their salinities were estimated as 43-44 wt% NaCl equiv.
For the S-type FIAs (Fig. 5, a11, a12, a13), the halite daughter mineral usually dissolved at temperatures(Tm(halite)) ranging from 369 to 400 °C, and their salinities were estimated as 35.6-45.3 wt% NaCl equiv. Apart from the common assemblages homogenizing to liquid(Fig. 5, a11, a13), other assemblages had inclusions that homogenized by near-simultaneous vapor and halite disappearance (Fig. 5, a12);
the boiling assemblage a12 homogenized to a liquid phase at temperatures ranging from 377 to 381 °C, and their salinities were estimated as 44.5-46.1 wt% NaCl equiv.
5.3.3 Substage II-2
V-, A-, Ob-, and S-type FIAs were identified in quartz crystals of substage II-2.
The V-type FIAs (Figs. 4i, a14 and 5a) yielded final icemelting temperatures (Tm-ice) of - 2.7 to - 1.5 °C, with calculated salinities of 2.6 to 4.5 wt% NaCl equiv. They homogenized to a liquid phase at temperatures ranging from 297 to 309 °C.
The A-type FIAs (Fig. 5a, a15, a16) yielded final icemelting temperatures (Tm-ice) of - 10.2 to - 5.1 °C, with calculated salinities of 8 to 14.2 wt% NaCl equiv. (Fig. 4).They homogenized to a liquid phase at temperatures ranging from 233 to 245 °C (Fig. 5 a16), except for one abnormal data point. The assemblage with salinity of 2 ± 0.6 wt% NaCl equiv. homogenized to the liquid phase at 165.3 ± 3 °C (Fig. 5, a15), which indicated that the assemblage may be interpreted as secondary inclusions that belong to stage III. This result is consistent with the petrographic fact that a14 formed earlier than a15 (Fig. 4i).
For the S-type FIs (Fig. 4, a18, a19), the halite daughter mineral usually dissolved at temperatures (Tm(halite))ranging from 261 to 285 °C, and their salinities were estimated as 32.4-37.4 wt% NaCl equiv. The a18 inclusion homogenized to liquid by vapor bubble appearance, while a19 homogenized by near-simultaneous vapor and halite disappearance. The boiling assemblage of a19 homogenized to a liquid phase at temperatures ranging from 269 to 285 °C, and their salinities were estimated as 35.4-37.6 wt% NaCl equiv.
For the Ob-type FIAs (Figs. 4m and 5), the boiling assemblage a17 homogenized by near-simultaneous vapor and halite disappearance with Tm(halite) ranging from 305 to 312 °C, and their salinities were estimated as 38.4-39.2 wt% NaCl equiv.
5.3.4 Stage III
A-type FIAs were identified in quartz crystals of stage III(Fig. 4, a20, a21). The L-type FIs yielded final ice-melting temperatures (Tm-ice) of - 5.8 to - 0.3 °C, with calculated salinities of 1.1 to 5.9 wt% NaCl equiv. They homogenized to a liquid phase at temperatures ranging from 132 to 177 °C.
5.4 Pressure estimation
Unique estimates of pressure (P) and temperature (T) can be determined from a boiling assemblage, and the homogenization temperature and salinity of the boiling assemblages are plotted as filled symbols in the phase diagram of the NaCl-H2O system (Fig. 6). All other inclusion data provide minimum pressures and temperatures only, using open symbols with bars extending to higher pressures. Approximate constraints on P-T-X-NaCl conditions can be derived by reference to experiments in the NaCl-H2O model system (Roedder and Bodnar 1980).Table 2 and Fig. 6 present the pressure estimates for all assemblages. The P-T-X diagram shows that the assemblages give minimum pressures over the range of 590 to below 110 bars. The boiling assemblages (a12, a17, a19)indicate pressures of 180 to 300 bars at temperatures of 269 to 400 °C, which implies consistent boiling. Documenting the entire fluid evolutionary history in the deposit is not possible, however, a generalized fluid evolution can be inferred from the assumption that each intrusion and its fluid pulse followed a similar range of P-T-X-NaCl paths.

Fig. 6 Phase diagram of the NaCl-H2O system. (Sourirajan and Kennedy 1962; Urusova 1975; Bodnar et al. 1985)
5.5 Oxygen and hydrogen isotopes
The oxygen and hydrogen isotope data for quartz are listed in Table 4. The values of δ18OH2O were calculated using the formula of Clayton et al. (1972). All samples selected for δ18O analysis were also analyzed for their hydrogen isotope compositions. Our analysis results show that the δ18OH2Oand δD obtained from stage I are in the range of 5.2 to 6.3‰ and - 87.2 to - 83.3‰, respectively. The δ18OH2Oand δD values obtained from substage II-1 vary from 3.6 to 5.1‰ and - 97.9 to - 91.7‰, respectively.The δ18OH2Oand δD values obtained from the substage II-2 FIs are in the range of 0.9 to 1.9‰ and - 104.1 to- 98.7‰, respectively. The δ18OH2Oand δD values for FIs in Stage III are in the range of - 7.3 to - 6.2‰ and- 104.3 to - 102.8‰, respectively.
6 Discussion
6.1 Origin of ore-forming fluids
The calculated δ18OH2Ovalues (5.2 to 6.3‰) for stage I are near the values for primary magmatic water, which vary from 5.5 to 10‰ (Barnes 1979). This result indicates thatmagmatic fluids were a major part of the initial ore-forming fluids. Further, the δDH2Ovalues (- 87.2 to - 83.3‰) are near the data for primary magmatic water (- 50 to- 85‰) (Barnes 1979), this result can be interpreted as indicating degasification during late magmatic crystallization (Rye 1993). And the δD and δ18OH2Ovalues are very close to or plot in the field of the Au-Cu (Mo) series of magmatic water (Fig. 7). It also suggests that the oreforming fluids of stage I were derived from the magmatic source. Six samples from stage II plot between the primary magmatic water box and the meteoric water line but closer to the former, suggesting that the stage II ore-forming fluids were a magmatic-meteoric mixture but still dominated by magmatic water. Two samples from stage III yield low δ18OH2Oand δD values, indicating that the stage III fluids were dominated by meteoric water.
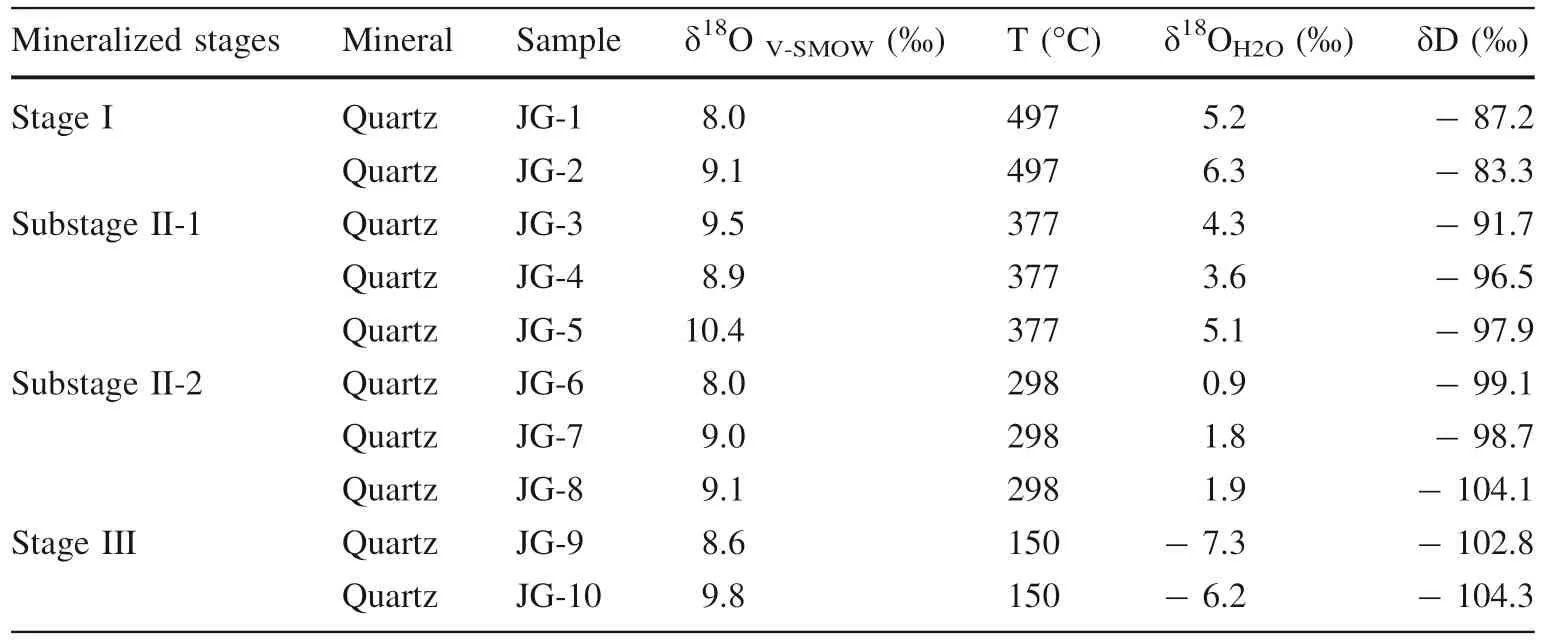
Table 4 Hydrogen and oxygen isotope compositions of JPMD samples
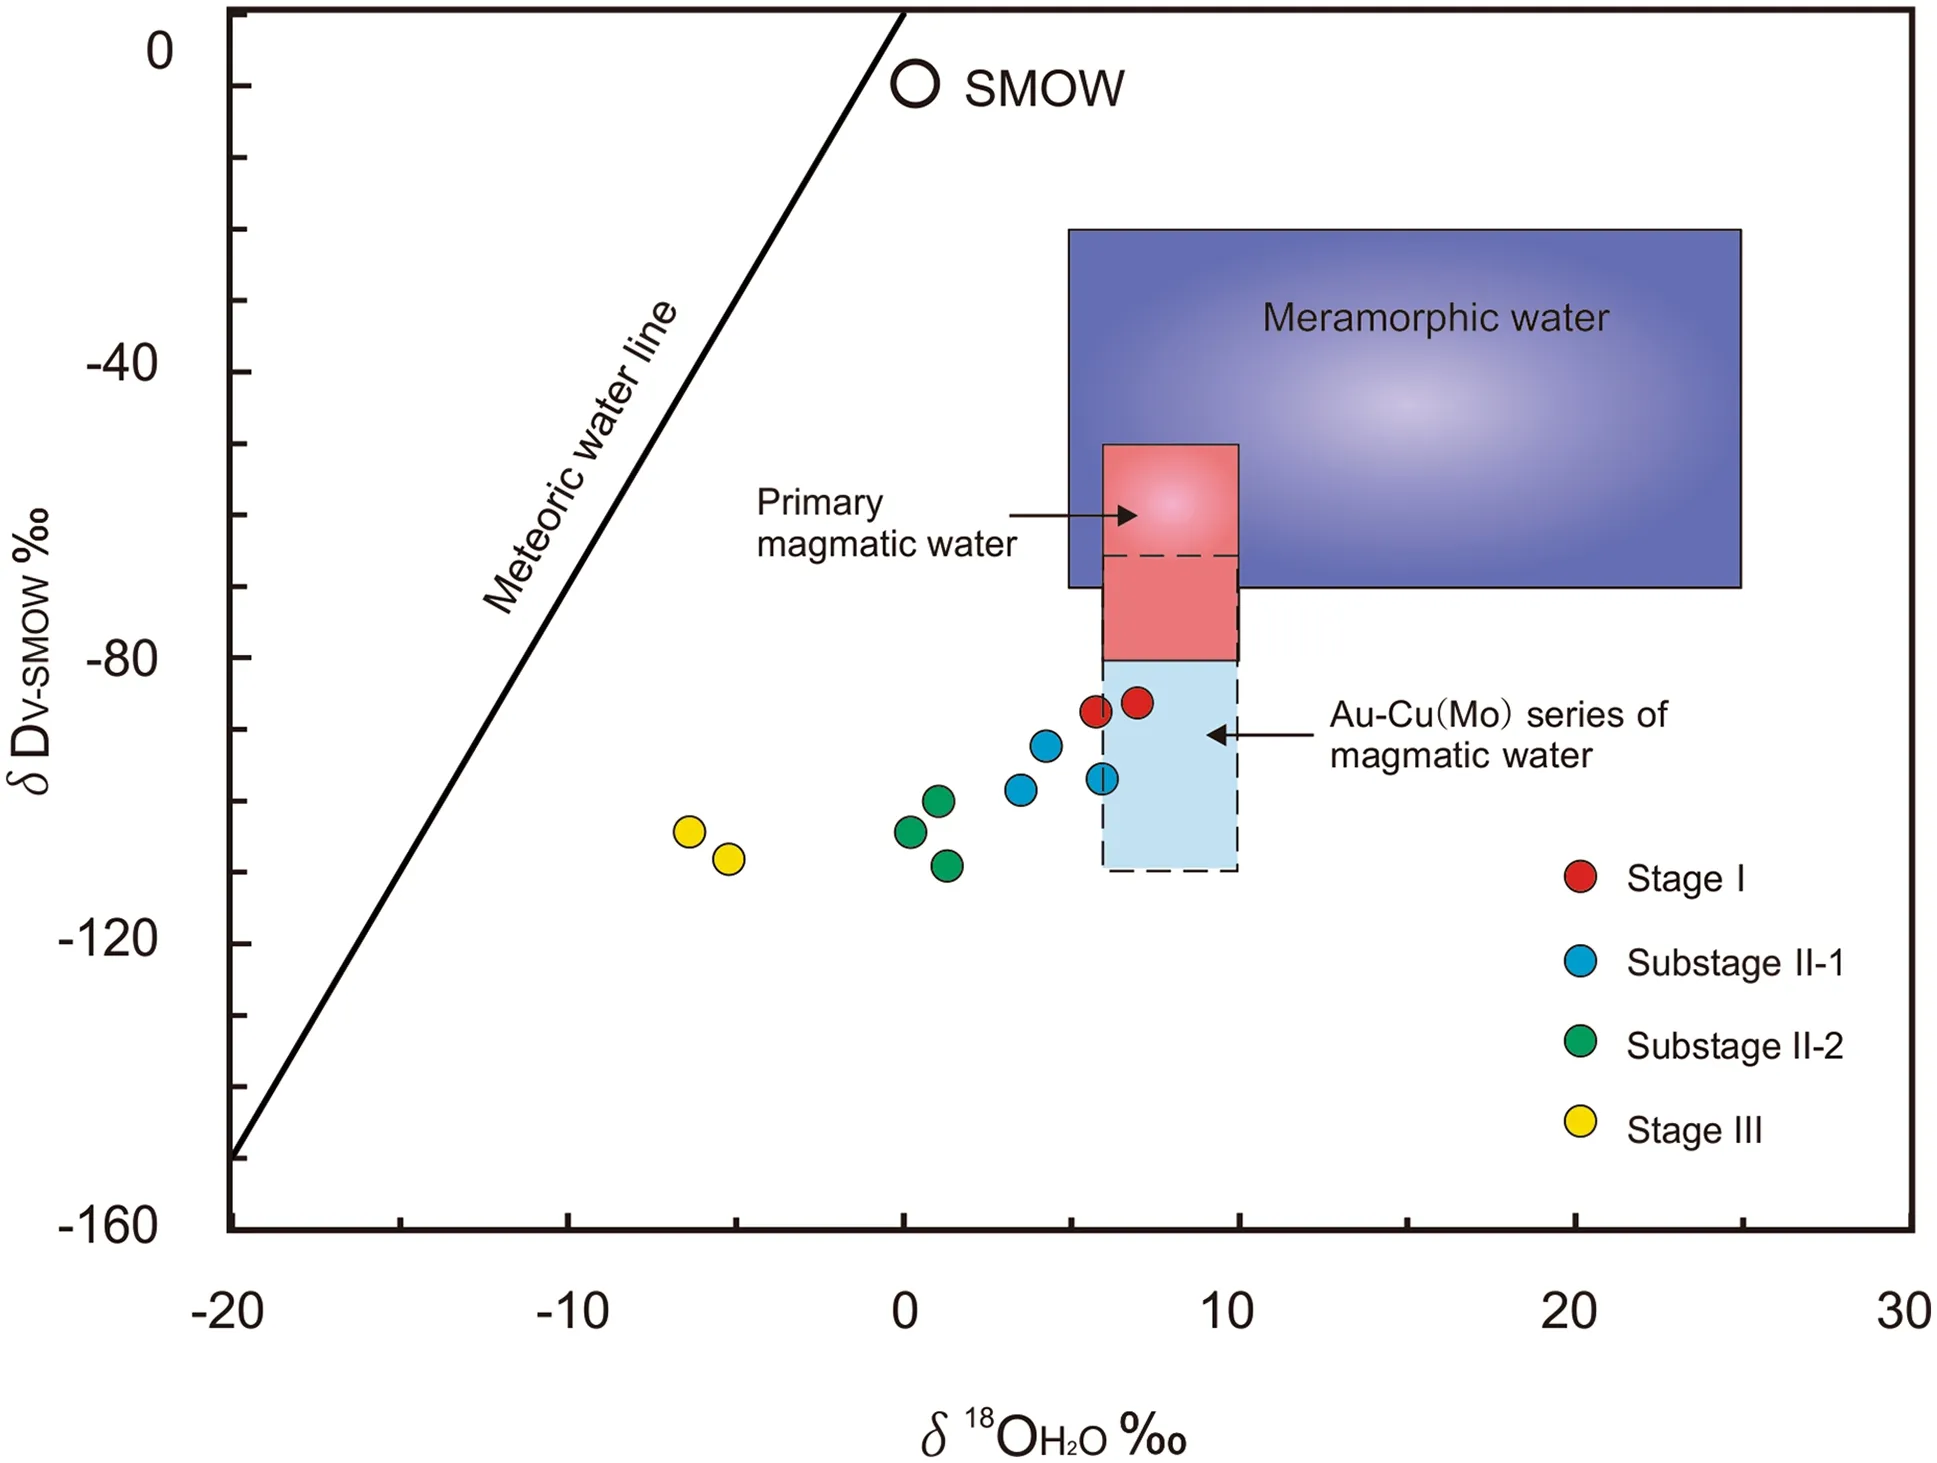
Fig. 7 δD versus δ18OH2O plots of ore-forming fluids from the JPMD. Diagram is from Taylor (1974). The field of the Au-Cu (Mo)series of magmatic water is from Zhang (1985)
6.2 Ore fluid evolution
In summary, the FIA petrographic features and the P-T-X path of general cooling and decompression reflect a sequence of events involving variable amounts of immiscibility, cooling and mixing in the ore-forming fluid system. Fluid inclusion petrography and microthermometry and hydrogen and oxygen isotope analyses combined with pressure and temperature further constrain the sources and evolution of the ore-forming fluid.
(1) The granitic complex associated with the JPMD is rich in silicon and alkalis (Wu et al. 2014). Fluid exsolved from this magma was rich in K and F, and the fluids evolved to stage I (490-510 °C, 375-590 bar). The fluids forming three types of inclusions: A-type, V-type and S-type (Fig. 8). It is worth to emphasizing that the fluid exsolved from a deep magma chamber was usually singlephase and had relatively low salinity ranging from 5 to 15 wt% NaCl equiv.(so called ID-type) (Aude´tat and Li 2017).However, we didn’t observed ID-type and the fact that low salinities A-type, V-type FIs and high salinities S-type FIs coexist in stage I indicate fluids exsolving followed other pattern, the fluids exsolved from shallow plutons are already in the two-phase state at the magmatic stage, and they remain two-phase during further cooling (Aude´tat and Li 2017). Furthermore, we have observed the high salinity inclusions a3 (54-56 wt% NaCl equiv.) are earlier than the lower salinity inclusion (Fig. 4i). Thus the initial fluids exsolved from relatively shallow intrusion depth and had a high temperature, high salinity characteristics.
The small salinity variation between a1 (8.9-9.7 wt%NaCl equiv.) and a2 (11.9-12.7 wt% NaCl equiv.) can be interpreted to reflect minor water loss from an initial fluid.However, a3 (375 bar) having lower pressure than a1 and a2 (570-590 bar) may indicate that the trapped temperatures and pressures were much higher than 512 °C and375 bar, and either the fluids were partially boiled, or phase separation occurred. Stage I had low saturation in sulfides.The acceptable explanation for this situation is that under conditions of high oxygen fugacity (Wu et al. 2010, 2014),S is mainly dissolved in magma in theform of SO42-(Jugo et al. 2010), which means that S2-was less reactive and not suitable to produce effective mineralization (Hamlyn et al. 1985).
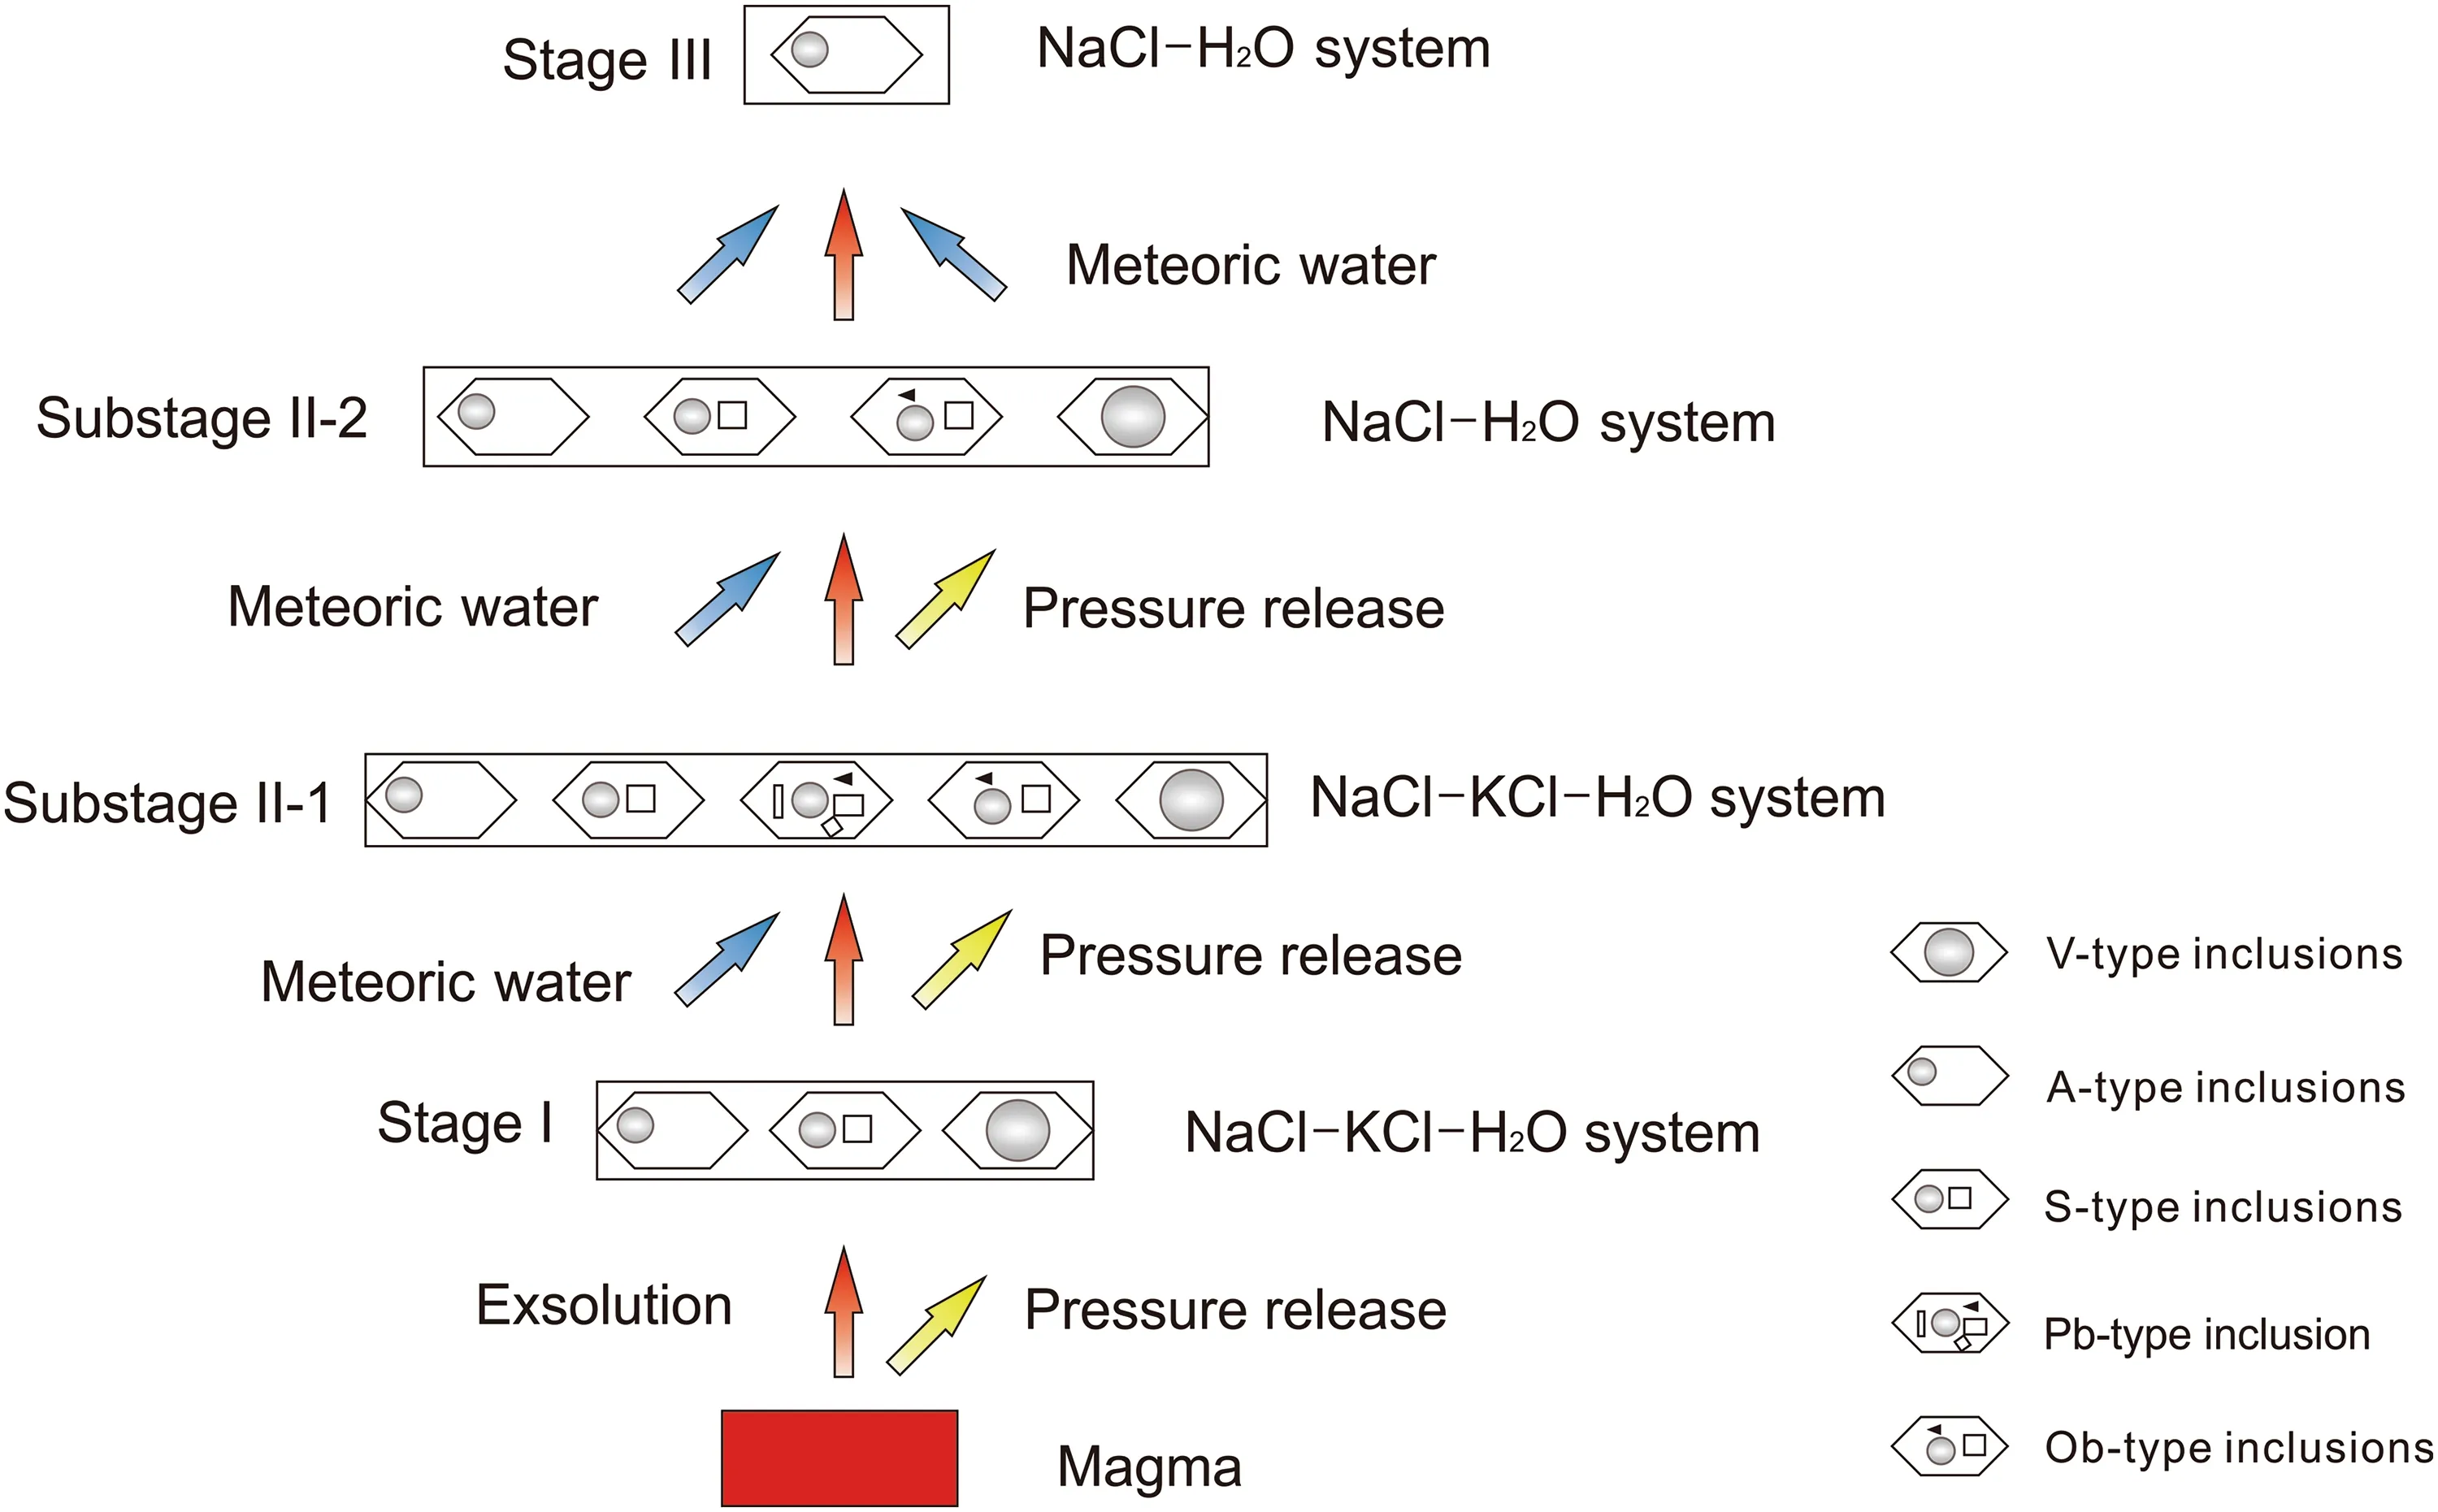
Fig. 8 Diagram of the evolution of the hydrothermal fluids from quartz vein types of mineralization in the JPMD
(2) Upon cooling and decompression, the fluids evolved to stage II (260-460 °C, 160-480 bar). There are clear boiling trail assemblages in stage II (a12, a17, a19). Their homogenization temperatures are ranging from 269 to 381 °C. These assemblages indicate phase separation or immiscibility is universal in stage II and it could cause the release of HF, and consequent fluid condensation and oxygen fugacity decrease, followed by the extensive precipitation of molybdenite and other ore minerals. The decrease in oxygen fugacity of the fluid caused the S in sulfate (SO42-) to convert to reduced sulfur (S2-), as required for efficient ore precipitation. Therefore, fluid boiling was the main reason for the deposition of molybdenum metal. Due to the immiscibility, a part of the fluid was trapped in low-salinity V-type inclusions, ranged from 3.7 to 6.2 wt% NaCl equiv. (a4-a6), and the remainder was trapped in slightly higher salinity A-type inclusions, ranged from 13.8 to 21.2 wt% NaCl equiv. (a7-a9) or much higher salinity inclusions ranged from 32.4 to 46.3 wt% NaCl equiv. (a10-a13, a17-a19) (Fig. 6).
The values of δDH2O(- 97.9 to - 91.7‰) and δ18OH2O(3.6 to 5.1‰) in substage II-1 indicate that the fluids were mixed with meteoric water (Fig. 7). Therefore, a sudden decompression due to rock fracturing can be ruled out as the mechanism for immiscibility in the fluid system (Cline 2003; Harris et al. 2003; Heinrich 2007; Rollinson 1993).The fluids were boiled on a large scale, forming five kinds of inclusions: A-type, V-type, S-type, Pb-type, and Ob-type(Fig. 8). The occurrence of Pb-type inclusions containing sylvite indicates that the initial ore-forming fluids had evolved to substage II-2 and always belonged to the NaCl-KCl-H2O system. In addition, Pb-type and Ob-type FIs contain transparent and opaque daughter minerals, which implies that ore metal concentrations were high and that the fluids could transport metallogenic material. Thus, Pbtype and Ob-type FIs played an important role in sulfide precipitation. Ob-type inclusions (a10) homogenized by halite dissolution around 366 °C, after the vapor bubble disappeared around 222 °C, which has been interpreted to indicate entrapment of a halite-saturated hydrothermal brine (Eastoe 1978; Cloke and Kesler 1979; Wilson et al.1980) and homogeneous trapping at high pressures (Bodnar 1994; Cline and Bodnar 1994). Other possibilities include post-entrapment H2O loss or volume shrinkage. Therefore,halite saturation may have occurred at 366 °C and 250 bar,marking the beginning of sulfide precipitation.
In substage II-2, the values of δDH2O(- 104.1 to- 98.7‰) and δ18OH2O(0.9 to 1.9‰) indicated meteoric water continued to be added to the system, leading to decreases in fluid temperatures and salinities, phase separation or immiscibility of fluids possibly resulted in HF escaping from the fluid system and led to the precipitation of fluorine. In this stage, four types of inclusions formed:A-type, V-type, S-type, Pb-type, and Ob-type (Fig. 8).Compared with substage II, the Pb-type inclusions vanished, indicating that the NaCl-KCl-H2O system was transformed into the NaCl-H2O system. A large amount of fluorite at this stage indicates that the precipitation of fluorine in the mining area (Keppler and Wyllie 1991) was also one of the factors leading to the precipitation of metallic substances from 234 to 310 °C.
(3) As the fluids evolved to stage III (136-172 °C,110-130 bar), the values of δDH2O(- 104.3 to - 102.8‰)and δ18OH2O(- 7.3 to - 6.2‰) indicated that the further development of the fluid flow path resulted in an influx of low-salinity meteoric water, causing marked decreases in the temperature and salinity of the fluid, and only individual A-type FIs formed in stage III (Fig. 8). The lowsalinity ranged from 1.1 to 5.9 wt% NaCl equiv. (a20,a21)influenced by meteoric water contrasted with stages I and II, when salinity was controlled dominantly by variations in P and T. The lack of sulfide precipitation during stage III might reflect a lower oxygen fugacity than in stage II. By the end of stage III, the fluids had transformed to a NaCl-H2O system with low temperature, low salinity, and low ore metal concentrations.
6.3 Ore genesis
The initial ore-forming fluids of the JPMD were characterized by high temperature, high salinity, high ore metal concentrations and lacked CO2, generally belonging to an F-rich NaCl ± KCl-H2O fluid system. The fluid characteristics were quite different from those of other porphyry Mo(-Cu) deposits, such as the Aolunhua (Ma et al. 2010)and Chehugou (Zeng et al. 2011) deposits in the XMB.However, the fluids were similar to those of the Climaxtype deposits in the USA. i.e., Climax (Hall et al. 1974;Aude´tat 2015), Henderson (White et al. 1981; Seedorff and Einaudi 2004), and Cave Peak (Aude´tat et al.2008; Aude´tat 2010).
The JPMD was classified as transitional between Climax-type and Dabie-type (Aude´tat and Li 2017), however,by contrasting the Climax-type porphyry scheme of Seedorff et al. (2005) and the JPMD (Table 5), the JPMD is fit better to the class of Climax-type deposits with the main supporting elements outlined as follows:
(1) Based on the regional geology and geochronology studies, the mineralization of JPMD developed in an extensional regime (Wu et al. 2011; Shao et al. 2001); (2)The widely presence of fluorite implying that the JPMD is a fluorine-rich type Mo deposit; (3) The εHf(t) values of the magmatic zircons from the host granite porphyry range from +0.2 to -5.6, indicating its derivation from the lower crust (Wu et al. 2014); (4) Fluid inclusion associations, the lack of CO2FIs resemble characteristics commonly observed in Climax-type porphyry Mo deposits (Hall et al.1974; Seedorff and Einaudi 2004; Aude´tat 2010); (5) The host granite porphyry is an alkali-feldspar granite, rich in silica (78 wt% SiO2) and alkalis (Wu et al. 2014), which is commonly observed in Climax-type porphyry Mo deposits(Li et al. 2014; Hall et al. 1974; Seedorff and Einaudi 2004;Aude´tat 2010).

Table 5 Comparison of geochemical characteristics between Climax-type and JPMD
7 Conclusions
1. The JPMD is rich in various types of fluid inclusions,i.e., Pb-, Ob-, S-, A-, and V-types. The daughter minerals are halite, sylvite, etc., and other unidentified transparent and opaque daughter minerals.
2. Pb-type and Ob-type FIs, which have high contents of fluid ore-forming elements, played an important role in ore formation.
3. The initial ore-forming fluids were characterized by high temperature, high salinity, high ore metal concentrations, and generally belonged to an F-rich NaCl ± KCl-H2O fluid system.
4. Hydrogen and oxygen isotope characteristics suggest that the ore-forming fluids of the JPMD were derived mainly from a magmatic source in stage I and that meteoric water was involved in the following stages.
5. In summary, the enrichment in molybdenite and pyrite led to precipitation at temperatures and pressures from 260 to 460 °C and 160 to 480 bar, respectively.Multistage phase separation or immiscibility of the ore-forming fluid caused releases of H2O and HF, fluid condensation, and decreases in oxygen fugacity, and mixing with meteoric water destroyed the stability of the ore-forming fluid. Thus, multistage phase separation or immiscibility of the ore-forming fluid was critical for the formation of the JPMD.
Acknowledgements We are grateful to the staff of the Analytical Laboratory in the Beijing Research Institute of Uranium Geology,China National Nuclear Corporation (CNNC), for their advice and assistance with the isotopic analyses. We are also grateful to Managing Editor Binbin Wang, and anonymous reviewers for their critical and constructive reviews, which greatly improved the manuscript.
杂志排行
Acta Geochimica的其它文章
- Development of in-situ Micro-Raman spectroscopy system for autoclave experimental apparatus
- Exposure of children to heavy metals from artisanal gold mining in Nigeria: evidences from bio-monitoring of hairs and nails
- Constraints on granite-related uranium mineralizationin the Sanjiu uranium ore field, SE China provided by pyrite mineralogy, major and trace elements, S-He-Ar isotopes
- Studying DDTs in agricultural soils of selected rural communities of Armenia
- REE geochemistry of core sediments of Cauvery delta, India for provenance studies
- CO2 flux of soil respiration in natural recovering karst abandoned farmland in Southwest China
