Development of in-situ Micro-Raman spectroscopy system for autoclave experimental apparatus
2020-09-13LinChenHepingLiShengbinLiLipingXuSenLinHongbinZhou
Lin Chen· Heping Li · Shengbin Li · Liping Xu · Sen Lin ·Hongbin Zhou
1 Laboratory of High Temperature and High Pressure Study of the Earth’s Interior, Institute of Geochemistry, Chinese Academy of Sciences, 99 Lincheng West Road, Guanshanhu District, Guiyang, Guizhou Province 550081, People’s Republic of China
2 University of Chinese Academy of Sciences, Beijing 100049,China
3 Zhejiang Pharmaceutical College, Ningbo 315100, China
Abstract We developed a set of in-situ Micro-Raman spectroscopy system for autoclave experimental apparatus because of the scientific significance of in-situ Micro-Raman spectroscopy system under the high-pressure hydrothermal condition. We used this system to measure the Raman spectrum of water-fluid and quartz crystal at the temperature ranging from 125 to 420 °C. The signal-tonoise ratio of the Raman signal is good.
Keywords Micro-raman · Hydrothermal system · In-situ ·Autoclave
1 Introduction
In-situ Micro-Raman spectroscopy observation under highpressure hydrothermal conditions is an important way to understand the high-temperature and high-pressure waterfluid in the Earth’s interior, and to reveal the compositions,structures, properties and evolution processing of other materials in the Earth’s interior.
At present, hydrothermal diamond anvil cell (HDAC)and autoclave are the most commonly used experimental apparatuses in the high temperature and high-pressure hydrothermal simulation experiment. Very high temperatures and pressures can be obtained by using HDAC, but HDAC has some shortcomings, such as the cavity body of HDAC is too small (only about 10-5mL), accurate control and determination of the pressure value are very difficult,and the operation of HDAC is difficult (Zhang et al. 2009;Zheng et al. 2004). However, the autoclave does not have these shortcomings, it has a large volume (larger than 30 mL), and temperatures and pressures can be controlled and determined accurately. Therefore, the autoclave is often used as the high pressure hydrothermal experimental apparatus.
Up to now, most of the reports about the in-situ Micro-Raman spectroscopy experiments under the high-pressure hydrothermal condition are about DAC (Qiao et al. 2006;Yang and Zheng 2009; Zhang et al. 2009, 2015), and also many reports are about autoclave (Clerk et al. 1997; Gorbaty et al. 2004; Ma et al. 2009). However, these in-situ Micro-Raman spectroscopy experimental systems about the autoclave have two problems: one problem is that the autoclave in these reports cannot be compatible with different in-situ observation platforms (other in-situ observation platforms cannot be used when in-situ Micro-Raman spectroscopy system is operated); and the other problem is that the objectives in these reports are general microscope objectives, and cannot be used under the condition of the high temperature. When a long focal length objective has to be used, this will reduce the intensity of the Raman signal.
In this paper, we will solve the problems and develop a set of in-situ Micro-Raman spectroscopy systems for the autoclave experimental apparatus without these two problems. The multi-function autoclave experimental apparatus we used can be compatible with different in-situ observation platforms, many different in-situ observation platforms can be operated at the same time, and different in-situ observation data (Raman spectrum, oxygen fugacity, and so on) can be obtained meanwhile. So we intend to develop a set of in-situ Micro-Raman spectroscopy system based on the autoclave experimental apparatus in our laboratory.
2 Experimental instruments
The schematic diagram of the autoclave experimental apparatus is shown in Fig. 1. The accuracy of the temperature controller is ± 0.1 °C, however, as the K-type thermocouple we used does not contact with water-fluid and samples directly, the uncertainly of temperature measurements is ± 5-10 °C. The full scale (F.S) of the pressure sensor is 100 MPa, and the accuracy is 0.1% F.S, with the high-precision pressure sensor, pressure value can directly be obtained with an uncertainty of ± 0.1 MPa.
The pictures of high-temperature furnace, temperature control unit, and autoclave body are shown in Figs. 2, 3,and 4 respectively.
The Raman spectra were obtained with Renishaw in Via Raman Microscope equipped with stabilite 2017 Ar+ion laser (514.5 nm), and a 2400-groove/mm grating with a resolution of ± 1 cm-1. The measurement repeatability of the Raman spectrometer is 0.2 cm-1. The picture of the Raman spectrometer is shown in Fig. 5.
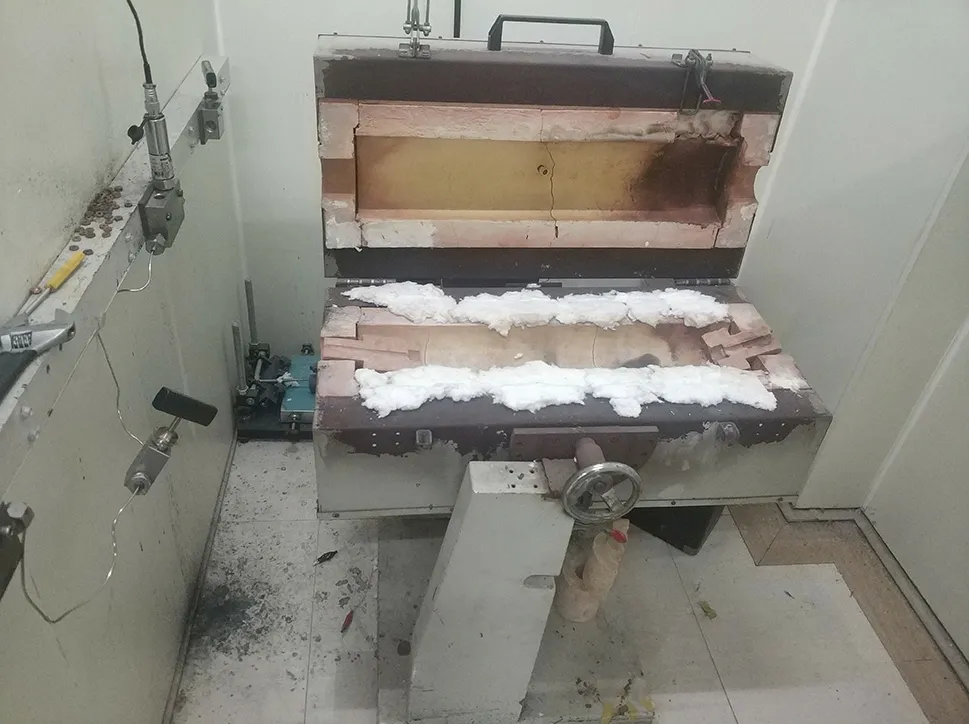
Fig. 2 The picture of high-temperature furnace
3 Design and assembly of an optical system
We already have the autoclave experimental apparatus and Raman spectrometer in our lab, to measure the Raman spectrum of samples under high-pressure hydrothermal conditions, we have designed and built an optical system to connect these two experimental instruments.
For the light to get into the autoclave and get back, we intended to install an optical window in the stopper of the autoclave. The sapphire crystal has good optical performance, good chemical stability, good thermal stability, and high mechanical strength (Moriaki 2007). We chose the sapphire crystal as the material for our optical window (4 in Fig. 1).
According to the principle of applied optics, since the strength of Raman signal is proportional to the square ofthe numerical aperture of the objective, and the numerical aperture of the objective is inversely proportional to the focal length of objective, so the intensity of Raman signal is inversely proportional to the square of the focal length of objective (Smith 2007). So to get the strong Raman signal,we need to choose the lens with a short focal length, which makes the lens very close to the sample. But the autoclave is in the high-temperature furnace, general microscope objectives cannot be used in this condition. According to the experimental needs, we choose a series of the sapphire lens with a focal length of 20 mm as our high-temperature Raman objective.
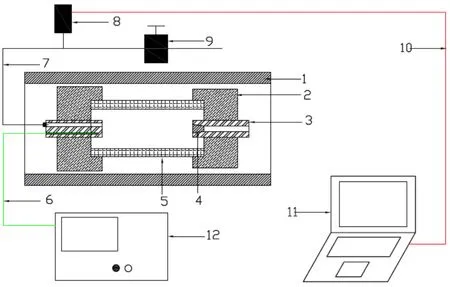
Fig. 1 Schematic diagram of the multi-function autoclave experimental apparatus. 1 Hightemperature furnace; 2 Nut; 3 Stopper; 4 Sapphire window; 5 Autoclave body; 6 Thermocouple; 7 High pressure capillary; 8 Pressure sensor; 9 High-pressure valve; 10 Usb cable; 11 Computer; 12 Temperature control unit

Fig. 3 The picture of the temperature control unit
The picture of the sapphire lens is shown in Fig. 6, the surface quality of the lens is 40-20 scratch-dig.
The schematic diagram of in-situ Micro-Raman spectroscopy system is shown in Fig. 7. Raman fiber optical detector is coupled with the Raman spectrometer by a set of optical fibers. The sketch map and picture of Raman fiber optical detector are shown in Figs. 8, 9 respectively. The laser passing through an optical fiber and Raman fiber optical detector converges through objective, stray light can be filtered by the narrow-band pass filter (3 in Fig. 8).The reflected laser can be focused on the CCD by the lens.By observing the image of the laser, we can determine whether the laser is converged on the surface of solid samples or in the water-fluid. When it is determined that the laser is focused on the target position, we can measure the Raman spectrum by operating the Raman spectrometer.Rayleigh filter (5 in Fig. 8) can filter out Rayleigh scattering light and allow Raman scattering light pass through. Finally, the Raman signal can be collected by the Raman spectrometer.
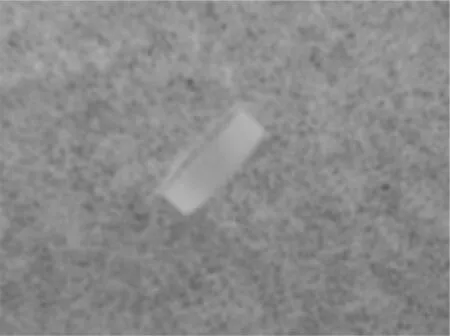
Fig. 6 The picture of sapphire lens
We fixed the optical system (1 in Fig. 7) on a set of multi-dimensional adjustment platform (shown in Fig. 10).This set of multi-dimensional adjustment platform consists of three position stages (x, y, z-direction), an angular displacement stage, and a rotating stage, it can be used to adjust the positions and angles.
In the experiment, we adjusted the multi-dimensional adjustment platform to make this set of optical system (1 in Fig. 7) and the sapphire window (4 in Fig. 1) sealed in the stopper of the autoclave coaxial firstly. Secondly, we observed the image of laser, and adjusted the position of the objective along the optical axis to make the laser focus on the samples. Then we moved the semi-transparent mirror (4 in Fig. 7) away from the optical axis to make sure the laser is not blocked and operated the Raman spectrometer to measure the Raman spectrum.
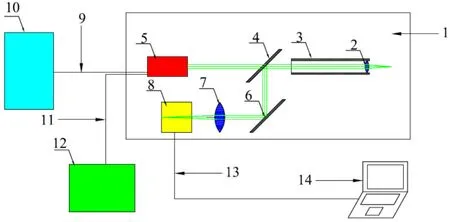
Fig. 7 Schematic diagram of in-situ Micro-Raman spectroscopy system. 1 The sketch map of the optical system we designed; 2 Objective; 3 Lens tube; 4 Semi-transparent mirror; 5 Raman fiber optical detector; 6 Mirror; 7 Lens; 8 CCD; 9,11 Optical fiber; 10 Raman spectrometer; 12 Ar+ion Laser; 13 Usb cable; 14 Computer
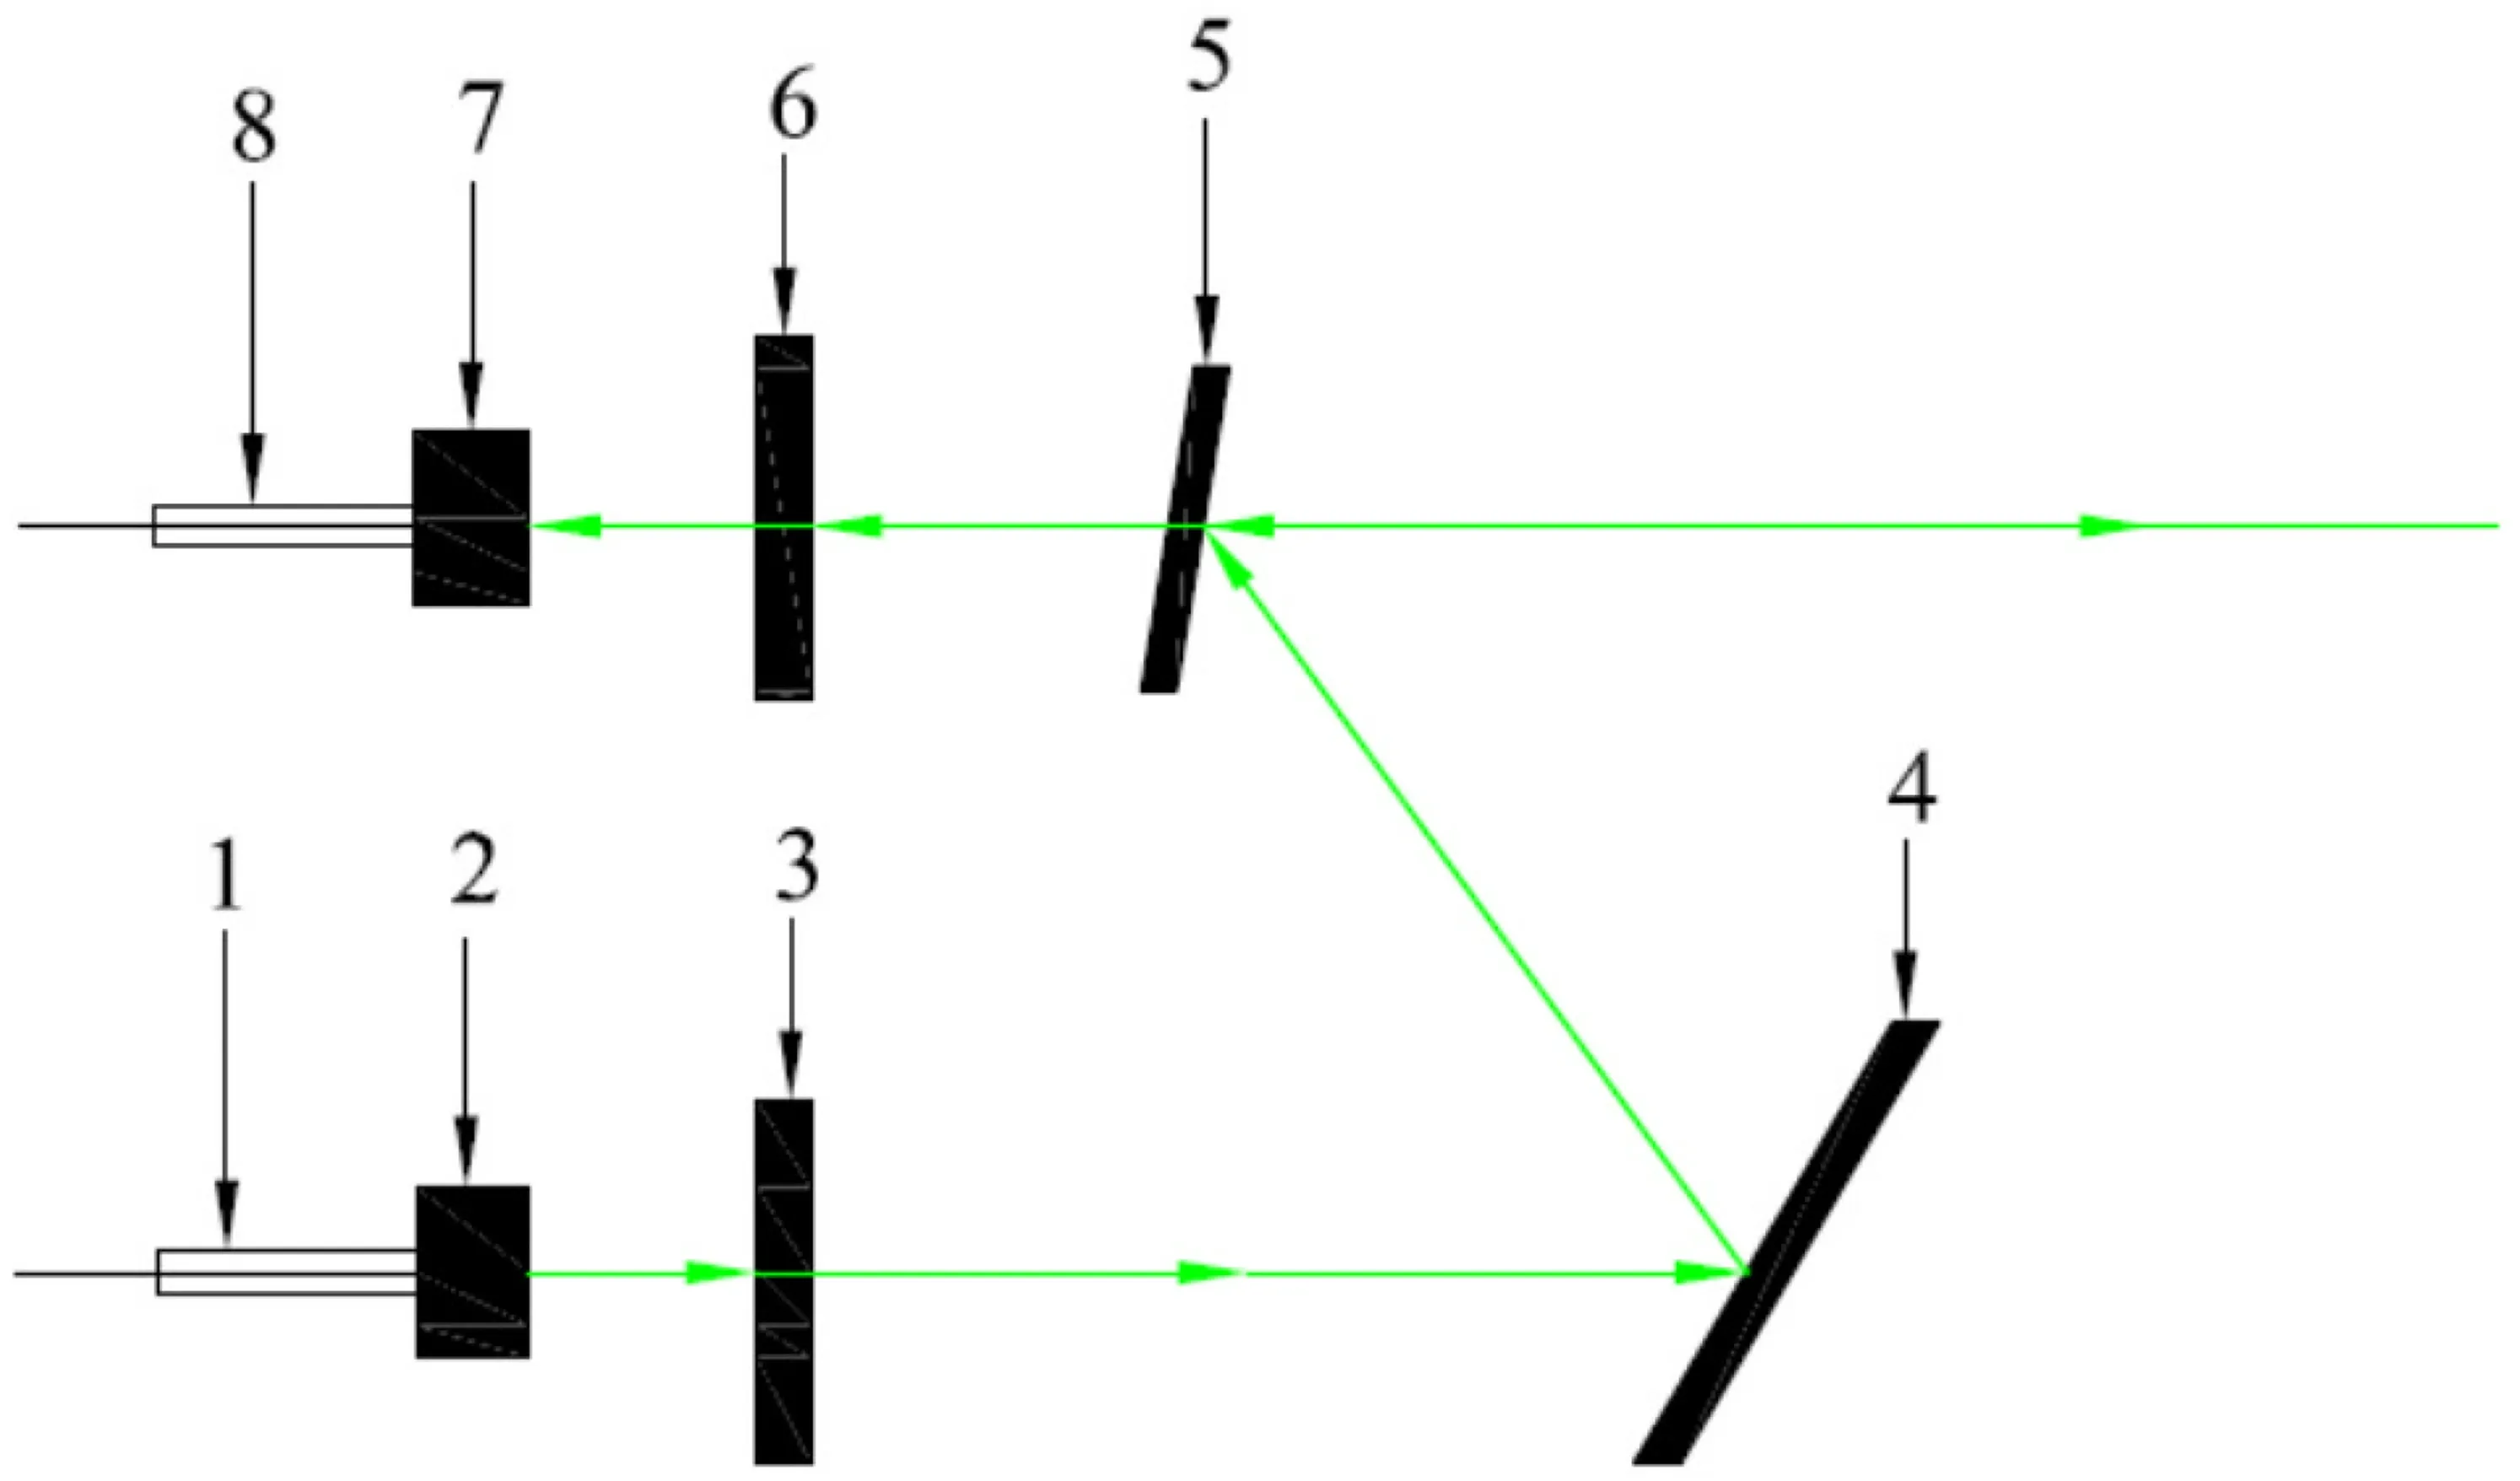
Fig. 8 The sketch map of Raman fiber optical detector. 1 Laser input optical fiber; 2 Interface coupler and collimating lens; 3 Narrow-band pass filter; 4 Mirror; 5 Rayleigh filter; 6,7 Interface coupler and collimating lens; 8 Raman signal collection optical fiber

Fig. 9 The picture of Raman fiber optical detector

Fig. 10 The picture of multi-dimensional adjustment platform
4 Experiment
In order to test the performance of this set of in-situ Micro-Raman spectroscopy systems, we did two groups of experiments and measured the Raman spectrum of waterfluid and quartz crystal at the different temperatures and pressures.
In the first experiment, we used pure water as the sample. The experimental steps are as follows. First, pour 30 mL distilled water into the clean autoclave. Second, seal the autoclave with the stopper and nut. Third, put the autoclave in the furnace and adjust the light path. Fourth,heat the autoclave to the temperatures of 200, 300, and 400 °C. Fifth, keep the target temperature for 2 h and measure the Raman spectrum.
In the second experiment, we fixed a piece of cylindrical quartz crystal (10 mm diameter, 3 mm thickness, and 3 arc min parallelism) inthe clean autoclave and pouredinto18 mL distilled water. The following experimental steps were the same as steps of the first experiment. The autoclave was heated to 420 °C from room temperature. In this process, we measured the Raman spectrum of quartz crystal and supercritical water at different temperatures. Each Raman spectrum was measured after the target temperature was kept for 2 h.
5 Results and discussions
The acquisition time is 10 s with one accumulation for each spectrum. The output power of the laser is 80 mW.Raman spectrum of water-fluid at the temperatures of 200,300, and 400 °C are shown in Fig. 11. The Raman peak at about 3550 cm-1is assigned to the O-H stretching vibration (Hu et al. 2013; Wang and Sun 2016).

Fig. 11 Raman spectrum of water-fluid at the temperatures of 200,300, and 400 °C

Fig. 12 Raman spectrum of quartz crystal in the water-fluid at different temperatures and saturated vapor pressures

Fig. 13 Raman spectrum of quartz crystal and water-fluid in supercritical water at the temperatures of 400 and 420 °C
Raman spectrum of quartz crystal in the water-fluid at different temperatures and saturated vapor pressures are shown in Fig. 12. The Raman peak at about 465 cm-1is assigned to the Si-O symmetrical stretching of the quartz crystal (John and Arvin 1972; Zheng et al. 2004).
Raman spectrum of quartz crystal and water-fluid in supercritical water at the temperatures of 400 and 420 °C are shown in Fig. 13. - 465 cm-1is the Raman peak of quartz crystal, and - 3550 cm-1is the Raman peak of supercritical water.
6 Conclusions
1. We developed a set of in-situ Micro-Raman spectroscopy system for the multi-function autoclave experimental apparatus. The system can be compatible with different in-situ observation platforms, and the high-temperature Raman objective we designed can be used under the condition of the high temperature.
2. We used the set of in-situ Micro-Raman spectroscopy system to measure the Raman spectrum of water-fluid and quartz crystal at the different temperatures and pressures, and obtained the Raman spectrum of waterfluid and quartz crystal at the temperature ranging from 125 to 420 °C, and the Raman spectrum have a good signal-to-noise ratio.
Acknowledgements This study was supported by the National Key R&D Program of China (Grant No. 2016YFC0600104) and the Strategic Priority Research Program (B) of the Chinese Academy of Sciences (XDB 18010401).
杂志排行
Acta Geochimica的其它文章
- Exposure of children to heavy metals from artisanal gold mining in Nigeria: evidences from bio-monitoring of hairs and nails
- Constraints on granite-related uranium mineralizationin the Sanjiu uranium ore field, SE China provided by pyrite mineralogy, major and trace elements, S-He-Ar isotopes
- Studying DDTs in agricultural soils of selected rural communities of Armenia
- Fluid inclusion and H-O isotope study of the Jiguanshan porphyry Mo deposit, Xilamulun Metallogenic Belt: implications for characteristics and evolution of ore-forming fluids
- REE geochemistry of core sediments of Cauvery delta, India for provenance studies
- CO2 flux of soil respiration in natural recovering karst abandoned farmland in Southwest China
