Studying DDTs in agricultural soils of selected rural communities of Armenia
2020-09-13TepanosyanSahakyanBelyaevaBeglaryanPipoyanHovhannisyanSaghatelyan
G. Tepanosyan · L. Sahakyan · O. Belyaeva · M. Beglaryan · D. Pipoyan ·A. Hovhannisyan · A. Saghatelyan
Abstract To study organochlorine pesticides and organophosphorus pesticides contents and assess pesticideinduced health risk in Armenia, the contents of pesticides were determined in 252 soil samples taken from relatively large plots of agricultural land in 25 rural communities.The results showed that only ∑DDT contents were detected in 39 out of 252 soil samples. The identified contents of ∑DDT mainly consisted of pp′-DDE, suggesting historical use. 6 out of 12 rural communities are characterized by the presence of former pesticide storehouses site. The excesses versus Maximum Acceptable Concentration were observed in 26 out of 39 samples and ranges from 1.03 to 464.9 times. The health risk assessment showed that non-carcinogenic risk is below the allowable level (HQ <1). However, the carcinogenic risk is above the allowable level of <10-4 in all cases when∑DDT is detected. Of all studied rural communities, the presence of observed ∑DDT and associated risk to the local population was detected mainly in the majority of sampling sites in Jrashen (Ararat region), Aramus (Kotayq region) and Khanjyan (Armavir region). Therefore, special attention should be given to the riskiest rural communities and risk reduction measures are needed to reduce or eliminate observed carcinogenic health effect.
Keywords Organochlorine pesticides · ∑DDT · Soil ·Pollution · Health risk assessment
1 Introduction
Organochlorine (OCP’s) and some of the organophosphorus pesticides (OPP’s) are of significant environmental concern due to their bioaccumulation, toxicity, and potential adverse effects on ecosystems and human health(ATSDR 2002). Being persistent organic pollutant, ∑DDT impact of human can trigger various health effects including endocrine-disruption and cancer (Ejaz et al.2004). Moreover, as stated by Singh et al. (2017) the combined impact of pesticides and toxic metals are more severe as compared to their individual effects. Therefore, in order to be able to implement studies targeting the combined effect of toxic metals and pesticides, individual studies on pesticides are necessary.
In former Soviet Union countries including in Armenia the wide use of pesticides started in the 1950s and continued up to the 1980s (Sargsyan and Sargsyan 2006;Dvorska´ et al. 2012). The total area load of OCPs and OPPs averaged 9-35.5 kg per hectare which manifold exceeded the average values of all former Soviet Union levels of pesticide application. According to data provided by the National Implementation Plan, between 1970 and 1980 mean concentrations of OCPs and particularly hexachlorocyclohexane (HCH), DDT and its isomers in different environmental compartments made 0.01-0.44 mg/kg(UNEP 2017). Since 2003, the production and use of some pesticides in the Republic of Armenia (RA) were limited as soon as RA signed the Stockholm Convention. However,after the Soviet Union collapsed and during the following years, numerous former pesticide storehouses distributed throughout RA have remained unmanaged and abandoned.Moreover, in the 1990s some of the former pesticide storehouses and their related territories were privatized and used for other purposes (Sargsyan and Sargsyan 2006).
Various studies (Vijgen and Egenhofer 2009; Dvorska´et al. 2012; Weber et al. 2015) showed that obsolete pesticides and their semi-collapsed and former pesticide storehouses are potential sources of environmental pollution. Monitoring studies implemented in the country in 2012 have indicated the presence of DDT and its isomers,heptachlor, dieldrin, endrin, mirex, aldrin in soil, river water, river sediments and so on (UNEP 2017). One should mention that data regarding residual OPPs in environmental compartments are scarce and some of them (methyl parathion, methamidophos, parathion ethyl, phosphamidon) are forbidden for use by Armenia’s legislation (RA Government 2005). Considering a wide use of pesticides during the former Soviet Union period, an informal use of those pesticides in some regions of the RA after the Soviet Union disintegration (Tadevosyan et al. 2013), their persistence in the environment and accumulation in the soil profile, as well as the presence of a number of former pesticide storehouses (UNDP 2015) the importance of the investigations of residual concentrations of pesticides is of a primary concern.
Therefore, in 2014 the Center for Ecological-Noosphere Studies of the National Academy of Sciences (CENS) RA launched a ‘‘Monitoring of residual pesticides in food produced in the Republic of Armenia’’ (2014-2018) project which aims at revealing and assessing environmental contamination with pesticides in the most productive rural communities of Armenia. Within this study the quantities of OCP’s and OPP’s in the soils of comparatively bigger rural communities of Armenia regions were investigated and associated human health risk from pesticides contents was assessed.
2 Materials and methods
2.1 Study site
The Republic of Armenia (total area of 29,743 km2, population of 2986.1 thousand) lies between latitudes 38°50′and 41°18′and between longitudes 43°27′and 46°37′. At a straight-line distance, the country is 175 km far from the Caspian Sea and 145 km from the Black Sea (National Statistical Service of the Republic of Armenia 2016). The neighboring countries are Georgia-in the north, Azerbaijan-in the east, Turkey-in the west and southwest and Iran-in the south. Armenia is a typical mountainous country, average height above sea level is 1830 m, the lowest point is 379 m, the highest point is 4090 m (Vardanyan and Valesyan 2006). Agricultural lands occupy 68.81% of the country’s territory (National Statistical Service of the Republic of Armenia 2016).
The climate is highland continental, dry with four seasons. The average annual temperature in January is - 5 to 6 °C and + 14 to 1 °C in June. The average amount of precipitation is 683.4 mm.
2.2 Soil sampling
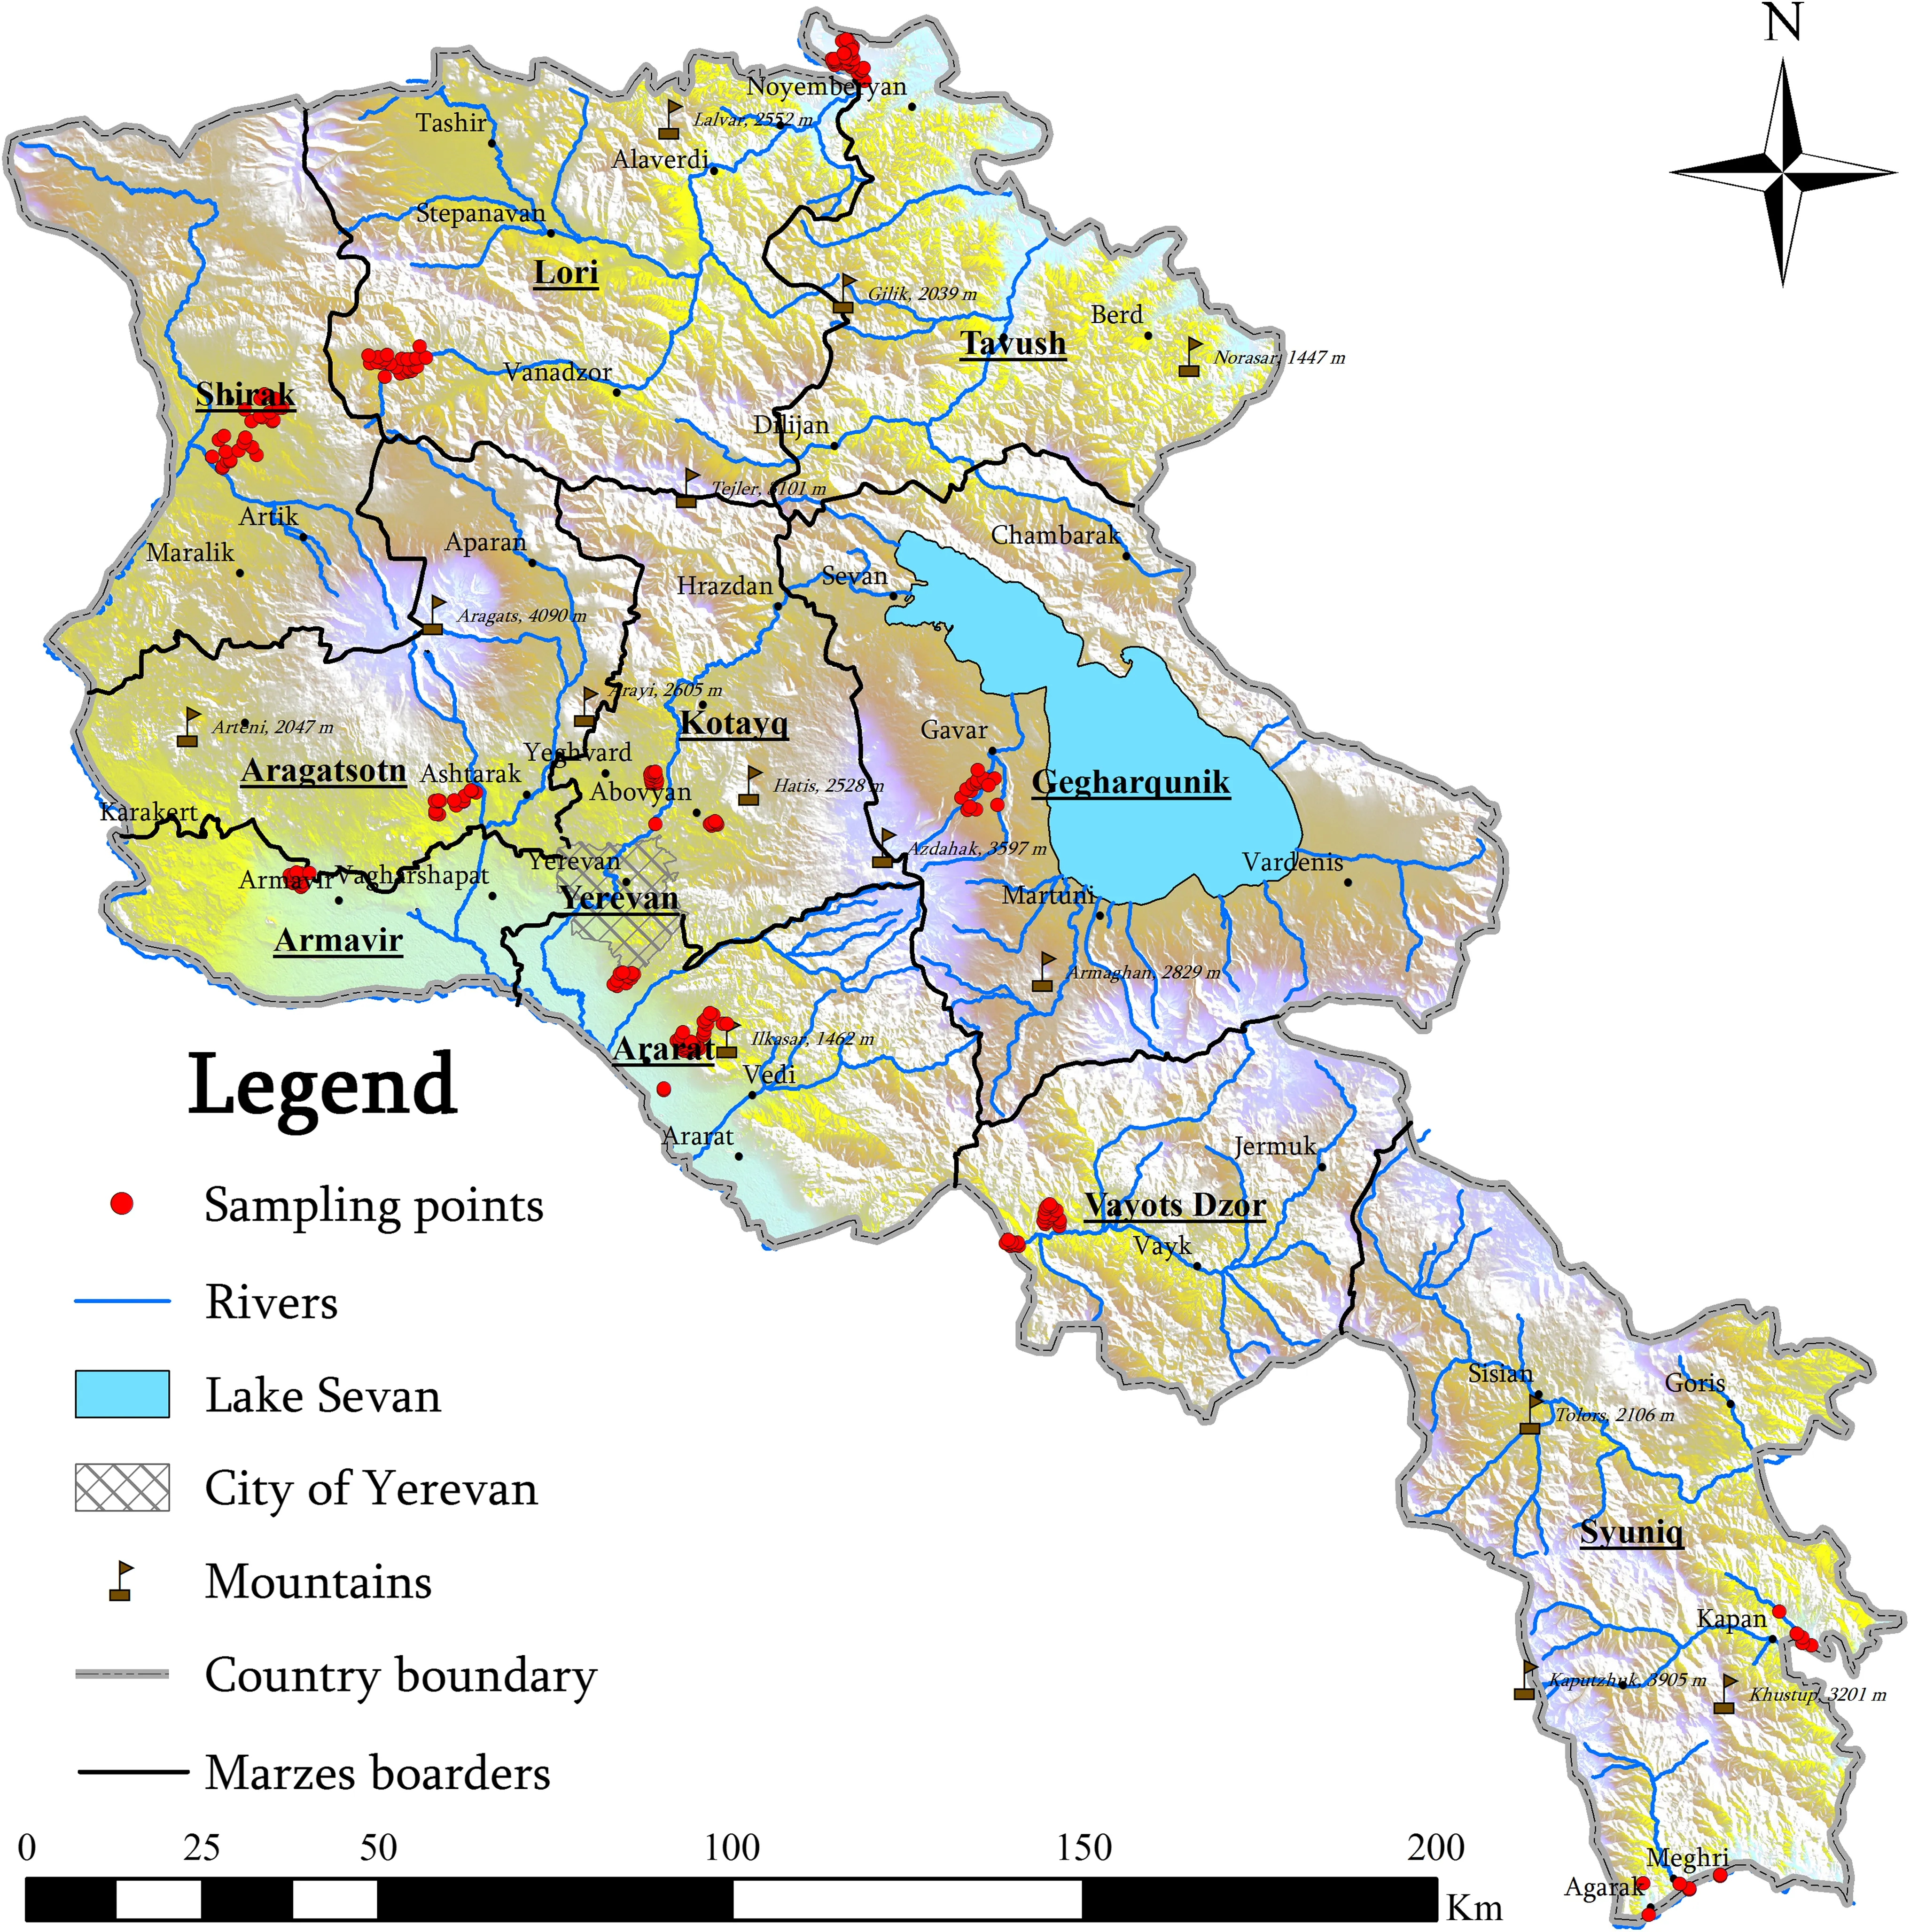
Agricultural soil sampling was carried out between 2014 and 2017 from the 25 rural communities having comparatively bigger agricultural plots with a significant amount of fruit and vegetable production. In total, 252 soil samples(Fig. 1 and Table 1) including 7 from pesticide repository sites once belonging to a former ‘‘Armselkhozqimia’’research and production association (Dvorska´ et al. 2012)were collected. Depending on the plowing depth, the agricultural land samples were taken from 15 to 40 cm soil layer. Sampling, quality assurance, and quality control(QA/QC) were done according to the SOPs (Standard Operation Procedure) developed in compliance with ISO 10381-1: 2002, ISO 10381-2:2002, ISO 103081-4:2003(ISO 2002a, b, 2003) standards and US EPA guideline (US EPA 1999). A stainless steel hand auger was used and from each agricultural plot 8-15 subsamples were collected following a zigzag pattern. Subsamples were mixed thoroughly to obtain a bulk sample, which was stored in plastic bag and transported to the laboratory. Soils were air-dried,homogenized and sieved (<2 mm), milled according to ISO-11464 (ISO 2006) and then stored in sealed bags until analysis.
2.3 Laboratory works
2.3.1 Extraction

Fig. 1 Distribution of agricultural soils sampling sites on the territory of Armenia
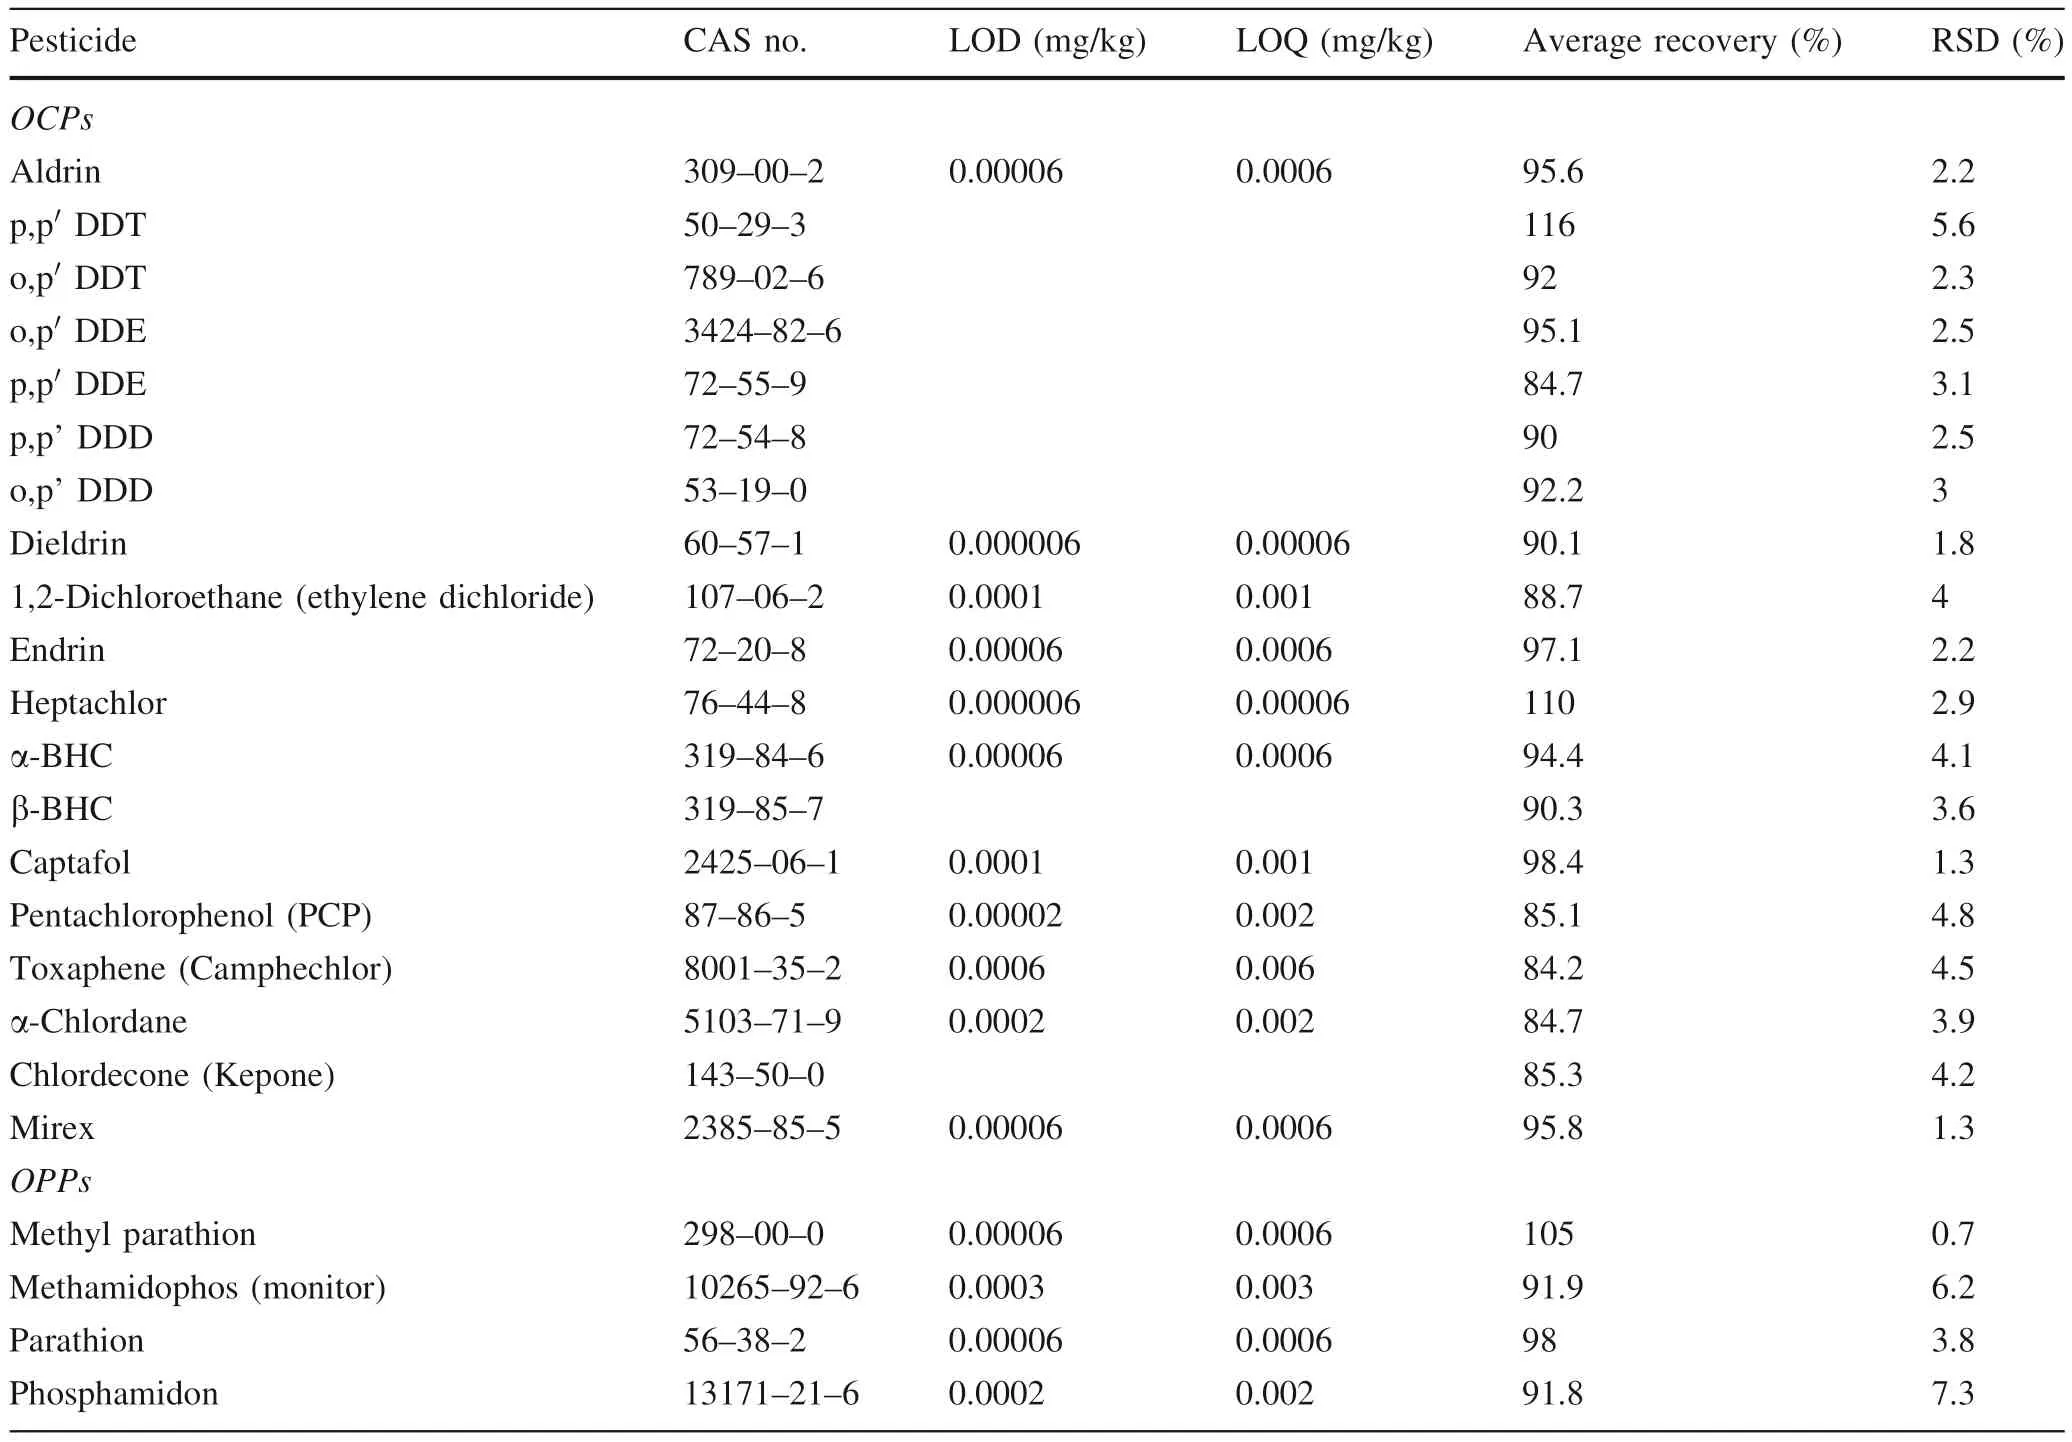
Extraction of prepared soil samples was carried out in compliance with Application method ASTM D-6010(ASTM D601012) using a Microwaves extractor Start E(Milestone, Italy) for detection of 22 forbidden OCP’s and OPP’s (in Armenia): Aldrin, p,p′DDT, o,p′DDT, o,p′DDE, p,p′DDE, p,p′DDD, o,p′DDD, Dieldrin, Endrin,Heptachlor, α-HCH, β-HCH, Captafol, Pentachlorophenol(PCP), Toxaphene (Camphechlor), α-Chlordane, Chlordecone (Kepone), Mirex, Methyl parathion, Methamidophos(Monitor), Parathion, Phosphamidon, as well as 1,2-dichloroethane (ethylene dichloride) which have been in common use in agriculture as fumigate (Table 2). 5 g of each pre-treated sample was taken, weighed to approximately 0.1 mg and transferred into the extraction vessels and to each sample, 30 mL of acetone-hexane (1:1 v/v) was added and placed into the microwave cavity. The microwave program was as follows: Step 1-10 min; 1000 W;120 °C, Step 2-20 min, 1000 W; 120 °C. After the vessels were cooled to room temperature solvents were filtered and near dried in rotary vacuum evaporator preparing the solvents for the clean-up which was conducted following EPA Method 3630C with some changes (US EPA 1996).The concentrated extracts were cleaned up through chromatographic column (30 cm x 10 mm internal diameter)filled with 3 g deactivated silica gel and 2 cm of anhydrous sodium sulfate and eluted with 50 mL of n-hexane/acetone(9:1 v/v). After eluate was concentrated again to some2 mL in a rotary evaporator. The ultimate solution was then used for determining residual pesticides by a gaschromatographic method.

Table 1 The amount of agricultural soil samples from each community of Armenia’s ten regions
2.3.2 Gas-chromatography coupled to mass spectrometer(GC-MS) analysis
The obtained extraction underwent chromatographic analysis using a gas-chromatograph (Trace GC Ultra; Thermo Electron Corporation, USA) automatic split-splitless injector (COMBI PAL; CTC Analytics AG, Switzerland)and mass selective detector (Trace DSQ; Thermo Electron Corporation, USA); ion source 265 °C. Separations were done by TRACE TR-5MS (0.25 mm internal diameter × 30 m × 0.25 μm; Thermo ScientificTM; USA) column. Helium was used as a carrier gas 1 mL/min. The gas chromatography operating program temperature was set for an initial temperature of 150 °C (held for 5 min) after increased to 290 °C (held for 5 min) at 5 °C·min-1.
2.3.3 Quality assurance and quality control (QA/QC)
QA/QC of analytical method was made by making working standard solutions by dilution of the stock standards (AccuStandard ISO 6468-PEST, Z004-SET, APP-9-071,P-254S, M-625C-2, M-525-REG-EA, APP-9-124, P-065S,P-155S, M-1657-03-20X (New Haven, USA) and mixtures of standards of different concentrations and were used for screening of the pesticide residues in soil. The average recovery for OCPs (organochlorine pesticides) ranges from 84.2% to 116%, for OPPs (organophosphorus pesticides)91.8%-105%. Relative standard deviation (RSD %) was ranging from 1.3% to 5.6% and from 0.7% to 7.3% for OCP’s and OPP’s respectively (Table 2). Limits of detection (LOD) and limit of quantification (LOQ) of pesticides are presented in Table 2.
2.4 Health risk assessment
Non-carcinogenic and carcinogenic risk assessment (US EPA 1989a), was done, and as the primary exposurepathway ofDDT for humans living in rural communities, soil ingestion was chosen. The following equations were used for calculations of non-carcinogenic risk levels(RAIS 2019):

Table 2 The limits of detection (LOD) and quantification (LOQ), average recovery and relative standard deviation (RSD) of pesticides

where: CDI is the chronic daily intake ofDDT; C is theDDT concentration in soil (mg/kg), EF is the exposure frequency: 245 day/year considering the period when rural dwellers are working in their gardens; ED is the exposure duration: 26 years for adult and 6 years in the case of children (RAIS 2019); IRS is the ingestion rate:100 mg/day for adults and in the case of children 200 mg/day; AT (average time) (AT = 365 day/year)(RAIS 2019), BW (average body weight, kg): 70 kg for adults (US EPA 1989a, b) and 15 kg in the case of children(RAIS 2019),: RfDisDDT reference dose (RAIS 2019).
Carcinogenic risk was assessed as individual lifetime cancer risk using following equations (RAIS 2019):

where: IFS is the ingestion rate-age adjusted: 26,600 mg/kg (RAIS 2019); CF is the Conversion factor: 10-6kg/mg;LT is the lifetime duration: 70 years (US EPA 1989a, b),DDT slope factor (RAIS 2019).
In the case of HQ >1, an adverse health effect could be expected, otherwise there is no possibility of non-carcinogenic risk (US EPA 1989a, b). The allowable limit for carcinogenic risk is 10-6-10-4.
3 Results and discussion
3.1 Pesticides contents in agricultural soils
In the 252 soil samples from the studied 25 rural communities from 23 investigated OCPs and OPPs, only DDT and its isomers contents were identified in 39 soil samples from 12 rural communities. The most frequently detected isomers of DDT were pp′-DDE, pp′-DDT, op′-DDT, op′-DDE, op′-DDD and op′-DDD 92.3%, 48.1%, 30.7%,10.2%, 7.7% and 5.1% respectively (Table 3). The degradation of DDT in soil into its metabolites (DDE and DDD)depends on different conditions and relevant concentration of them shows the application history of this pesticide. The higher DDT/∑DDT ratio indicates fresher usage and 0.5 was often applied value of the ratio to distinguish the historical and recent application (Li et al. 2014; Tao et al.2008). The ‘‘not detected’’ cases limited the calculation of the major cases provided in Table 3. The ratio DDT/∑DDT was calculated only for the 7 cases out of 39. In all other cases ∑DDT is mainly represented by the pp′-DDE contents suggesting the historical use. These 7 cases showed that only in one soil sample in Nor Geghi (Kotayq region) the ratio of DDT/∑DDT was 0.9 exceeding the value of 0.5 (Table 3) suggesting the new input of DDT. In all other 6 cases representing the samples of the Aramus rural community the ratios of DDT/∑DDT were below 0.5 indicating the historical input.

Table 3 The concentrations of DDT and its isomers (mg/kg) in soil samples collected from 7 settelments of RA
Identified ∑DDT contents range from 0.0028 to 46.49 with a mean of 2.01 mg/kg. Meanwhile, after the elimination of ∑DDT contents identified in three out of 7 samples taken near former pesticide storehouses (Jrashen-46.49 mg/kg, Khanjyan-0.088 mg/kg, Ptghavan-1.01 mg/kg), the mean value of ∑DDT in studied agricultural soils becomes 0.842 mg/kg and ranges 0.0028-7.32 mg/kg. It should be mentioned that mean∑DDT values are significantly high compared with the results of other studies worldwide (Kurt-Karakus et al.2006; Kumar et al. 2011; Modoodi and Niar 2012; Turgut et al. 2013; Li et al. 2014; Mukaj et al. 2016). Particularly,mean ∑DDT contents identified in the soils of selected agricultural plots in Armenia were 421, 84.2, 526 and 140.3 times higher than in the case of Turkey (Turgut et al.2013), Albania (Mukaj et al. 2016), North India (Kumar et al. 2011) and Beijing (Li et al. 2014), respectively.
The mean ∑DDT value exceeded the Maximum Acceptable Concentration (MAC) of 0.1 mg/kg stated in RA (RA Government 2010) 8.4 times. From the studied rural communities ∑DDT contents were observed in 1 sample from 12, 12 and 5 samples observed in Akhuryan(0.424 mg/kg), Nor Geghi (0.069 mg/kg) and Syunik(0.654 mg/kg) respectively, as well as in 2 samples out of 20 and 10 soil samples collected in Haghtanak (both 0.103 mg/kg) and Narek (0.013 and 0.778 mg/kg), correspondingly. From listed rural communities, soil ∑DDT contents excesses versus MAC were detected in one sample in Akhuryan, Syunik and Narek 4.2, 6.5 and 7.8 times,respectively.
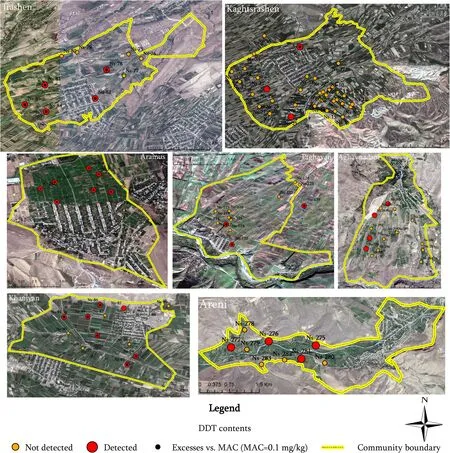
The rural communities where ∑DDT contents were detected in 3 and more soil samples (Fig. 2) were Jrashen,Qaghtsrashen, Arajmus, Ptghavan, Aghavnadzor, Khanjian, and Areni rural communities are discussed below.
3.1.1 Jrashen (Ararat region)
In Jrashen community ∑DDT contents identified in 5 out of 10 soil samples were 0.44, 0.75, 0.83, 5.36 and 46.49 mg/kg. These contents exceeded MAC 4.4, 7.5, 8.3,53.6 and 464.9 times. The data provided in Table 4 show that mean value (10.77 mg/kg) is essentially greater than median indicating highly skewed distribution. The latter is due to the presence of the maximum ∑DDT content in Jrashen which is also the highest identified content in all samples was detected in near the former pesticide storehouses. The latter suggests that some quantities of persistent organic pollutants remained in the areas of former pesticide storehouses. Therefore, this former pesticide storehouse may be an essential source of the Jrashen community soil pollution by organic pollutants and may become a trigger of potential environmental and health risks.
3.1.2 Qaghtsrashen (Ararat region)
From all studied rural communities the maximum number-36 soil samples were taken from Qaghtsrashen which is conditioned by the export potential and assortment of crops produced in this area. From 36 samples ∑DDT was identified in 3 samples: 0.003, 4.165 and 0.009 mg/kg. The data provided in Table 4 show that mean value (1.392 mg/kg) is essentially greater than median indicating highly skewed distribution and coefficient of variation (CV,172%). In Qaghtsrashen only one 41.6 times exceeded MAC value. The sample exceeding MAC was spatially located near the residential part of the community and according to the information provided by the local dwellers, some of theme still keep some quantity of forbidden pesticides in their homes and use it for pest control. This was also supported by the 2.77 mg/kg pp′-DDT consisting one of the ∑DDT samples.
3.1.3 Aramus (Kotayq region)
In the rural community of Aramus ∑DDT was detected in all 7 soil samples: 0.565, 0.357, 0.413, 0.218, 0.246, 0.369 and 0.334 mg/kg and all contents exceeded MAC value 5.6, 3.6, 4.1, 2.2, 2.5, 3.7 and 3.3 times, respectively. From Table 4 we can notice that the difference between mean and median values are low indicating the homogeneous distribution of identified contents. This is confirmed also by the low value of CV (32%). In the case of Aramus rural community the detected contents of ∑DDT have been identified as being the result of historical use (Table 3).
3.1.4 Ptghavan (Tavush region)
In the Ptghavan rural community from the studied 12 soil samples, ∑DDT was detected only in 3 samples with the mean contents of 0.594 mg/kg. Compared to Aramus rural community, where the data distribution is a bit skewed and the CV is 63%. The observed contents were 0.483, 1.01 and 0.29 mg/kg and exceeded MAC 4.8, 10.1 and 2.9 times, respectively. It must be noted that the highest content detected in Pthgavan was observed near the historical area of pesticide repository. In contrast to the Jrashen where highest content was observed near the former pesticide storehouses, in this particular case pesticide repository was eliminated. However, the detected contents indicate that some residual contents are still present and may become ecosystem and local people health risk factor.

Fig. 2 ∑DDT contents and excesses versus MAS in selected rural communities of Armenia
3.1.5 Aghavnadzor (Vayoc Dzor region)
Aghavnadzor rural community is known by its vineyard and here centralized are the vineyards of some of RA bigger vine production companies. So the soils of the vineyard pollution levels information are of particular interest. From 16 soil samples taken from the agricultural plots of Aghavnadzor rural community ∑DDT contents were identified only in 4 samples 0.017, 0.001, 0.016 and 0.006 mg/kg. From Table 4 we can notice that the mean and median values are identical suggesting the homogeneous distribution of identified contents. This is confirmed also by the low value of CV (42%). In Aghavnadzor the detected ∑DDT contents do not exceed MAC value. Itneeds to be mentioned that former pesticide storehouses were not identified on the community territory and detected contents may be the residuals of historical use of forbidden pesticides.

Table 4 Descriptive statistics of DDT contents associated health risk in rural communities
3.1.6 Areni (Vayoc Dzor region)
As Aghavnadzor, Areni rural community also is one of the centers of vine production in RA. Here ∑DDT contents were detected in 4 out of 9 soil samples. ∑DDT contents:0.015, 0.014, 0.013 and 0.010 with the mean of 0.013 mg/kg. The difference between mean and median suggests a left site asymmetry of data. The CV of detected ∑DDT contents is 42%. In Areni ∑DDT contents do not exceed MAC values. Here also former pesticide storehouses were not identified indicating that detected contents may be the residuals of the historical use of forbidden pesticides.
3.1.7 Khanjian (Armavir region)
In Khanjian rural community ∑DDT contents were detected in 7 samples out of 13 and were: 0.22, 0.77, 0.15,0.50, 7.32, 0.088, 5.12 mg/kg with the mean of 2.024 mg/kg. The data provided in Table 4 show that mean value is essentially greater than the median (0.5 mg/kg) indicating highly skewed distribution. The CV is also high: 146%.From 7 samples detected contents exceeded MAC value in 6 samples: 2.2, 7.7, 1.5, 5, 73.2 and 51.2 times, respectively. It should be noted that samples which do not exceed MAC value were spatially located near former pesticide storehouses.
3.2 Health risk from ∑DDT contents
The results of non-carcinogenic risk assessment (Table 4)showed that all observed ∑DDT contents in agricultural soils of rural communities showed HQ <1 indicating the absence of non-carcinogenic health effect. However, in the case of carcinogenic risk assessment CR values range from 9.91E-04 to 1.65E+01 with the mean of 6.97E-01 and in all cases were above allowable level of <10-4. Moreover,besides the single sample located in the Qaghtsrashen rural community showing the medium level (10-4-10-3) (Rapant et al. 2010) of carcinogenic risk in all other cases high level (>10-3) identified. The latter highlights the need for detailed studies in the areas where ∑DDT was detected and implementation of special measures in order to eliminate or reduce ∑DDT induced carcinogenic risk.
4 Conclusions
This study allows to identify that among studied pesticides(Aldrin, ∑DDT (sum), Dieldrin, 1,2-Dichloroethane,Endrin, Captafol, Heptachlor, HCH (sum), Methyl parathion, Methamidophos, Mirex, Parathion, Pentachlorophenol (PCP), Toxaphene, Chlordane, Chlordecone,Phosphamidon) only ∑DDT contents have been identified.Particularly, ∑DDT detected in 39 agricultural soil samples located in 12 rural communities in Armenia’s different regions. Among all detected contents the excesses versus national MAC were observed for 26 out of 39 samples and ranged from 1.03 to 464.9 times. The highest excess versus MAC was detected near the former pesticide storehouse located in the rural community of Jrashen (Ararat region).The human health risk assessment showed that identified contents do not pose a non-carcinogenic risk whereas carcinogenic risk was detected. Particularly observed carcinogenic risk to human health was above allowable limit of 10-4in all samples having detected ∑DDT contents.Both, the nationally stated MAC value and US EPA risk assessment method showed the possibility of an adverse health effect. Therefore, additional detailed studies should be implemented in areas where ∑DDT contents were identified in order to select and implement risk reduction measures to ensure better environmental management and high level of local population protection.
Acknowledgements The research results considered in this paper were obtained in the frames of a target Program ‘‘Monitoring of residual pesticides in food produced in the Republic of Armenia,2014-2018’’ funded by the State Committee for Science to the Ministry of Education and Science RA.
杂志排行
Acta Geochimica的其它文章
- Development of in-situ Micro-Raman spectroscopy system for autoclave experimental apparatus
- Exposure of children to heavy metals from artisanal gold mining in Nigeria: evidences from bio-monitoring of hairs and nails
- Constraints on granite-related uranium mineralizationin the Sanjiu uranium ore field, SE China provided by pyrite mineralogy, major and trace elements, S-He-Ar isotopes
- Fluid inclusion and H-O isotope study of the Jiguanshan porphyry Mo deposit, Xilamulun Metallogenic Belt: implications for characteristics and evolution of ore-forming fluids
- REE geochemistry of core sediments of Cauvery delta, India for provenance studies
- CO2 flux of soil respiration in natural recovering karst abandoned farmland in Southwest China
