Multifunctional A356 alloy/ PKSAnp composites: Microstructure and mechanical properties
2020-06-28AigbodionEzema
V.S. Aigbodion, I.C. Ezema
Department of Metallurgical and Materials Engineering, University of Nigeria, Nsukka, Nigeria
Keywords:PKSAnp A356 alloy Microstructure Electrical and mechanical properties
ABSTRACT Mechanical properties and microstructure of multifunctional composites produced with palm kernel shell ash nanoparticle (PKSAnp)-A356 alloy composites was studied. The composites were produced using Double layer feeding stir casting method (DLF-SCM) by adding 1 wt%-4 wt.% PKSAnp. The microstructure, density, electrical and mechanical properties were determined. The results shows that there was a uniform distribution of the PKSAnp in A356 alloy. The mismatch at the interface between the PKSAnp and A356 alloy was 4.26%. Improvement of 30.47%, 41.91%, 49.52%, 40.90% and 65.09% were obtained for hardness values, tensile, yield strength, %elongation and impact energy at 4 wt% PKASnp.The work has established that the developed composites can be used for multifunctional applications where combination of toughness and strength is vital.
1. Introduction
Multifunctional metal matrix composites have unique properties that made them to be used in several areas of applications such as transpiration,building,aviation,defense and biomedical etc.[1].The achievements of these unique properties, for example, the combination of toughness, strength and hardness which are difficult to be obtained from cast composites as results of excess reaction product [2].
Effort has been made by researcher,to improve the properties of multifunctional metal matrix composites either by the modification of casting method or by used of nanoparticles as reinforcement[3].Hamedan and Mohammad[4]reported on the effect of processing parameter on the mechanical properties and microstructure of A356 alloy reinforced with 1 wt% SiC nanocomposites. They observed that stirring rate and stirring temperature affect the properties and structure of the composites.Stirring rate of 700 rpm and stirring temperature of 750°C achieved the best properties.Yar et al. [5] reported on the mechanical properties of A356 alloy reinforced with MgO nanoparticles. They observed increases in compressive strength and hardness values. Amirkhanlou et al. [6]reported on the properties of A356/SiCp composites. The authors observed high impact energy and low hardness values compared to the matrix.Prasad et al.[7]reported on the strength and hardness values of A356/Rice husk ash composites using stir casting. They observed higher tensile strength and hardness values of the composites when compared with the matrix.
A combined novel rheocasting and squeeze casting method was used to improve the interfacial bonding and mechanical properties of A356 alloy and multi-walled carbon nanotubes (MWCNTs) by Abou et al. [8]. The MWCNTs varies from 0.5% to 2.5%. They obtained 49.35% and 281.8% increase in tensile strength and elongation at 1.5% MWCNTs. Brittle fracture surface was obtained at percentage of MWCNTs beyond 1.5%.
In recent years agro-waste,has become a potential materials for the reinforcement of metal matrix composites for engineering application. These could be attributed to the facts that agro-waste materials are: low cost, ecofriendly and light weight [9]. Many of the agro-waste such as: bean pod [2], eggshells [10], bagasse [11],breadfruit shell[12]and PKS[9]have been used as a reinforcement for aluminium matrix composites (AMCs). The used of agro-waste as reinforcement generates many reaction products and decreased the toughness of the composites.Ajibola and Fakeye[13]studied the properties of Zinc-Aluminium alloy reinforced with silicon carbide and palm kernel shell ash (PKSA). SiC was keep constant and PKSA was varied from 0.2 wt%to 1.0 wt%at interval of 0.2 wt%. They observed increases in tensile strength, hardness values and low impact energy as wt.% PKSA increases in the formulation. In order to expand work in this novel area that motivates the present research.In this study the combine effect of DLFSCM method and nanoparticles will be used to enhance the properties of A356alloy/PKSA for multifunctional applications.
Nomenclature
PKSAnp Palm kernel shell ash nanoparticles
DLF-SCM Double layer feeding stir casting method
TEM Transmission Electron Microscope
SEM Scanning Electron Microscope
XRD X-ray diffractometer
2. Materials and method
The palm shell used in the study was obtained in the oil processing mill in Nsukka Nigeria. The shell was cleaned and dried,they were packed in graphite crucible and ashes in a muffle furnace at 900°C to obtained palm kernel shell ash (PKSA). The PKSA was pulverized in high intensity ball milling machine. The fine PKSA particles were treated with 50 g of NaOH in 1 dm3of water.Sol gel method was used in the production of PKSAnp used in the work.
The elemental composition of the PKSAnp was determined using X-Ray Fluorescence (XRF) analysis. The particles were formed into pellets in a pelletizer with hydraulic press (Carver Inc). The pellets were then sealed into the chamber of the XRF(Amptek Inc)and allowed to run for 1000 s at a voltage of 30 kV,and a current of 50 μA. The resulting spectrum measured the elemental composition of the material.
The composites were produced using A356 alloy (Al-7%Si-0.3%Mg) and PKSAnp from 1 wt% to 4 wt% with interval of 1 wt%. A double layer feeding-stir casting method (DLF-SCM) was used in the production of the composites. Detailed of the production process is explain elsewhere[2].During the melting process,nitrogen gas was purge into the melting metal inside the crucible to avoid oxidation and reduction of the elements and PKSAnp. Preheated metallic mould was used to cast the composites.The sand was used as a supported for the metallic mould. Fig. 1 shows some photographs of the production process.
Transmission and scanning electron microscopes of model JOEL JSM 5900 scanning was used to determine the various microstructure and interfacial reactions. A Bruker D8Ɵ-Ɵ X-ray diffractometer was used to determine the various phases form in the composites. Scherres Eq. (1) was used in the determining the particle size.

Where λ is the wave length of X-Rays,β is FWHM(full width at half maximum), θ is the diffraction angle and D is particle diameter.Bragg's law was used for the estimate of the interspacing distance(d)(Eq.(2))and the dislocation density(ρ)was calculated from Eq.(3).

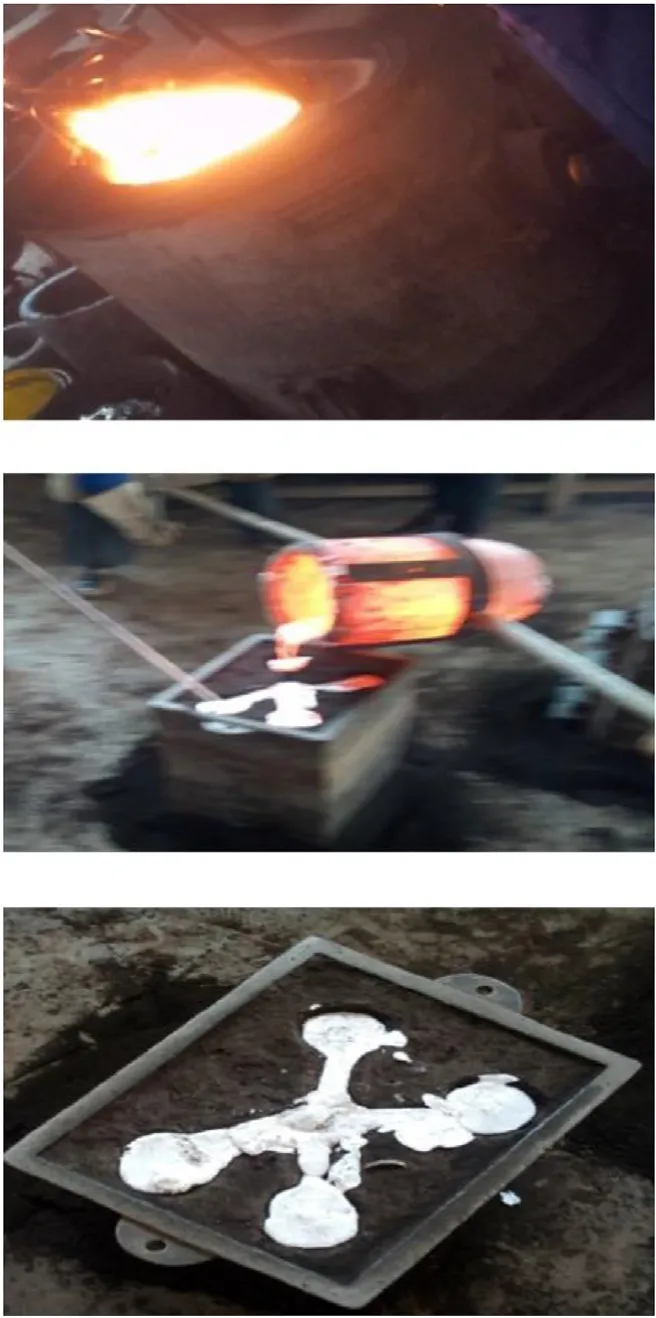
Fig.1. Photographs of the casting process.
The theoretical density (ρth) of the composite was determined using the rule of mixture. Archimedes' principle was used to determine the experimental density (ρed). The volume fraction of void was then calculated as Eq. [4]:

Vicker hardness tester(Walter Uhl Ablar Germany)was used to determine the hardness values accordance with ASTM E384. The tensile test was carried out at room temperature using Testometric Machine.The test was conducted accordance with ASTM D 3039.A 10 mm/min was used for the crosshead speed. Avery Denison Charpy impact tester was used to determine the impact energy. A sample of size 75 mm×10 mm×10 mm with 2 mm notch depth and 45°angle was used. The test was conducted accordance with ASTM D256.A DV power ohmmeter with model RM0600 was used to determine the electrical conductivity and resistivity.
3. Results and discussion
3.1. Particle size and chemical composition of the PKSAnp
The average size of the PKSAnp used in the experiment as reinforcing phase was 50 nm,which was measured with a Malvern 215 Zetasizer Nano Series Nano-ZS model instrument (see Fig. 2).
The XRF chemical composition of the PKSAnp is displayed in Table 1.The XRF analysis confirmed that SiO2andMgOwere found to be major constituents of the ash. SiO2and MgO are known to be among the hard substances [10]. Some other oxides viz:Cr2O3.Fe2O3,K2O,Na2O and MnO were also found to be present in traces.
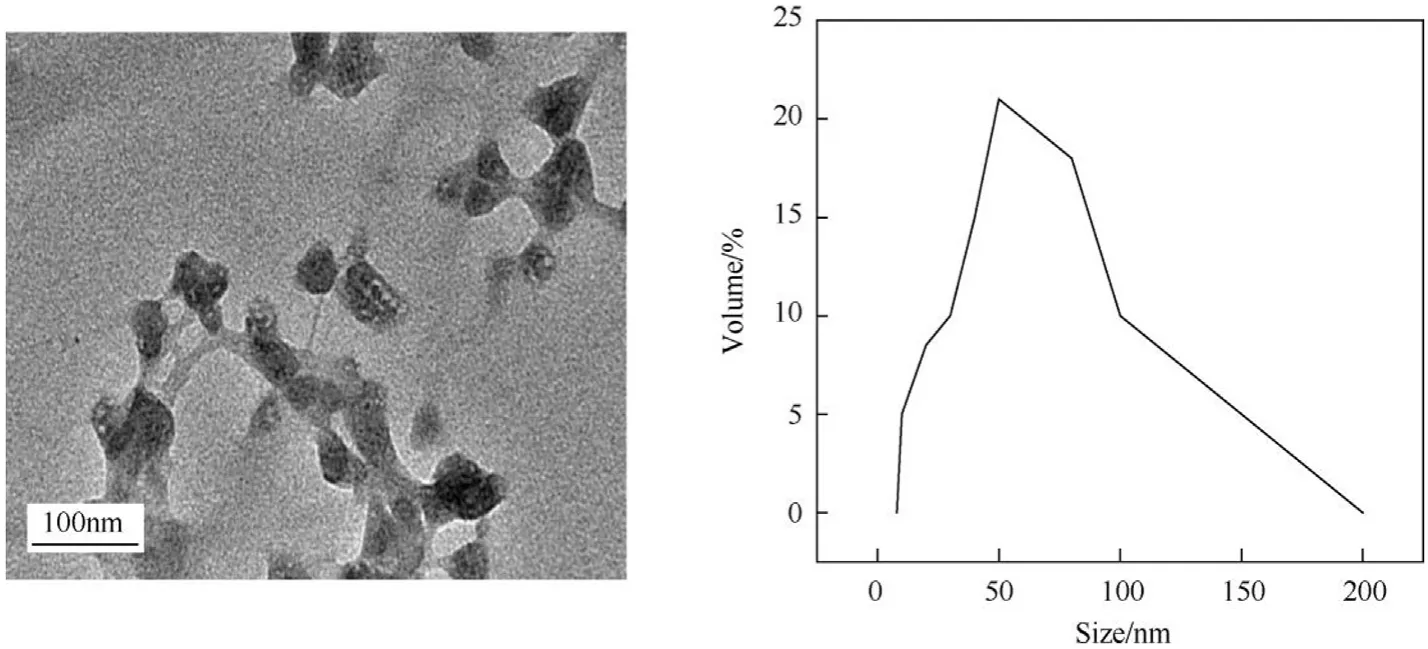
Fig. 2. TEM and nano-analyzer of PKSAnp.

Table 1 XRF analysis of Palm Kernel shell nano-particles.
3.2. XRD analysis
XRD was used to determine the various phases formed in the composites. In Fig. 3, it can be seen that the diffraction peaks are similar between the alloy and the composite with some additional smaller peaks presence in the composite. The major phases of the alloy are: α-Al (111, Hexagonal), Al12Mg7(411, Cubic), Mg2Si(200,Cubic). In the composite, the phases presence in the alloy are also presence in the composite with addition of SiO2(101,Hexagonal),Mg2SiO4(311, Cubic), C (103, Hexagonal) and SiC (002, Hexagonal)(see Fig. 3). The presence of: SiC, SiO2, Mg2SiO4in the composites could be attributed to the presence of silica and MgO as the main constituents of the PKSAnp (see Table 1). The formation of brittle reaction products such as Al4C at the interface was not observed.This was achieved because the method used in the production of the composites help to decrease the solidification time and reduced excess reaction products.
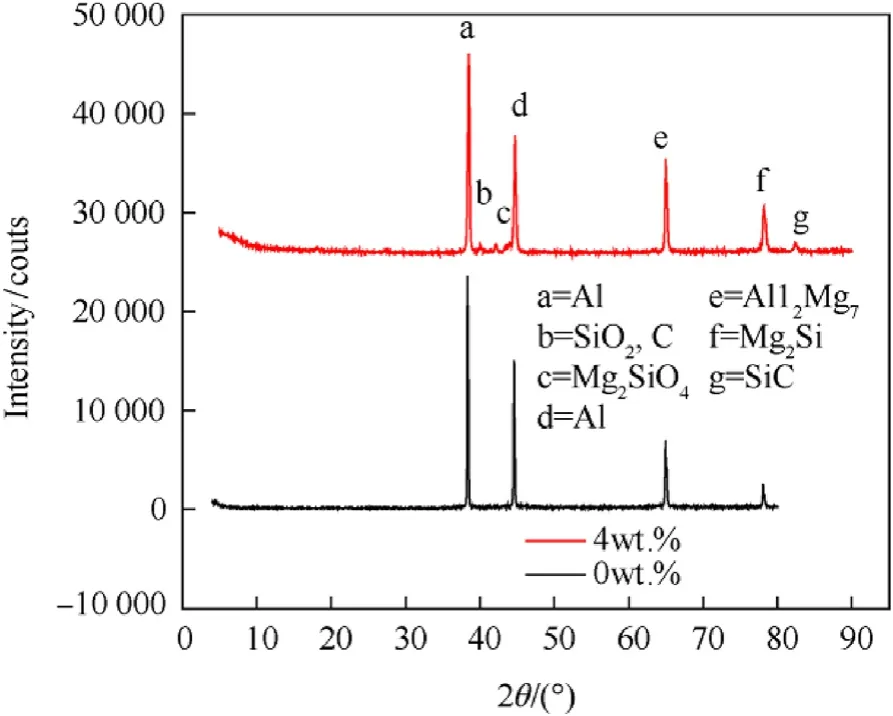
Fig. 3. XRD analysis of the alloy and it composites with PKSAnp.
The crystal structure and dislocation density were determined by XRD using Eq. (1)-(3) above. The crystal structure of the major phase in the alloy is cubic α-Al (d111): a=4.0494 Å, b=4.0494 Å,c=a=4.0494 Å, α=90°, β=90°and γ=90°with dislocation density of 2.70 g/cm3.The crystal structure of the major phase in the PKSAnp d101(Hexagonal) is a=4.8016 Å, b=4.8016 Å,c=a=5.3177 Å, α=90°, β=90°and γ=120°with dislocation density of 2.82 g/cm3.The mismatch in the interface between α-Al(d111) and PKSAnp (d101) was calculated as:A value of 4.26% was obtained.
3.3. Microstructure
Fig. 4 displayed the Backscattered SEM microstructure of the alloy and the composite. It was observed that the metal phase is shows as white phase and the PKSAnp as black phase. In Fig. 4(a),white structure of Al12Mg7and Mg2Si in the matrix of α-Al was observed. The presence of the PKSAnp phases which is black was distributed within the boundaries of the Al12Mg7and Mg2Si phases.However, segregation and agglomeration of the reinforcement normally formed during stir casting was not observed in Fig. 4(b).
TEM was further used to discuss the interface and boundaries,it was observed that the PKSAnp was distributed along the Al-grains and denoted as black and the alloy phase denoted as white. However a relatively fine and homogeneous grain sizes were formed(see Fig. 5). From Fig. 5(a) and 5(b) there is high generation of dislocation density within the interface between the matrix and reinforcement. Dislocation structure at the interface was visible and coherent interface with regular arrangement of PKSAnp was observed.
3.4. Density
Fig.6 displayed the results of the density and void space in the composites.
From Fig. 6, it was obvious that the density of the composites decreased as the wt.% of PKSAnp increases in the formulation. For example, a density of 2.65 g/cm3and 2.47 g/cm3was obtained for the A356 alloy and 4 wt%PKSAnp-A356 composite respectively(see Fig. 6).
The lower values of the density of the composite could be attributed to the low density of the PKSAnp (1.45 g/cm3) which is lower than the density of pure aluminum which is 2.7 g/cm3. A value of 0.25 was obtained for the void space in the composite with 98.9%densification at 4 wt%PKSAnp.The low value of void and high percentage of densification in this work is attributed to the DLFSCM method used in the production of the composites which help to decrease the void space.
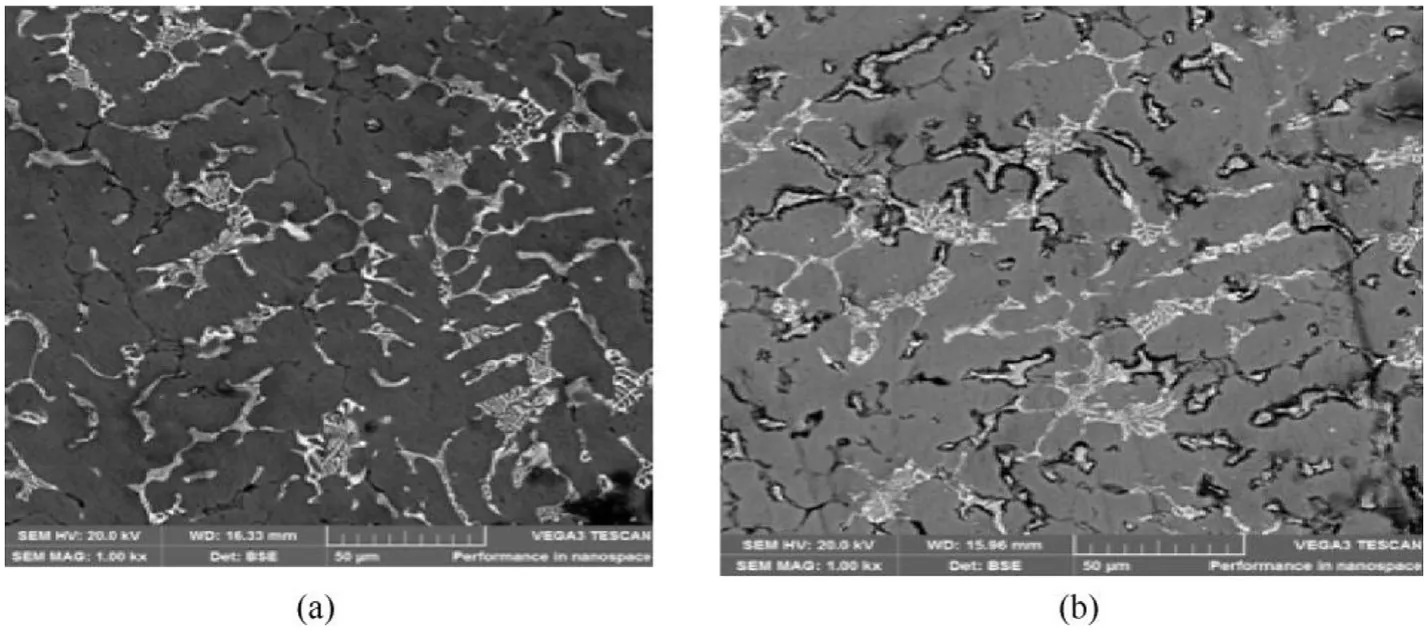
Fig. 4. (a) Backscattered SEM image of A356 alloy (b) Backscattered SEM image of A356-4 wt%PKSAnp.
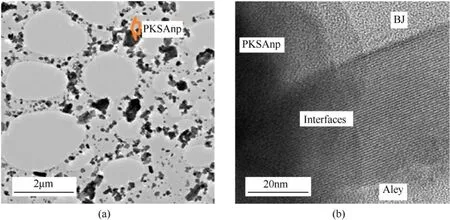
Fig. 5. 5a, b: TEM image of A356alloy with 4 wt%PKSAnp.
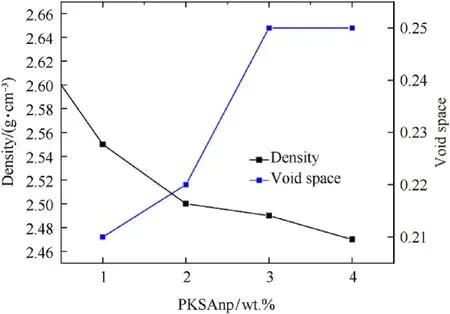
Fig. 6. Variation of density and void space with wt.% PKSAnp.
3.5. Hardness values
Fig.7 displayed the results of the hardness values.From Fig.7,it was clearly seen that the hardness values of the A356 alloy improved with increasing in the wt.% PKSAnp. The high hardness values of the composites can be attributed to the presence of hard phase of SiO2(101,Hexagonal), Mg2SiO4(311, Cubic), C (103,Hexagonal)and SiC(002,Hexagonal)in the composites(see Fig.7)and also the mismatch between the A356 alloy and the PKSAnp at the interface generates high dislocation density at the composites(see Fig. 5). Similar observation was observed in the work of [10-12]. A 30.47% improvement of hardness values was obtained at 4 wt% PKSAnp.
3.6. Tensile properties
Fig.8(a)displayed the force versus extension plot of the tensile test, while Fig. 8(b) shows the yield and the ultimate tensile strength. From Fig. 8(a), it was seen that the graphs of the A356 alloy and that of the composites were similar. The composites and the master A356 alloy have large area under the force versus extension plot.This large area under the force versus extension plot obtained for the composites is one of the major achievements in this present work. The brittle nature which generally occurred in cast composites, which resulted to the premature failure of the composites after the maximum strength,was not observed.
From Fig. 8(b), it was seen that both the yield and tensile strength raises as the wt.%PKSAnp increases in the master alloy.For example, the values of 105.0, 135.7, 145.5, 149.8, 157.0 MPa and 185.6, 210.9, 226.3, 235.8, 263.4 MPa were obtained for the yield and tensile strength at 0 wt%, 1 wt%, 2 wt%, 3 wt% and 4 wt%PKSAnp. Improvements of 41.91% and 49.52% were obtained for tensile and yield strength at 4 wt% PKASnp. This general increases in the tensile strength can be attributed to the fine grain size and grain boundary which suffer pining and results to high dislocation density of the composites. The high dislocation density generated in the composites may restrict the free movement of dislocation within the grain boundary and hence increases in the strength of the materials (see Figs. 3 and 5) [13]. The high yield and tensile strength obtained can be attributed to the fact that the high thermal stress generates at the interface is as a results of the large change in the coefficient of thermal expansion between the PKSAnp and A356 alloy [10].
Fig. 9 shows the fracture surface of the A356 alloy and composites at 4 wt% PKSAnp. The fracture surface shows cup and cap surface which is attributed of a fracture surface of a tough and ductile materials.Deboning and broken down of the PKSAnp at the interface was not observed in this study,this shows a high bonding force between the A356 alloy and PKSAnp. Void nucleation and growth, interfacial DE cohesion resulting from excess interfacial reaction products and fracture of the PKSAnp were not observed in this work.Ductile regions covered the PKSAnp with fine round and non-spherical dimples resulted to high ductile at the interface.
3.7. Toughness
The%elongation and impact energy were used to determine the toughness of the composites. Fig.10 displayed the results of the %elongation and impact energy. It can be recalled that the major problem of particles reinforcement is the low toughness of the materials as a results of particle agglomeration and cluster etc.From Fig.10,it can be seen clearly that both%elongation and impact energy increases as the wt.% PKSAnp increases. The improvement in the toughness of the materials can be explained by Eq. (5) [12-13].
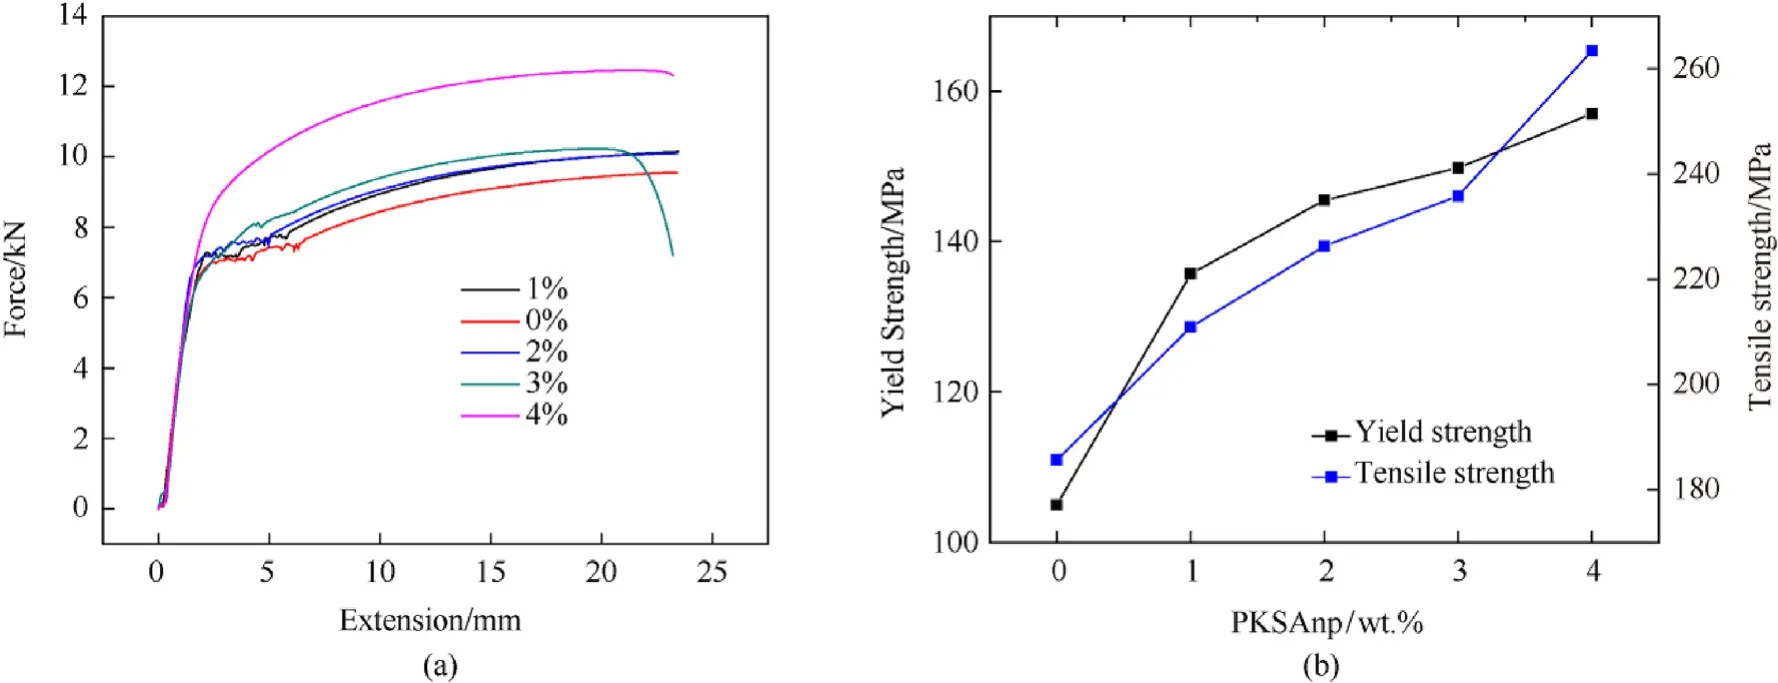
Fig. 8. a: Variation of force with extension for the A356/PKSAnp.
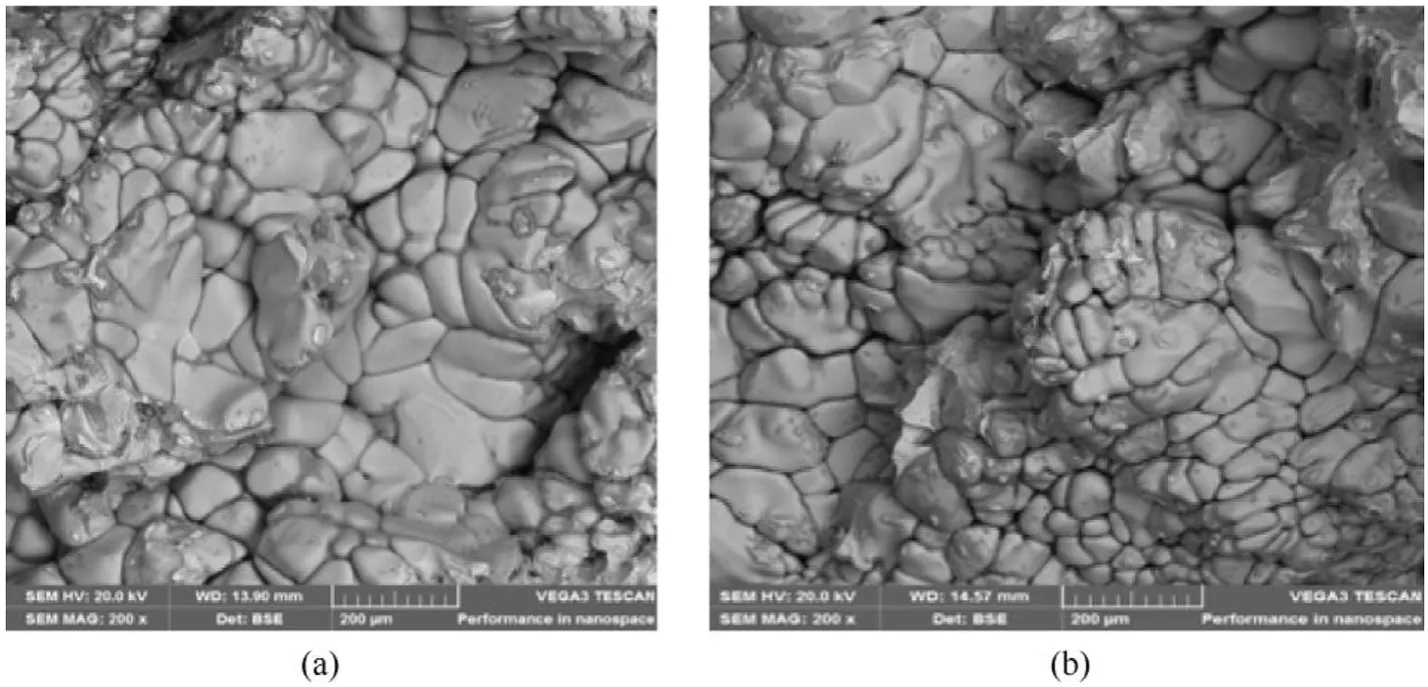
Fig. 9. 9a: Tensile fracture surface of A356 alloy 9b: Tensile fracture surface at 4 wt% PKSAnp.
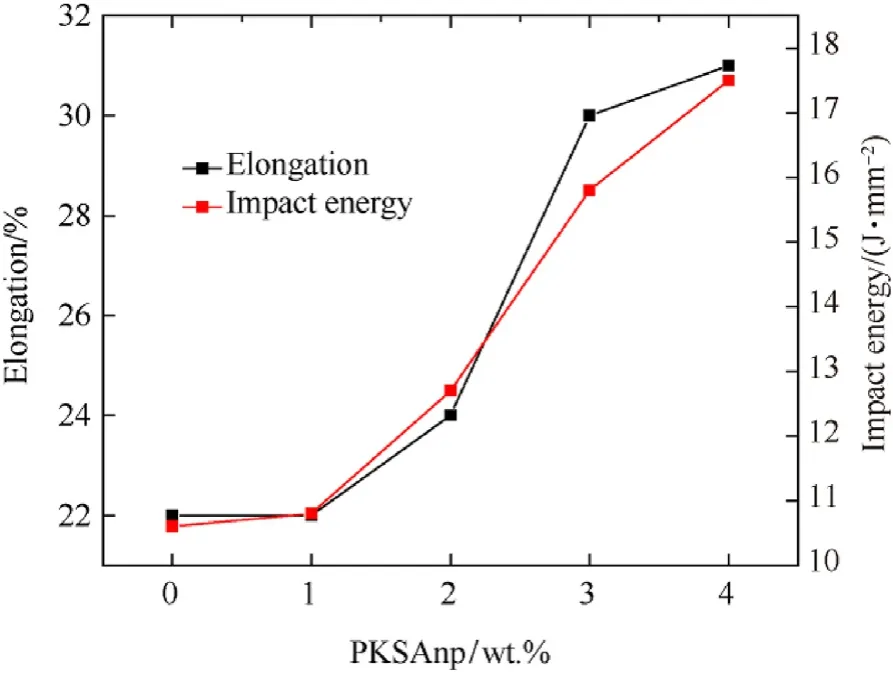
Fig.10. Variation of Elongation and impact energy with wt.% PKSAnp.

Where σf=stress on particle, γ =fracture energy at surface,E=elastic modulus of the particles,C=crack length.The value of C is very vital in the determination of the toughness of the materials.The higher or coarser the values of C and great tendency for weak bonding between the matrix and the particles,because particles are arrange within the particle/matrix interface.In this work there is a very small value of C which enhances the interfacial bonding of the A356 ally/PKSAnp at this interface. This result is in line with the tensile fracture and TEM discussed above. The improvement of 40.9%in%elongation and 65.09%in impact energy were obtained at wt.% PKSAnp.
3.8. Electrical properties
The results of the electrical conductivity and resistivity are shows in Fig.11.From Fig.11 it obvious seen that the results of the electrical conductivity is opposite that of electrical resistivity. The electrical conductivity decreased as the wt.%of PKSAnp increases in the formulation, while that of electrical resistivity increases with increases in wt.%PKSAnp.This could be attributed to the facts that the presence of PKSAnp alter the original crystallographic arrangement of the A356 alloy and cause mismatch.This mismatch in the crystallographic arrangement decreased electron mobility of the matrix and led to high electrical resistivity.
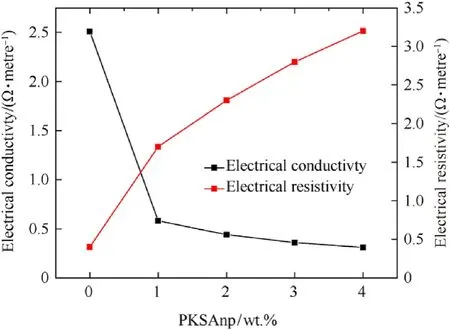
Fig.11. Variation of Electrical conductivity and Resistivity with wt.% PKSAnp.
4. Conclusions
Mechanical properties and microstructure of multifunctional composites produced with PKSAnp-A356 alloy composites was studied. Based on the discussion above it can be concluded that:
1. The mismatch at the interface between the PKSAnp and A356 alloy was 4.26%.
2. A value of 0.25 was obtained for the void space in the composite with 98.9% densification.
3. Improvement of 30.47%,41.91%,49.52%,40.9%and 65.09%were obtained for hardness values, tensile, yield strength, % elongation and impact energy at 4 wt% PKASnp.
4. The work has established that the developed composites can be used for multifunctional applications where combination of toughness and strength is vital.
Conflicts of interest
There is no conflict of interest in the course of this work.
Acknowledgement
The authors would like to acknowledge Tertiary Education Trust Fund (TETFund) Nigeria for providing financial aid for this project under the project number: TETFUND/DESS/UNI/NSUKKA/2017/RP/VOL.I.
杂志排行
Defence Technology的其它文章
- An infrared target intrusion detection method based on feature fusion and enhancement
- The effect of sintering and cooling process on geometry distortion and mechanical properties transition of PTFE/Al reactive materials
- Flow computations past a triangular boattailed projectile
- Structure design and property adjustment of new cage rich-nitrogen pentazolyltetraazacubanes as potential high energy density compounds
- Sensor radiation interception risk control in target tracking
- Microstructural characterization of silicon carbide reinforced dissimilar grade aluminium explosive clads
