Multi-Scale Structure and Physicochemical Properties of Highland Barley Starch Following Dry Heat Treatment
2020-04-25BIANHuaweiZHENGBoCHENLingZHUHuilian
BIAN Huawei, ZHENG Bo, CHEN Ling, ZHU Huilian,*
(1. School of Public Health, Sun Yat-Sen University, Guangzhou 510080, China; 2. Guangdong Province Key Laboratory for Green Processing of Natural Products and Product Safety, Engineering Research Center of Starch & Protein Processing, Ministry of Education,School of Food Science and Engineering, South China University of Technology, Guangzhou 510640, China)
Abstract: In this study, changes in the multi-scale structure and physicochemical properties (digestibility and pasting properties) of highland barley starch before and after dry heat treatment (DHT) under alkaline conditions at different pH levels were explored by scanning electron microscopy, particle size and distribution analysis, small-angle X-ray scattering,X-ray diffraction and gel permeation chromatography. The results indicated that with the increase in pH value, DHT decreased the viscosity and retrogradation value but increased the paste stability of the starch paste. These changes resulted from an increase in starch highly-ordered structures and crystallinity and the rearrangement of degraded starch molecules.Moreover, the DHT starch possessed greater proportions of slowly digestible starch (SDS) and resistant starch (RS). The degraded starch with a molecular molar mass below 2 × 10⁷ g/mol showed increased helix content, greater crystallinity with a more ordered cr ystalline lamellae, promoting SDS and RS formation. Overall, these results suggest that DHT is a promising approach for the regulation of starch digestibility with suitable pasting properties, which can provide valuable information for the rational design of highland barley starch-based products.
Keywords: highland barley starch; dry heat treatment; multi-scale structure; pasting properties; digestibility
Highland barley (Hordeum vulgare L. var. nudum hook. f.),a characteristic species of the Qinghai-Tibet Plateau of China,has been of great interest in recent years due to its distinctive composition and high nutritional value[1-2]. At present, the applications of highland barley mainly include food, wine and feed while few high-value processed products are available because of its backward processing technology[3].Starch is one of the main functional components of highland barley, occupying 75% to 80% of the endosperm, and accounting for the main use of highland barley[4-5]. Thus, the diverse properties of highland barley starch (HBS) such as pasting viscosity, paste clarity and digestion could extend the potential of using HBS for various food and industrial applications[6-7]. However, very few studies have been carried out on the physicochemical and digestion properties of HBS and the effect of starch modification on these properties.
Starch is the major storage carbohydrate in many plants and is one of the main food components and energy sources for humans[8]. For nutritional purposes, starch is generally classified into three major fractions depending on the rate and extent of in vitro digestion, rapidly digestible starch (RDS),slowly digestible starch (SDS) and resistant starch (RS)[9-11].RDS is related to a high glycemic index (GI), whereas SDS and RS have physiological advantages, such as improved glucose tolerance and insulin resistance, reduced blood lipid levels, and a prebiotic effect[12]. To the best, the digestion properties were determined by the multi-scale structure of starch[13-14]. In relation to this, a variety of techniques,including chemical, physical, and enzymatic, that modify starch structure, have been used to improve the SDS and RS characteristics of starch pastes[15-17]. Therefore, achieving suitable starch digestibility along with good cooking and processing performance is the key to improving starch nutritional function.
Dry heat treatment (DHT) is a physical modification method that combines heat treatment with a dry process,specifically it refers to heat treatment in a relatively “dry”(moisture content less than 10%) state at temperatures ranging from 60-200 ℃[18-19]. It is shown that DHT alters the structural features, e.g., molecular mass, helices, crystallinity and granule,and thus affect the digestion and pasting properties for different starches[20-22]. It also showed that after DHT, the viscosity of starch paste increased, which was similar to that of chemical crosslinking[23]. Moreover, starch granules after DHT are easily destroyed, and some of the amylopectin chains are degraded into amylose, which leads to the formation of starch-lipid complex, and thus the crystallinity is improved[24]. Interestingly, DHT combined with alkaline treatment can transform RDS fractions into the resistant forms[23]. However, in few studies so far, how DHT affects the physicochemical features (digestion, pasting behaviors, etc.)of HBS has not been wholly revealed especially from a view point of hierarchical structure. Meanwhile, the relationship between multi-scale structure and physicochemical features is not clear. Thus, the paper reports our new efforts in understanding the rational development of HBS with desirable pasting and digestion properties following DHT.
In this study, the effects of the DHT on the changes in the multi-scale structures (i.e., molecular mass, helices,crystallites, lamellae and granule) of HBS after soaking in 0.1 mol/L sodium carbonate solution at pH 8.5, 9.0, 9.5, or 10.0 were investigated. In addition, the paste behaviours and digestibility of the HBS after DHT were measured. Based on this, the underlying structure-property relationship was discussed for HBS following DHT.
1 Materials and methods
1.1 Materials and reagents
HBS Qinghai Gaojian Biotech Co. Ltd.; Porcine pancreatic α-amylase (Cat.No. P-7545, 8 U/g) and amyloglucosidase (A3306, > 300 U/mL) American Sigma-Aldrich company; Glucose oxidase-peroxidase assay kit(GOPOD-format) Ireland Megazyme company; Dimethyl sulfoxide (DMSO, chromatographic grade) American Burdick & Jackson company. All other chemicals were of analytical grade.
1.2 Instruments and equipments
EVO18 scanning electron microscopy (SEM)Germany Carl Zeiss microscopy company; Mastersizer 2000 particle size analyzer UK Malvern company; SAXSess camera with TCS 120 temperature-controlled unit and MCR302 rotary rheometer Austria Anton-Paar company;Xpert PRO diffractometer Netherlands Panlytial company;5.0 μm membrane fi lter American Millipore Co.; Styragel HMW 7 DMF gel permeation chromatography (GPC)columns (7.8 mm × 300 mm, 8 mm × 300 mm, respectively)American Waters company; Tensor 37 spectrometer and AVANCE III HD 400 spectrometer Germany Bruker company.
1.3 Methods
1.3.1 Modification of HBS with DHT
HBS with moisture content less than 10% were dry heated under different alkaline conditions. About 20 g (dry basis) of HBS was mixed with 100 g of distilled water to produce starch slurries. The pH of the different starch slurries was adjusted to 8.5, 9.0, 9.5, or 10.0 with 0.1 mol/L sodium carbonate solution respectively. The starch slurries were placed at room temperature for 2 h, then filtered and dried at 40 ℃ for 12 h. The samples obtained were ground and sieved using a 160-mm mesh and their moisture content was controlled to be about 10%. Subsequent about 15 g sample was performed by baking at 160 ℃ for 2 h in baking oven, and the sample was evenly spread. Then, the samples obtained were ground and sieved using an 80 mm mesh. The HBS after DHT at different pH values were referred to as DpH8.5, DpH9.0, DpH9.5, and DpH10.0. All the modification experiments were performed at least in triplicate.
1.3.2 SEM observation
The samples were placed on double-sided conductive tape and an air gun was used to blow away any excess starch powder. After being coated with a gold layer, the samples were analyzed using an SEM with an operating voltage of 10.0 kV.
1.3.3 Particle size and distribution analysis
A Mastersizer 2000 particle size analyzer was used to evaluate the particle size and distribution of the HBS after DHT. The volume particle size and particle size distribution of the samples were measured at a shading of 15%-20% and a pump speed of 1 800 r/min.
1.3.4 Small-angle X-ray scattering analysis
Small-angle X-ray scattering (SAXS) measurements were performed using a SAXSess camera and Cu-Kα radiation (wavelength 0.154 2 nm) at 40 kV and 50 mA[25-26].Samples with similar moisture contents (60%, m/m) were prepared and then statically equilibrated in centrifugal tube at 25 ℃ for 24 h before analysis. The samples were placed into the paste sample cells, fixed, and placed in a TCS 120 temperatur e-controlled unit along the line-shaped X-ray beam in the evacuated camera housing. Samples were exposed to the incident X-ray monochromatic beam for 10 min. The data, recorded using an image plate, were collected by the Image Plate Reader software with a storage phosphor system. All data were normalized, and the background intensity and smeared intensity were removed using SAXSquant 3.0 software.
1.3.5 X-ray diffraction analysis
X-ray diffraction (XRD) analysis was performed with an Xpert PRO diffractometer, operated at 40 mA and 40 kV, using Cu-Kα radiation with a wavelength of 0.154 2 nm as the X-ray source. The scanning diffraction angle(2θ) was from 5° to 40° with a scanning speed of 10°/min and a scanning step of 0.033°. The moisture content of each sample was about 10%. The relative crystallinity of each sample was calculated using the PeakFit software (Ver. 4.12)[27].
1.3.6 GPC-multi-angle light scattering analysis
The weight-average molecular molar mass (Mw) and the molecular molar mass distribution of the samples were analyzed using a GPC system coupled with a multi-angle light scattering (MALS) detector and a refractive index(RI) detector[28]. 5 mg (dry basis) of each starch sample was suspended in 10 mL of the mobile phase, heated in boiling water for 1 h, and then shook at 60 ℃ for 12 h to fully dissolve starch in the mobile phase. The solution was passed through a 5.0 μm membrane filter and transferred to sample bottles before injection into the GPC column.Two GPC columns (7.8 mm × 300 mm, 8 mm × 300 mm,respectively) (whose temperature was controlled at 50 ℃)and a wavelength of 658 nm were applied in the experiment.DMSO with LiBr (50 mmol/L), as the mobile phase, was firstly filtered through a 0.22 μm poly(tetrafluoroethylene)membrane fi lter and then degassed with ultrasound treatment.The fl ow rate and total injected volume were 0.3 mL/min and 0.1 mL, respectively. The light scattering data were collected and analyzed using the Astra V software program using dn/dc = 0.074 mL/g[14].
1.3.7 Amylose content analysis
The amylose content of each sample was determined using a modified method of ISO 6647-2: 2007 Rice determination of amylose content- Part 2 routine methods[29].
1.3.8 Attenuated total reflection-Flourier transformed infrared spectroscopy analysis
The Flourier transformed infrared spectra (FTIR) of the samples were recorded on a Tensor 37 spectrometer equipped with a deuterated triglycine sulfate (DTGS) detector using an attenuated total reflectance (ATR) accessory at a resolution of 4 cm-1. For each spectrum, 64 scans were recorded at a wavelength region between 800 and 1 200 cm-1using an empty cell as the background. All spectra were baselinecorrected and normalized. The absorbance intensities of the bands at approximately 1 047 and 1 022 cm-1were used to investigate starch short-range order structure[30]. The peak intensities in regions between 1 047 and 1 022 cm-1of the deconvoluted spectra were calculated by recording the heights of the absorbance bands from the baseline.
1.3.913C Cross-polarization/magic angle spinning-nuclear magnetic resonance spectroscopy
Solid-state13C cross-polarization/magic angle spinning-nuclear magnetic resonance (CP/MAS NMR) was performed on a AVANCE III HD 400 spectrometer equipped with a 4 mm broad-band double-resonance MAS probe.Approximately 500 mg (dry basis) of samples were placed into the spinner and inserted into the center of the magnetic field. The NMR spectrum with CP and MAS was recorded at 100.613 MHz at a temperature of 295 K. A total of more than 6 000 scans were accumulated for a spectrum with a recycle delay of 2 s. All the spectra were then decomposed into several peaks through deconvolution using PeakFit version 4.12[31-32]. For quantitative analysis, the total spectra were decomposed into amorphous and ordered phases by subtracting the scaled amorphous starch spectrum until zero intensity was attained at C4 resonance for the difference spectrum. The intensity of the C4 resonance is solely due to amorphous contributions.
1.3.10 Pasting properties
Pasting properties were studied using an rotary rheometer under rotational mode with a shear rate of 250 r/min. The samples slurries (6%,m/m) were heated from 30 ℃ to 95 ℃ at a heating rate of 7.5 ℃/min, held at 95 ℃ for 30 min, and cooled to 50 ℃ at a rate of 7.5 ℃/min.The samples were then held at 50 ℃ for 30 min. Changes in viscosity were then recorded.
1.3.11In vitrostarch digestibility
In vitrostarch digestibility was analyzed using the Englyst procedure with some modifications[33-34]. For preparation of the enzyme solution, 3 g of porcine pancreaticα-amylase was dispersed in 20 mL of deionized water with magnetic stirring for about 30 min and then centrifuged at 4 000 r/min for 20 min. The supernatant (13.5 mL) was gathered and mixed with 0.7 mL of amyloglucosidase and 1 mL of distilled water. The enzyme solution should be freshly prepared before every digestion experiment. Starch sample(1.0 g, dry basis), 20 mL 0.1 mol/L acetate buffer (pH 5.2),and five glass balls (diameter of 1.5 cm) were placed into a 50 mL test tube and equilibrated at 37 ℃ in a water bath for 10 min. Then, 5 mL of enzyme solution freshly prepared as described above was added and enzyme digestion was carried out at 37 ℃. After 20 and 120 min, 0.5-mL aliquots of the hydrolyzed solution were withdrawn and added to 20 mL of 66% ethanol with mixing. The aliquots collected after 20 and 120 min were designated G20 and G120, respectively. After centrifugation (7 269 r/min, 2 min),the glucose concentration of the supernatant in G20 and G120 was measured using a GOPOD kit. The fractions of RDS,SDS, and RS were calculated then.
1.4 Statistical analysis
The datas were statistically analyzed using the SPSS 20.0 statistical package and are presented as the mean ± standard deviation. Differences between the groups were assessed using an analysis of variance, andP< 0.05 was considered to indicate a statistically significant difference between two groups.
2 Results and Analysis
2.1 Changes in granular morphology and granular size distribution of HBS before and after DHT
Table 1 Granule volume size distribution of native HBS and DHT HBS

Table 1 Granule volume size distribution of native HBS and DHT HBS


Fig. 1 Granule volume size distribution (A) and SEM photographs (B)of native HBS and DHT HBS
This experiment only measured DpH8.5to illustrate the effect of DHT on granular size distribution of HBS. The granule size distribution of native and DHT HBS (DpH8.5)granules was determined (Fig. 1A and Table 1) and the results indicated that the starch after DHT had an increase in their granule size. From Table 1, it can be seen thatD(0.5)of Peak A rises from 3.02 μm (HBS) to 3.73 μm (DpH8.5) and Peak B showed an increase inD(0.5)(from 20.12 μm (HBS) to 21.32 μm (DpH8.5)). These changes in diameter arise principally because pre-treatment with the alkaline solution resulted in different degrees of swelling of the HBS granules.After DHT there were very few changes observed in the granular morphology of the HBS; the surface of the granules remained smooth and round (Fig. 1B).
2.2 Changes in lamellar and crystalline structure of HBS before and after DHT
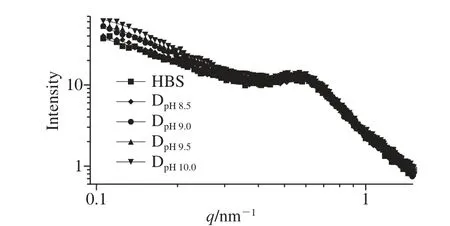
Fig. 2 Double-logarithmic SAXS patterns of native HBS and DHT HBS
Starch structure at the nano scale, such as the semi-crystalline lamellae, has been extensively investigated using SAXS. As can be seen from Fig. 2, a characteristic peak at around 0.60 nm-1was observed for the native HBS, which corresponds to a Bragg distance of 10.47 nm. However, peak intensity decreased and the overall intensity at the small angle region was enhanced as the pH increased, indicating that the Bragg distance of the starch samples increased gradually after DHT, and semi-crystalline structure was destroyed to some extent at the same time. These effects could be explained by the fact that the starch molecules in the amorphous lamellae and amorphous background are easily deprotonated under the alkaline conditions at high temperature resulting in a slight destruction of the hydrogen-bonding network accompanied by an increase in molecular motion[35]. Overall, with increasing of the pH value, the deprotonated effect of the HBS became deeper, which lead to the worse compactness of lamellar structure.
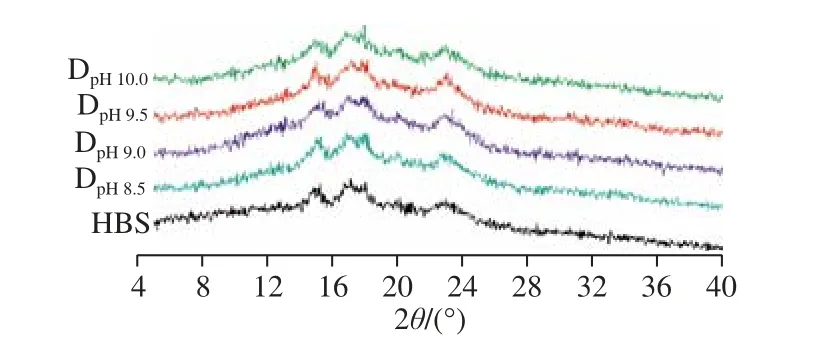
Fig. 3 XRD patterns of native HBS and DHT HBS

Tabllee 22 R11 004477/11 002222,, Mw, relative crystallinity, and relative contents of different conformations of native HBS and DHT HBS
Fig. 3 shows the X-ray diffraction patterns of the HBS after DHT. It can be seen that both native and DHT HBS showed a typical A-type diffraction pattern with strong peaks at 2θof 15.28°, 17.32°, 18.10° and 22.98°. With increasing of pH during DHT, the diffraction peak intensity and relative crystallinity (Table 2) increased accordingly. It should be noted that the intensity of diffraction peaks and the relative crystallinity decreased slightly when the pH increased to 10.0 but were still greater than those in native HBS.
2.3 Changes in molecular molar mass of HBS before and after DHT

Fig. 4 Changes in molecular molar mass of native HBS and DHT HBS
After DHT, theMwdecreased as the pH increased from 8.5 to 9.5. TheMwdecreased from 8.796 × 10⁷g/mol for the native HBS to 2.753 × 10⁷g/mol for DpH8.5,1.343 × 107g/mol for DpH9.0, and 1.003 × 10⁷g/mol for DpH9.5, respectively. When the pH was further increased to 10.0 theMwincreased to 2.114 × 10⁷g/mol. It indicated that the starch chain was inhibited from breaking when the alkali concentration was too high. All fractions of the native HBS molecules were greater than 4 × 10⁷g/mol(Fig. 4). While after DHT, the starch molecular molar mass significantly decreased and the fractions of the molecular molar mass greater than 4 × 10⁷g/mol were only less than 13% remaining for all the DHT samples. Particularly for the DpH9.5sample, only 0.95% starch molecules had a molecular molar mass higher than 4 × 10⁷g/mol.For the DpH8.5sample, 50.5% of molecules were in the range of 1 × 10⁷-2 × 10⁷g/mol and 36.9% of molecules were in the range of 2 × 10⁷-4 × 10⁷g/mol. For the DpH9.0, DpH9.5, and DpH10.0samples, 86.9%, 93.9%, and 71.1% of molecules were lower than 2 × 10⁷g/mol, respectively. These data show that the HBS molecules became significantly degraded by DHT as the pH increased. The most likely explanation for this is that amylopectin chain scission occurs in the amorphous lamellae region during DHT[36].
2.4 Changes in amylose content and molecular short-range ordered structure of HBS before and after DHT
From Table 2, the amylose contents of the HBS after DHT were slightly greater than the native HBS with the highest value of 24.07% obtained for the sample DpH9.5. When the pH was further increased to 10.0 the amylose content decreased to 22.59%. This is mainly because the side chains of the amylopectin molecules were cleaved and formed short chain amylose molecules. Meanwhile, different pH conditions could regulate the breaking degree of molecular chains in DHT HBS[37]. This is similar to the result that the moisture content of the system influences the breaking degree of molecular chains in heat-moisture treatment of breadfruit starch[34].

Fig. 5 13C CP/MAS NMR spectra of native and DHT HBS
The IR absorbance bands at 1 047 and 1 022 cm-1have been shown to be associated with short-range ordered and amorphous structures of starch, respectively[38]. TheR1047/1020values were calculated and shown in Table 2. Clearly, the ratio of ordered structures to amorphous structures increased with pH increasing from 8.5 to 9.5. However, further increasing the pH to 10.0 leads to a slight reduction in this ratio. Compared with the native HBS, DHT increases the content of the ordered structures of HBS granules, which is consistent with the XRD results showing the effect on relative crystallinity.
The13C CP/MAS NMR spectra of starch samples (Fig. 5)were used to further analyze the short-range structures (singleand double-helices). The results were shown in Table 2.DHT HBS granules had more A-type double helix, and less V-type single helix and amorphous conformations, compared with native HBS. The V-type single helix and amorphous conformations were further decreased by increasing the pH from 8.5 to 9.5 during DHT. In particular, the DpH9.5sample possessed the highest A-type double helix relative content,the lowest V-type single helix and amorphous conformation relative content (Table 2). However, when the pH was further increased to 10.0 during DHT, the A-type double helix conformation relative content decreased whereas the V-type single helix and amorphous conformation relative contents increased compared with those in the DpH9.5sample. The ratio between the ordered and amorphous conformations indicated that DHT improved the starch molecular conformation transformation from the amorphous state to the more ordered double helix and single helix states, which is consistent with the SAXS, XRD, and ATR-FTIR data.
2.5 Changes in the pasting properties of HBS before and after DHT

Fig. 6 Viscosity curves of native HBS and DHT HBS
Table 3 Pasting characteristics of native HBS and DHT HBS
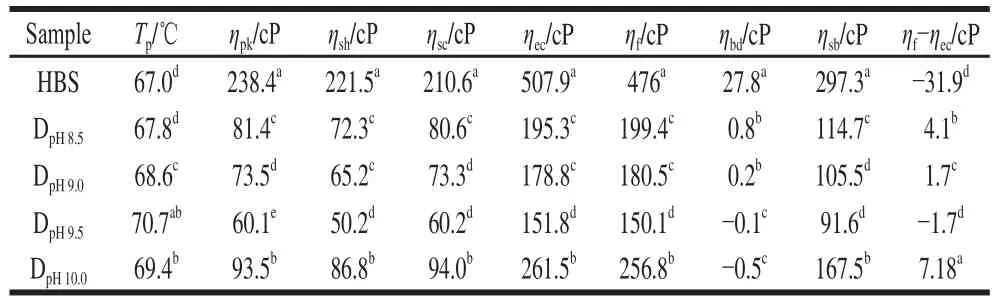
Table 3 Pasting characteristics of native HBS and DHT HBS
Fig. 6 shows the pasting curves of native and DHT HBS.The related parameters are listed in Table 3. After DHT, the Tpincreased with increasing pH from 8.0 to 9.5; the DpH9.5sample showed the highest Tpat about 70.7 ℃, indicating that DHT strengthens the resistance of starch granules to swelling and rupture in aqueous medium because of the more ordered single and double helix short-range structures, and a higher degree of relative crystallinity that occurred after DHT.Additionally, an overall reduction in the ηpkat different pH values was observed for the DHT HBS, presumably because of the molecule degradation that occurred during DHT, as revealed by changes in the molecular mass, amylopectin chain length distribution, and more crystallization. Moreover,this reduction in ηpkbecame more distinct as the pH increased from 8.0 to 9.5. When the pH was increased to 10.0 during DHT, the pasting parameters except for Tpincreased due to the formation of higher ordered structures and increased crystallinity in the DHT HBS granules.
Specifically, the DHT HBS displayed a smaller ηbdthan that of the native HBS, indicating a higher paste stability during shearing at the high temperature of 95 ℃. During paste cooling, the degraded molecular chains of DHT HBS were less easy to rearrange. Therefore, the DHT HBS had a lower tendency for reorganization and a greater paste stability during cooling as demonstrated by the reduced ηsb, as well as the difference of ηf-ηec(Table 3). It is concluded that the paste stability during the cooking and cooling process was enhanced with increasing pH during DHT. Based on these results, the greater paste stability is likely due to the improved resistance of DHT HBS granules to swelling and rupture during the heating and cooling process. This improved resistance is a direct result of the formation of higher ordered structures and increased crystallinity in the DHT HBS granules. In addition, the lower reorganization tendency could arise from the lower aggregation and rearrangement ability of the smaller, degraded, starch molecules.
2.6 Changes in digestibility of HBS before and after DHT
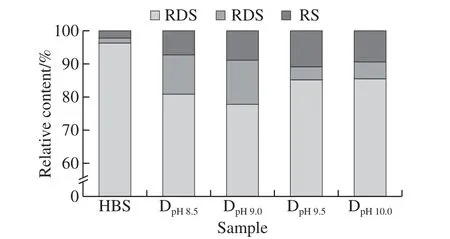
Fig. 7 Digestibility of native HBS and DHT HBS
The RDS, SDS, and RS relative contents of native and DHT HBS are shown in Fig. 7. Compared with those of the native HBS, the SDS and RS relative contents of all the DHT HBS were significantly increased. In particular,the total SDS and RS relative contents for DpH9.0reached 22.25%. Combined with the multi-scale structural changes that occurred after DHT, these data indicate that DHT under alkaline conditions induced an improvement in starch molecular motion and chain arrangement. Thus, more ordered and compact aggregation structures formed after DHT,including more ordered and compact crystalline lamellae structure, greater crystallinity, and more ordered single and/or double helix short-range structures, which likely decreases starch digestibility.
Interestingly, the ratio of SDS and RS also differed significantly depending on the pH. The DpH8.5and DpH9.0samples have more SDS, whereas the DpH9.5and DpH10.0samples have more RS. This is because the generation of SDS is mainly influenced by the amorphous structures of the starch granules, whereas RS is generally obtained due to the presence of more ordered structures. The different DHT conditions (principally the pH) influenced the structures of the starch granules at different levels, leading to variations in the SDS/RS ratio of different samples. Compared with the different multi-scale structural changes between the two sample sets of DpH8.5, DpH9.0and DpH9.5, DpH10.0, these data indicate that in degraded HBS molecules with a molecular mass between 1 × 10⁷to 2 × 10⁷g/mol, a moderate proportion of helix ordered structures, increased crystallinity, and more ordered amylopectin crystalline lamellae all contribute to the formation of SDS. In contrast, in degraded HBS molecules with a molecular mass below 1 × 10⁷g/mol, a greater single and double helix structure, moderate crystallinity and more ordered amylopectin crystalline lamellae all contribute to formation of RS.
3 Conclusion
This work provides relationship between multi-scale structure, digestibility and pasting properties of HBS when under DHT. It is concluded that the higher ordered structures and crystallinity, the lower aggregation and rearrangement of degraded smaller starch molecules that occur after DHT contribute to the decrease in the maximum viscosity,overall viscosity and retrogradation, and an increase in the paste stability. Furthermore, a suitable molecular mass of HBS molecules, helical structure composition, relative crystallinity, and ordered amylopectin crystalline lamellae,resulting from DHT at different pHs, determines the rate and extent of starch digestion. In particular, the total SDS and RS content of the HBS could be increased up to 22.25%after DHT at pH 9.0. Overall, the results here contributed to understanding the effects of DHT (combined with alkaline treatment) on the digestibility and pasting properties of HBS from a hierarchical structural view, which thus are of value for HBS products with regulated digestibility and pasting performance.
References:nces:
[1] GONG Lingxiao, JIN Chengwu, WU Liliang, et al. Tibetan hull-less barley (Hordeum vulgare L.) as a potential source of antioxidants[J].Cereal Chemistry, 2012, 89(6): 290-295. DOI:10.1094/CCHEM-03-12-0029-R.
[2] ZHU Fengmei, DU Bin, XU Baojun. Superfine grinding improves functional properties and antioxidant capacities of bran dietary fi bre from Qingke (hull-less barley) grown in Qinghai-Tibet Plateau,China[J]. Journal of Cereal Science, 2015, 65: 43-47. DOI:10.1016/j.jcs.2015.06.006.
[3] XIA Xuejuan, LI Guannan, XING Yuxiao, et al. Antioxidant activity of whole grain highland hull-less barley and its effect on liverprotein expression profiles in rats fed with high-fat diets[J]. European Journal of Nutrition, 2017, 57(6): 2201-2208. DOI:10.1007/s00394-017-1494-z.
[4] BELOBRAJDIC D P, JOBLING S A, MORELL M K, et al.Wholegrain barley β-glucan reduced diet intake but did not improve glucose tolerance despite increasing fermentation in rats[J]. Journal of Nutrition and Intermediary Metabolism, 2014, 1: 19. DOI:10.1016/j.jnim.2014.10.061.
[5] SHARMA P, GUJRAL H S, ROSELL C M. Effects of roasting on barley β-glucan, thermal, textural and pasting properties[J]. Journal of Cereal Science, 2011, 53(1): 25-30. DOI:10.1016/j.jcs.2010.08.005.
[6] LI J H, VASANTHAN T, ROSSNAGEL B, et al. Starch from hullless barley. I. granule morphology, composition and amylopectin structure[J]. Food Chemistry, 2001, 74(4): 395-405. DOI:10.1016/S0308-8146(01)00246-1.
[7] SONG Y, JANE J. Characterization of barley starches of waxy,normal, and high amylose varieties[J]. Carbohydrate Polymers, 2000,41(4): 365-377. DOI:10.1016/S0144-8617(99)00098-3.
[8] VAMADEVAN V, BERTOFT E. Structure-function relationships of starch components[J]. Starch-Stärke, 2015, 67(1/2): 55-68.DOI:10.1002/star.201400188. DOI:10.1002/star.201400188.
[9] WANG Hongwei, LIU Yufan, CHEN Ling, et al. Insights into the multi-scale structure and digestibility of heat-moisture treated rice starch[J]. Food Chemistry, 2018, 242: 323-329. DOI:10.1016/j.foodchem.2017.09.014.
[10] SILVA W M, BIDUSKI B, LIMA K O, et al. Starch digestibility and molecular weight distribution of proteins in rice grains subjected to heat-moisture treatment[J]. Food Chemistry, 2017, 219: 260-267.DOI:10.1016/j.foodchem.2016.09.134.
[11] XU Jinchuan, KUANG Qirong, WANG Kai, et al. Insights into molecular structure and digestion rate of oat starch[J]. Food Chemistry,2017, 220: 25-30. DOI:10.1016/j.foodchem.2016.09.191.
[12] ZHENG Bo, WANG Hongwei, SHANG Wenting, et al. Understanding the digestibility and nutritional functions of rice starch subjected to heat-moisture treatment[J]. Journal of Functional Foods, 2018, 45:165-172. DOI:10.1016/j.jff.2018.03.041.
[13] KITTISUBAN P, LEE B H, SUPHANTHARIKA M, et al. Slow glucose release property of enzyme-synthesized highly branched maltodextrins differs among starch sources[J]. Carbohydrate Polymers,2014, 107: 182-191. DOI:10.1016/j.carbpol.2014.02.033.
[14] WANG Hongwei, ZHANG Binjia, CHEN Ling, et al. Understanding the structure and digestibility of heat-moisture treated starch[J].International Journal of Biological Macromolecules, 2016, 88: 1-8.DOI:10.1016/j.ijbiomac.2016.03.046.
[15] ALMANZA-BENITEZ S, OSORIO-DÍAZ P, MÉNDEZMONTEALVO G, et al. Addition of acid-treated unripe plantain fl our modified the starch digestibility, indigestible carbohydrate content and antioxidant capacity of semolina spaghetti[J]. LWT-Food Science and Technology, 2015, 62(2): 1127-1133. DOI:10.1016/j.lwt.2015.02.031.[16] SUI Zhongquan, YAO Tianming, ZHAO Yue, et al. Effects of heatmoisture treatment reaction conditions on the physicochemical andstructural properties of maize starch: moisture and length of heating[J]. Food Chemistry, 2015, 173: 1125-1132. DOI:10.1016/j.foodchem.2014.11.021.
[17] ZHANG Binjia, CHEN Ling, LI Xiaoxi, et al. Understanding the multiscale structure and functional properties of starch modulated by glowplasma: a structure-functionality relationship[J]. Food Hydrocolloids,2015, 50: 228-236. DOI:10.1016/j.foodhyd.2015.05.002.
[18] JACOBS P J, HEMDANE S, DELCOUR J A, et al. Dry heat treatment affects wheat bran surface properties and hydration kinetics[J]. Food Chemistry, 2016, 203: 513-520. DOI:10.1016/j.foodchem.2016.02.062.
[19] QIU Chao, CAO Jinmiao, XIONG Liu, et al. Differences in physicochemical, morphological, and structural properties between rice starch and rice flour modified by dry heat treatment[J]. Starch-Stärke, 2015, 67(9/10): 756-764. DOI:10.1002/star.201500016.
[20] CHANDANASREE D, GUL K, RIAR C S. Effect of hydrocolloids and dry heat modification on physicochemical, thermal, pasting and morphological characteristics of Cassava (Manihot esculenta)starch[J]. Food Hydrocolloids, 2016, 52: 175-182. DOI:10.1016/j.foodhyd.2015.06.024.
[21] QIU Chao, LI Xiaojing, JI Na, et al. Rheological properties and microstructure characterization of normal and waxy corn starch dry heated with soy protein isolate[J]. Food Hydrocolloids, 2015, 48: 1-7.DOI:10.1016/j.foodhyd.2015.01.030.
[22] SANDHU K S, SHARMA L, KAUR M. Effect of granule size on physicochemical, morphological, thermal and pasting properties of native and 2-octenyl-1-ylsuccinylated potato starch prepared by dry heating under different pH conditions[J]. LWT-Food Science and Technology, 2015, 61(1): 224-230. DOI:10.1016/j.lwt.2014.11.004.
[23] CHIU C W, SCHIERMEYER E, THOMAS D J, et al. Thermally inhibited starches and flours and process for their production: U.S.Patent 5725676[P]. (1998-3-10)[2015-3-10].
[24] DUTTA H, MAHANTA C L, SINGH V, et al. Physical,physicochemical and nutritional characteristics of Bhoja chaul, a traditional ready-to-eat dry heat parboiled rice product processed by an improvised soaking technique[J]. Food Chemistry, 2016, 191:152-162. DOI:10.1016/j.foodchem.2014.10.144.
[25] ZHU Jie, LI Lin, CHEN Ling, et al. Study on supramolecular structural changes of ultrasonic treated potato starch granules[J].Food Hydrocolloids, 2012, 29(1): 116-122. DOI:10.1016/j.foodhyd.2012.02.004.
[26] ZHANG Binjia, LI Xiaoxi, LIU Jia, et al. Supramolecular structure of A- and B-type granules of wheat starch[J]. Food Hydrocolloids, 2013,31(1): 68-73. DOI:10.1016/j.foodhyd.2012.10.006.
[27] ZHENG Bo, XIE Fengwei, SITU Wenwei, et al. Controlled bioactive compound delivery systems based on double polysaccharide filmcoated microparticles for liquid products and their release behaviors[J].Journal of Functional Foods, 2017, 37: 272-282. DOI:10.1016/j.jff.2017.07.048.
[28] SANTUCCI S C, COJOC D, AMENITSCH H, et al. Optical tweezers for synchrotron radiation probing of trapped biological and soft matter objects in aqueous environments[J]. Analytical Chemistry, 2011,83(12): 4863-4870. DOI:10.1021/ac200515x.
[29] GAYIN J, CHANDI J K, MANFUL J, et al. Classification of rice based on statistical analysis of pasting properties and apparent amylose content: the case of Oryza glaberrima accessions from Africa[J].Cereal Chemistry, 2015, 92(1): 22-28. DOI:10.1094/CCHEM-04-14-0087-R.
[30] PU Huayin, CHEN Ling, LI Lin, et al. Multi-scale structural and digestion resistibility changes of high-amylose corn starch after hydrothermal-pressure treatment at different gelatinizing temperatures[J]. Food Research International, 2013, 53(1): 456-463.DOI:10.1016/j.foodres.2013.05.021.
[31] TAN I, FLANAGAN B M, HALLEY P J, et al. A Method for estimating the nature and relative proportions of amorphous, single,and double-helical components in starch granules by13C CP/MAS NMR[J]. Biomacromolecules, 2007, 8(3): 885-891. DOI:10.1021/bm060988a.
[32] MIHHALEVSKI A, HEINMAA I, TRAKSMAA R, et al. Structural changes of starch during baking and staling of rye bread[J]. Journal of Agricultural and Food Chemistry, 2012, 60(34): 8492-8500.DOI:10.1021/jf3021877.
[33] CHEN Jin, LIANG Yi, LI Xiaoxi, et al. Supramolecular structure of jackfruit seed starch and its relationship with digestibility and physicochemical properties[J]. Carbohydrate Polymers, 2016, 150:269-277. DOI:10.1016/j.carpol.2016.05.030.
[34] TAN Xiaoyan, LI Xiaoxi, CHEN Ling, et al. Effect of heat-moisture treatment on multi-scale structures and physicochemical properties of breadfruit starch[J]. Carbohydrate Polymers, 2017, 161: 286-294.DOI:10.1016/j.carbpol.2017.01.029.
[35] XIANG Zhang. Science and principles of biodegradable and bioresorbable medical polymers[M]. London: Woodhead Publishing,2017: 279-294. DOI:10.1016/B978-0-08-100372-5.00009-X.
[36] MUCHA M. Some observations on the melting behavior of isotactic polypropylene crystals[J]. Journal of Polymer Science Polymer Symposia, 1981, 69(1): 79-89. DOI:10.1002/polc.5070690113.
[37] BERTOFT E. Lintnerization of two amylose-free starches of A- and B-crystalline types, respectively[J]. Starch-Stärke, 2004, 56(5): 167-180. DOI:10.1002/star.200300255.
[38] LIU Kun, ZHANG Binjia, CHEN Ling, et al. Hierarchical structure and physicochemical properties of highland barley starch following heat moisture treatment[J]. Food Chemistry, 2019, 271: 102-108.DOI:10.1016/j.foodchem.2018.07.193.