Approximating home ranges of humpback and fin whales in Drake Passage and Antarctica
2020-04-12JosLuisORGEIRAFacundoALVAREZ
José Luis ORGEIRA &Facundo ALVAREZ
1 Departamento Biología de los Predadores Tope,Instituto Antártico Argentino.Buenos Aires,Argentina;
2 Programa de pós-graduação em Ecologia e Conservação.Campus de Nova Xavantina.Universidade do Estado de Mato Grosso,Brasil
Abstract Identifying home ranges—those areas traversed by individuals in their normal foraging,mating,and parenting activities—is an important aspect of cetacean study.Understanding these ranges facilitates identification of resource use and conservation.Fin and humpback whales occur in Antarctica during the austral summer,but information regarding their home ranges is limited.Using opportunistically collected whale sighting data from eight consecutive summer seasons spanning 2010–2017,we approximate the home ranges of humpback and fin whales around Drake Passage (DRA),West of Antarctic Peninsula (WAP),South Shetland Islands (SSI),an area northwest of the Weddell Sea (WED),and around the South Orkney Islands (SOI).Approximate home ranges are identified using Kernel Density Estimation (KDE).Most fin whales occurred north and northwest of the SOI,which suggests that waters near these islands support concentrations of this species.Most humpback whales were observed around the SSI,but unlike fin whales,their distributions were highly variable in other areas.KDE suggests spatial segregation in areas where both species exist such as SOI,SSI,and WPA.Partial redundancy analysis (pRDA) suggests that the distributions of these species are more affected by spatial variables (latitude,longitude) than by local scale variables such as sea surface temperature and depth.This study presents a visual approximation of the home ranges of fin and humpback whales,and identifies variation in the effects of space and environmental variables on the distributions of these whales at different spatial scales.
Keywords humpback whale,fin whale,home range,Antarctica,Drake Passasge
1 Introduction
Present-day patterns in the distributions of species are the product of historical and evolutionary processes,interactions between biotic and abiotic elements,and the dispersal capacities of species (Wiens et al.,2004;Soberon,2007).While baleen whales may be conspicuous and emblematic Southern Ocean species,they remain poorly studied,particularly because researching cetaceans in Antarctic waters is logistically difficult.
Dedicated and opportunistic surveys of whales in this region have advanced our understanding of these animals (Murase et al.,2002;Friedlaender et al.,2006;Širović et al.,2006;Nowacek et al.,2011;Orgeira et al.,2015,2017).Surveys that are especially relevant are those under the auspices of the International Whaling Commission (IWC),International Decade of Cetacean Research (IDCR),and Southern Ocean Whale Ecosystem Research (SOWER) from 1978/79–1983/84,1985/86–1990/91 and 1991/92–2003/04 (Branch,2011).Notable among these results are the increased breeding populations of humpback whales reported in the Southern Hemisphere (Branch,2011).
One aspect of cetacean research in Antarctica involves determining areas that are most used in species’ life cycles.The distribution of an animal position in the two-dimensional latitude-longitude plane is known as estimation of the “distribution patterns”,which allow us to understand how a species interacts with its environment and anthropic activities (Worton,1989;Hauser et al.,2014).Estimating distribution patterns is critical in studies of species’ home ranges—those areas traversed by an individual in its normal food gathering,mating,and parenting activities (Burt,1943;Seaman and Powell,1996;Lagerquist et al.,2019).Knowing the home range of a species facilitates identification of those resources it uses,which facilitates decision-making processes regarding threatened population management and critical habitat identification (Seminoff et al.,2002;Hauser et al.,2007;Lagerquist et al.,2019).
Knowledge of whale distributions and abundances in the Southern Ocean is generally limited because dedicated cetacean surveys are expensive,in that they consume significant ship time and are personnel intensive (Burkhardt and Lanfredi,2012).Our data were obtained from opportunistic observations made aboard one oceanographic ship over eight consecutive summers in Drake Passage and Antarctica.Using data acquired from these opportunistic samplings we aim to approximate fin (Balaenoptera physalus;Linnaeus,1758) and humpback whale (Megaptera novaeangliae;Borowski,1781) home ranges and ascertain the effects of space and environment on their distributions.
2 Materials and methods
2.1 Study sites
Opportunistic observations were made from the R/VPuerto Deseadofrom 45°–66°S and 70°–33°W (Figure 1) including Drake Passage (DRA),West Antarctic Peninsula (WAP),Bransfield Sound,South Shetland Islands (SSI),an area northwest of the Weddell Sea (WED),and the South Orkney Islands (SOI),during austral summer periods from 2010–2017.The nature of sampling,and variable weather and environmental conditions during sampling,rendered the sampling effort different each year.
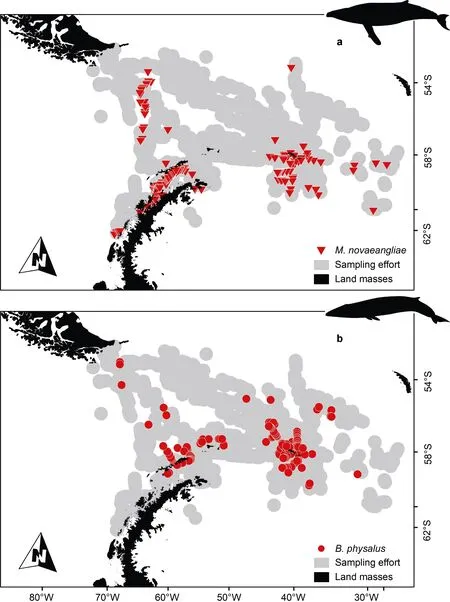
Figure 1 Survey sites (gray circles) and cetacean sightings presence from 2010 to 2017:a,humpback whale (red triangles);b,fin whale (red circles).
2.2 Survey sampling and effort
Observations were made from the ship’s bridge (15 m above sea level) by the two same observers working simultaneously in daylight running hours (~05:00–20:00 h).Species were observed by eye and identified using 16 × 50 binoculars,personal photograph catalogs,and field guides (Bastida and Rodríguez,2003;Shirihai,2009).When identification was not possible,an individual was registered as ‘unidentified’.A ‘passing mode’ method was used during sampling,which means that the ship continued traveling along an established linear transect even after a group of marine mammals was seen (Dawson et al.,2008).
2.3 Data analysis
Observations were limited to sea conditions of 0–4 Beaufort Scale (wind speeds to 28 km·h-1).We express the number of sighted cetaceans as the encounter rate (ER),a measure of density (ER= the number of cetaceans observed/nm surveyed;Secchi et al.,2001),and calculate this for each species.Because vessel speed varied from 6–9 knots we assumed an average speed of 8 knots (the most frequent speed) to calculateER.This measure (or variants of it) has been used widely for decades to estimate whale densities (Secchi et al.,2001;Branch,2011;Orgeira,2018).
Estimates of relative abundance or any related index (such as density orER) are valuable for monitoring trends and for comparing corresponding feeding or breeding grounds (Secchi et al.,2011).At each cetacean sighting,coordinates (latitude,longitude) were recorded from the ship’s GPS,sea surface temperature (SST,℃ at 3 m depth) was recorded by a Sea-Bird Electronics 21 thermosalinograph every 30 s,and water depth and distance to land (nm) were recorded from ship instruments.
Species home ranges were obtained by Kernel Density Estimation (KDE) using data records for eight summer seasons.KDE is a non-parametric statistical function that allows estimation of the probability density of a random variable from distance distribution curves (Seaman and Powell,1996;Rayment et al.,2009).It is a widely used tool to study two-dimensional patterns of species distribution (Seaman and Powell,1996;Simonoff,1998;Duong,2007).KDE has been applied in different investigations of marine mammals,and reliably used to define home ranges (e.g.Heide-Jørgensen et al.,2002;Hobbs et al.,2005;Rayment et al.,2009;Kie et al.,2010;Hauser et al.,2014).We applied KDE from the QGIS platform [(version 3.14;Quantum GIS (Geographic Information System);QGIS.org 2020)],using the ‘Heatmap’ interpolation extension.A critical point for the algorithm is the assignment of the width of the KDE (“bandwidth”,“smoothing parameter”,or “window width”),since this variable specifies the distance of influence from a central value (Seaman and Powell,1996;Duong,2007).This Kernel bandwidth was assigned based on the authors’ experience and results of Tucker et al.(2014),wherein the home ranges of different mammals were projected from body mass.Following Hauser et al.(2014),the KDE values were normalized from 0 to 1 (1 being the maximum density value).The matrices generated were classified into two density classes according to their maximum and minimum values.Spatial and temporal differences in sampling effort can generate biases which distort reality (Phillips et al.,2009).To test for possible spatial autocorrelation (SAC) of whale occurrences,we calculated the Moran index for each data set.Although data are not affected by SAC (Moran’s I greater than |0.2|) we applied the spThin function to reduce redundant information to provide a better data fit (Aiello-Lammens et al.,2015).
We use a partial redundancy analysis (pRDA;Borcard et al.,1992;Legendre and Legendre,2012) for each spatial predictor data set to evaluate environmental variables (SST,depth (m)) and spatial variables (latitude,longitude) for both whale species.This analysis decomposes the variation in species abundance from environmental and spatial matrices into four fractions,in which variation is determined by:(a) ‘pure’ environmental factors,(b) a spatially structured environment,(c) ‘pure’ spatial variables,and (d) unexplained variation (Borcard et al.,1992;Peres-Neto et al.,2006).pRDA allows elimination of the effects of one or more explanatory variables within a set of response variables.In this way its effects can be partitioned out to generate a single canonical axis and eigenvalue that expresses the variation for which the variable of interest is responsible (Legendre and Legendre,2012).Variations explained by each fraction are reported in terms ofR² (Peres-Neto et al.,2006) and the effects of the environment and space are independently tested by permutation.All analyses were run in the R program (R Development Core Team,2019),with the ‘adespatial’ package (Dray et al.,2018) used for variable selection,and the ‘vegan’ package (Oksanen,2009) for all other analyses.
3 Results
A total distance of 5582 nm or 6204 km2,was covered between 45°S and 66°S (Figure 1) during summer between 2010 and 2017.In this time 764 fin whales (54.3%),644 humpback whales (45.7%) were recorded.In addition,five other cetaceans (Southern right whale,Eubalaena australis;sperm whale,Physeter macrocephalus;Antarctic minke whale,Balaenoptera bonaerensis;sei whale,Balaenoptera borealis;and hourglass dolphin,Lagenorhynchus cruciger) were also sighted.The humpback whale was the most frequently sighted species (>57% of all sightings,202 sightings).Higher encounter rates were obtained in WAP (1.01 ± 0.37 ind·nm-1(SE) for humpback whales) followed by SOI (0.89) ± 0.38 ind·nm-1(SE) for fin whales (Table 1).
The distributions of both species differed each year (Figures 2 and 3).When all the cruises made are combined,the kernel density for both species is obtained (Figure 4).For fin whales,the most ‘used area’ occurred next to theSOI (particularly to the north and northwest of SOI,where 79% of all individuals were recorded).Fin whale occurrence was low in WAP,DRA and SSI,and none was observed south of 62°S (Table 1,Figure 4a).The most used area for humpback whales was the SSI (43.2% of all individuals),but unlike fin whales,high occurrences also occurred in all other studied zones (Figure 4b).The distribution obtained from KDE suggests different patterns of habitat segregation with the home ranges of each whale species.In SSI fin whales concentrated to the north of the islands while humpback whales occurred to the south.In WAP there was a concentration of humpbacks (17.2%),but fin whales were absent.Five fin whales were sighted northwest of the Weddell Sea,two in 2015 and three in 2016.

Table 1 Mean encounter rates (ER,ind·nm-1),number of individuals seen (n),and Kernel density in Drake Passage (DRA),South Shetland Is.(SSI),West of Antarctic Peninsula (WAP),and South Orkney Is.(SOI),during summer from 2010 to 2017
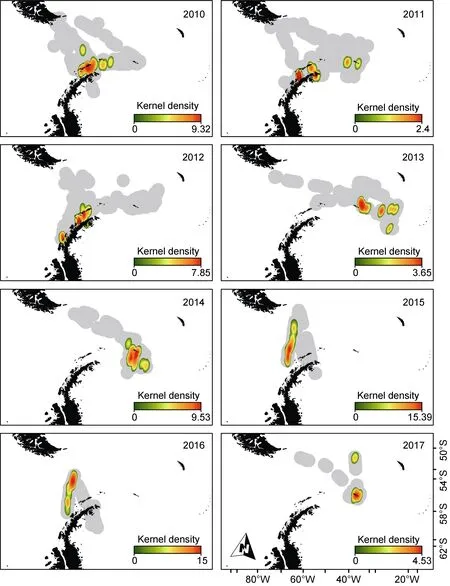
Figure 2 Survey sites per year (grey areas) and spatial distribution of humpback whale Kernel densities.
Although spatial data do not show a strong SAC effect,the spThin function enables us to better adjust the data and further reduce possible effects of differences in sampling effort (Figure 5).pRDA detected a greater effect of space on the distributions of both species (Figure 6).The complete model for the humpback whale explained 46% of the total variation in the data,and 27% of that for the fin whale.Environmental variables did not individually,significantly affect the distributions of either species.Spatial variables had an effect of 39% for humpback whale (R2= 0.242;p<0.001) and 24% for fin whale (R2= 0.389;p<0.001).
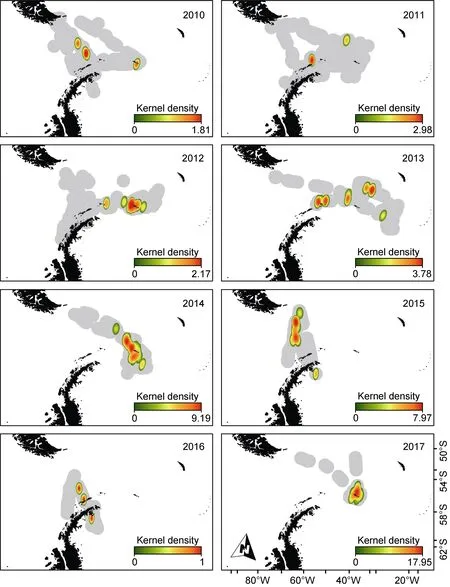
Figure 3 Survey sites per year (grey areas) and spatial distribution of fin whale Kernel densities.
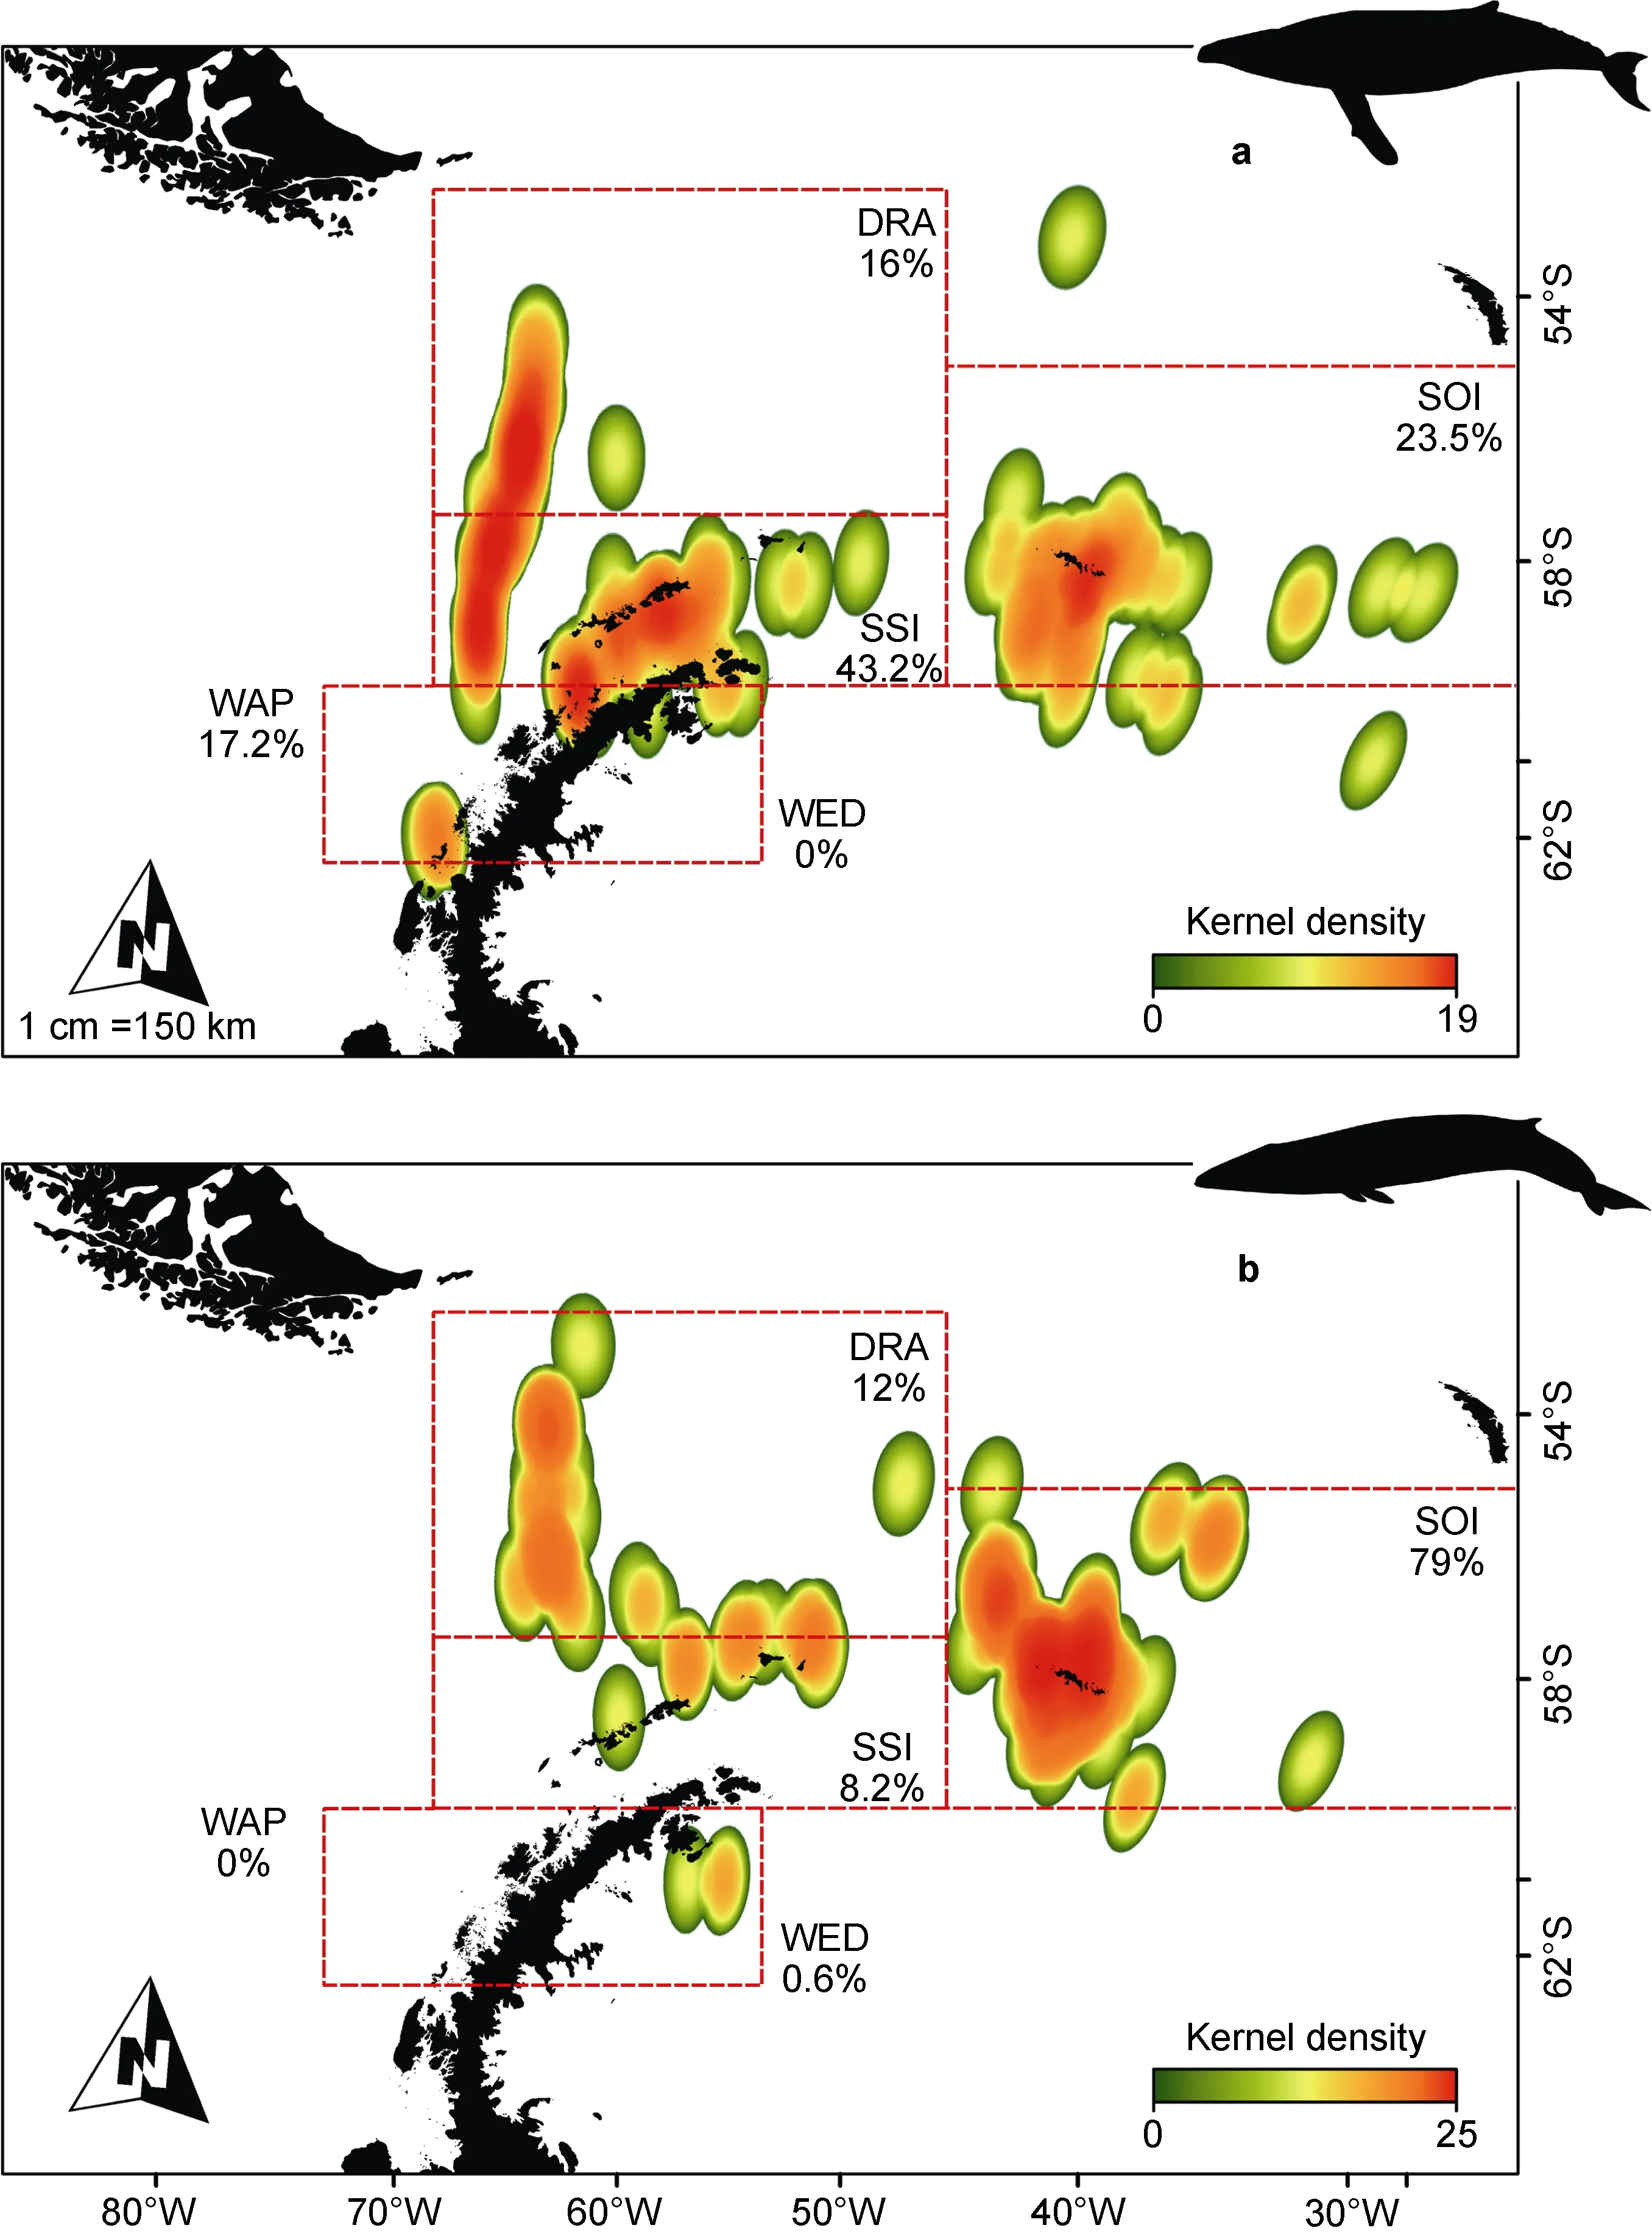
Figure 4 Kernel density for all years (a,humpback whale;b,fin whale) and proportion of individuals registered by area.Dotted lines delimit approximate boundaries of study sites (DRA:Drake Passage;SSI:South Shetland Is.;WAP:West of Antarctic Peninsula;SOI:South Orkney Islands).
4 Discussion
The social organization of cetaceans is strongly affected by different use of space (Hauser et al.,2007).For example,differences in humpback and fin whale habitat preferences around the SOI (Orgeira et al.,2017) which might have corresponded to different habitat requirements might also define different home ranges.During the austral summer the distribution of fin and humpback whales in Antarctica varies,but humpback whales are more common west of the Antarctic Peninsula (Dalla Rosa et al.,2008),around South Georgia,and several subantarctic island groups such as South Orkney,South Shetland,South Sandwich,and Bouvet islands (Engel and Martin,2009).Although humpback whales share most of these areas with fin whales,differences in their niches influence their horizontal segregation (Herr et al.,2016).Fin whales prefer more pelagic habitats (Širović et al.,2006),have a broader trophic niche (Shirihai,2009) and dive deeper than humpback whales (Bastida and Rodríguez,2003).Therefore,fin whales tend to exploit different resources,avoiding competition with humpback whales (Širović et al.,2006).Our study,based on data collected over eight consecutive summers,supports these earlier findings.KDE reveals specific spatial distribution patterns for each species,with these patterns suggesting that “central areas” exist—centers of activity where species spend more time (Seaman and Powell,1996;Rayment et al.,2009).KDE results suggest that these central areas are used unevenly by both species,and that they are also strongly associated with highly productive coastal zones,which are also subject to intense anthropic activities (Rayment et al.,2009;Hauser et al.,2014).
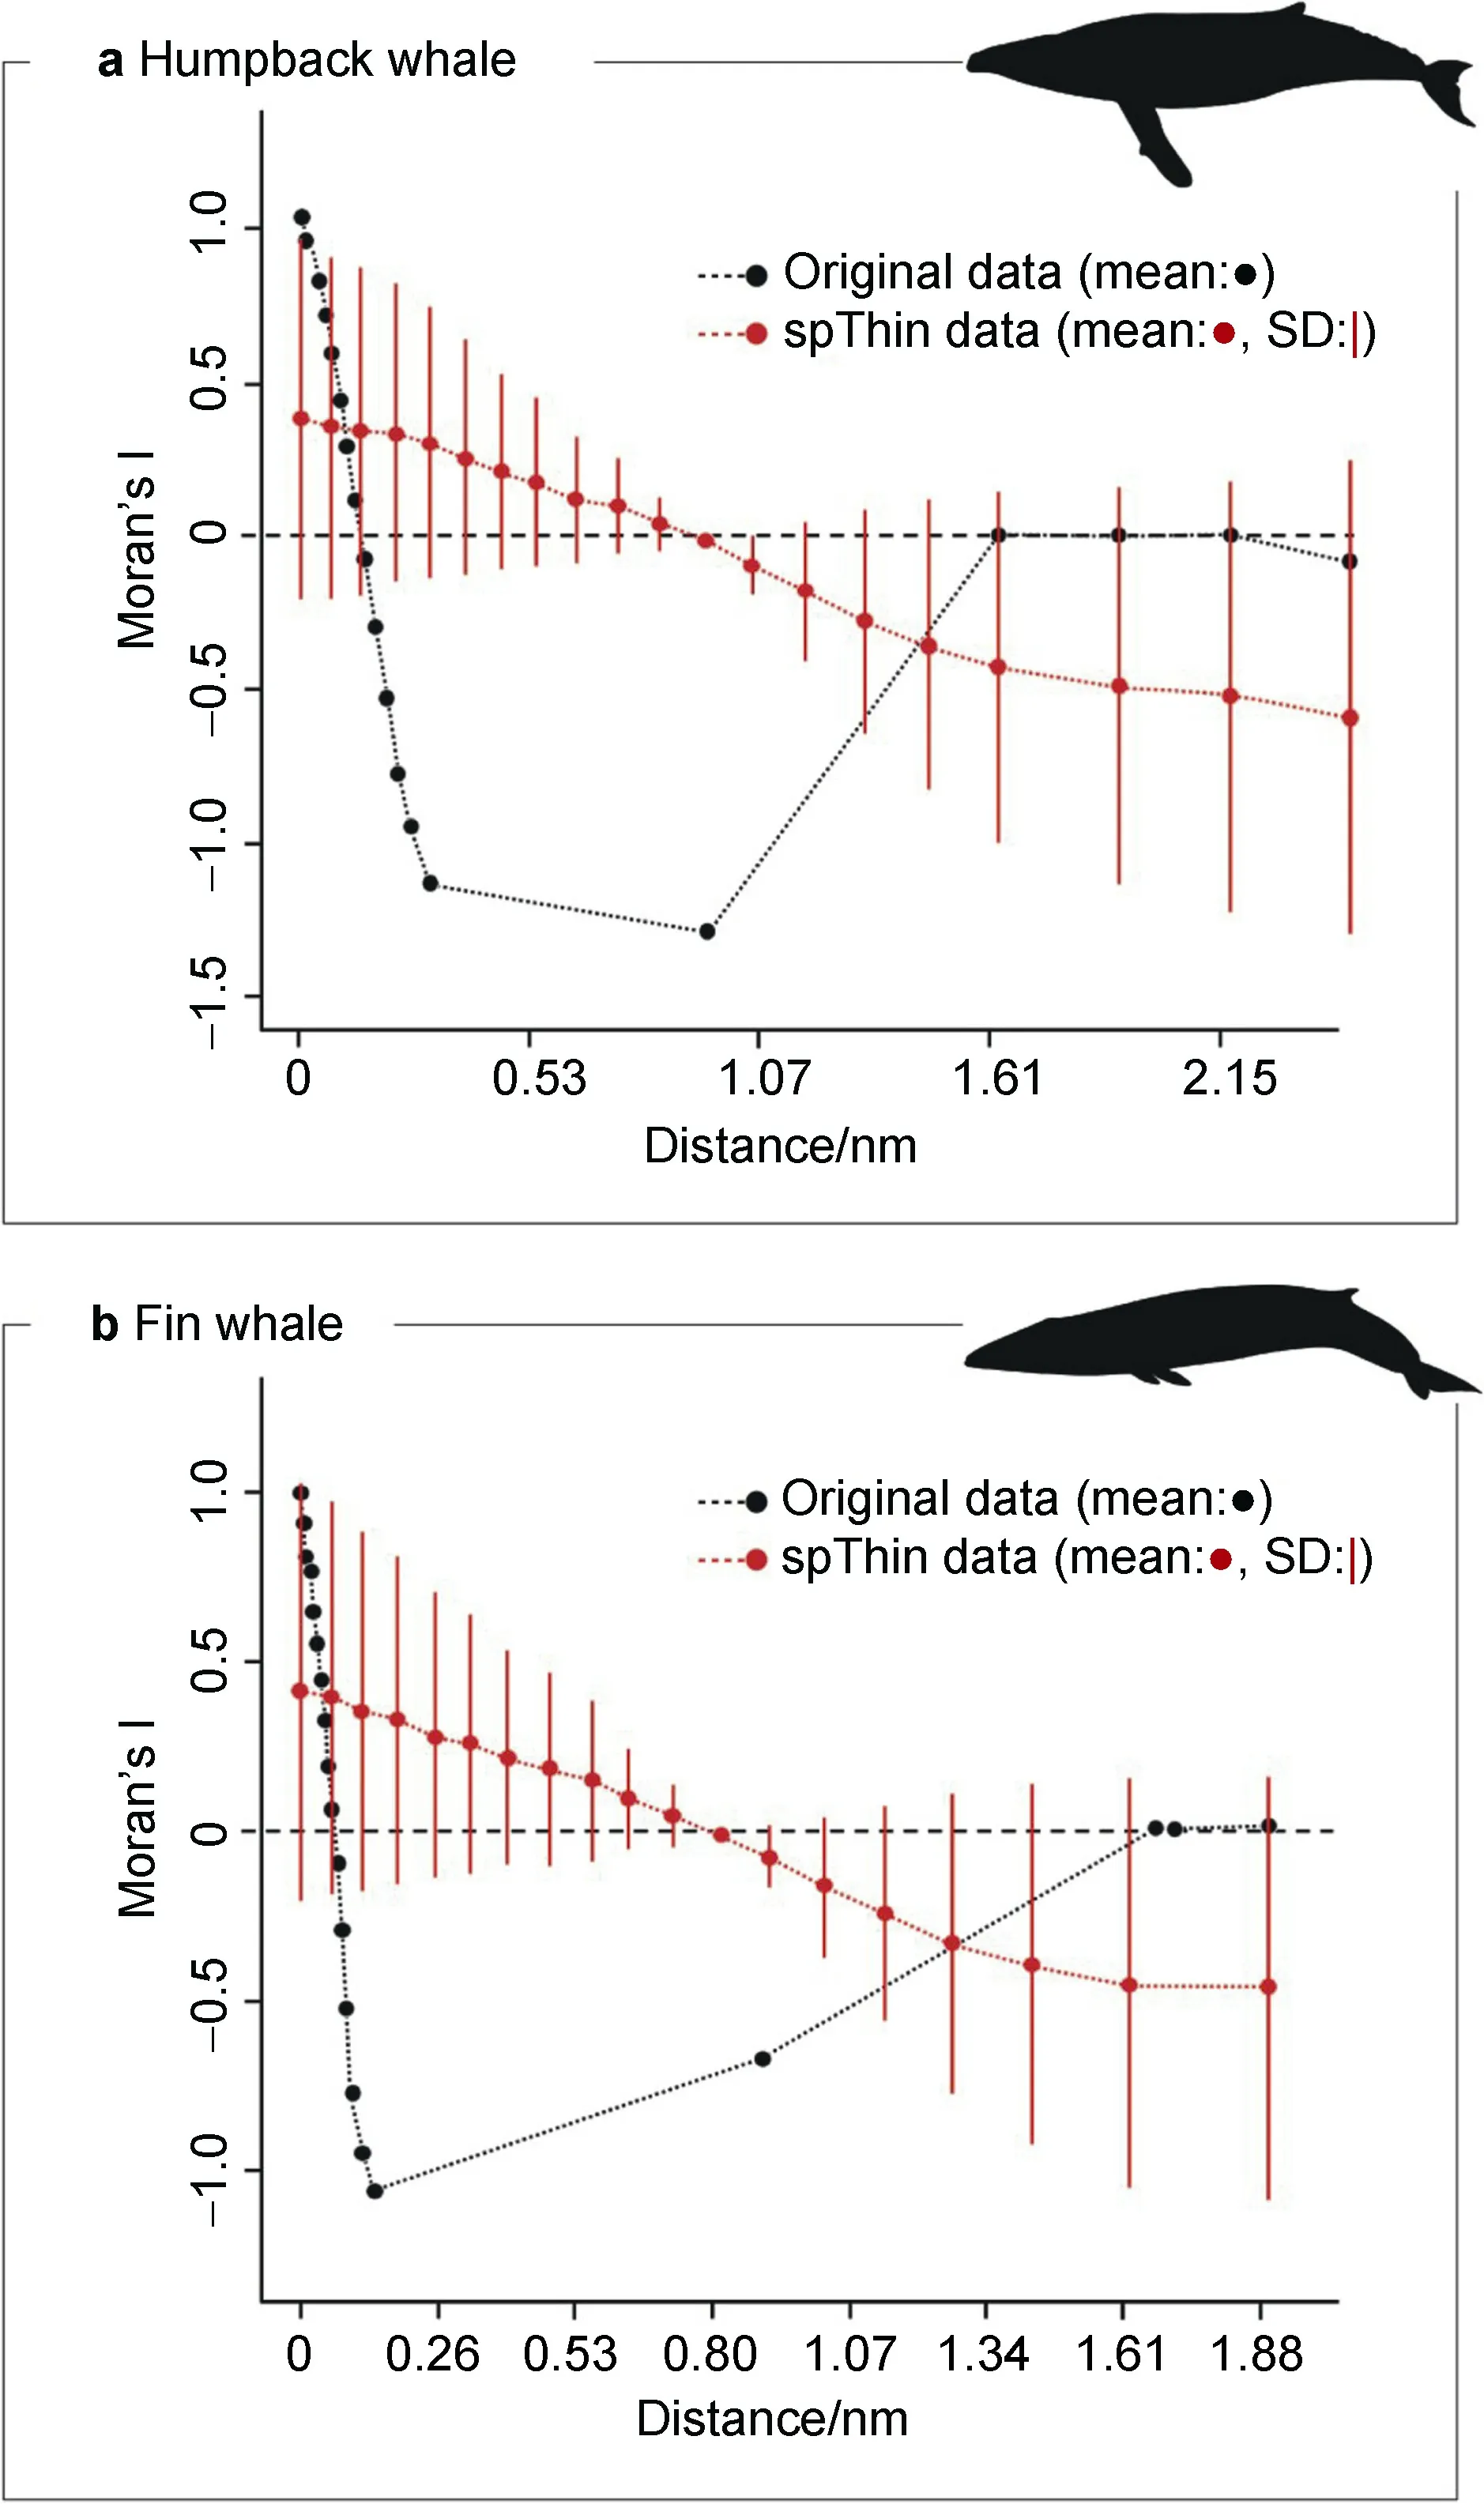
Figure 5 Distribution of Moran Index values for original data (black points) and data obtained after applying the spThin function (red points) for humpback and fin whales.
Seven breeding populations of humpback whales are reported from the Southern Hemisphere,including Stock G and Stock A from near the Antarctic Peninsula (Bravington et al.,2007).Our KDE results reveal the highest concentrations of humpback whales occur in WAP,which also explains why the humpback whaleERwas higher in WAP,although the highest abundance occurred in SSI (Table 1).Although annual variation in the distributions of these whales was evident,and individuals were not individually tracked or identified,it is possible that they belong to Stock G and that this represents a central area for them.Where whales from Stock A feed is uncertain,but it is thought to be somewhere around the Antarctic Peninsula and South Georgia Islands (Secchi et al.,2011).
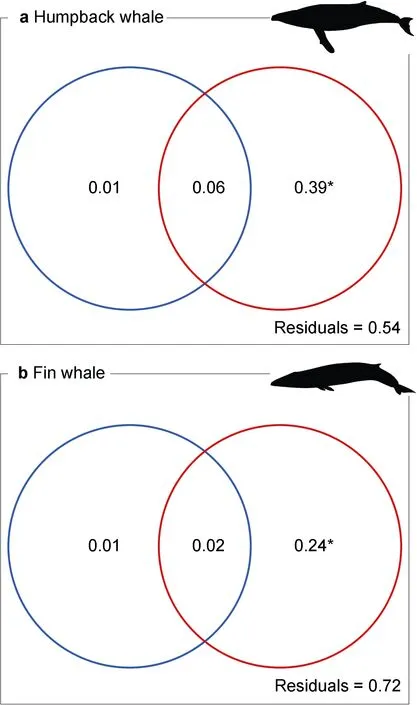
Figure 6 pRDA analysis to assess the effects of space and environment on the distributions of humpback (a) and fin (b) whales.The model suggests that spatial components such as latitude and longitude have a strong influence on the distribution of both species.Red circles represent spatial variables (latitude,longitude),blue circles represent environmental variables (SST,depth),and the overlap indicates an interaction between them.Numbers indicate the importance of values (out of a total of 1) provided by each set of variables,and the residuals indicate how much of the total cannot be explained by the model;* significative at p<0.001.
We show that humpback whales (66.7% of all recorded individuals) use the SSI and SOI areas intensively.Because no tissue samples were collected,we cannot determine what genetic stock these individuals belong to,but their distributions suggest that the SSI and SOI are both central areas for their populations.The SSI is also an area in which fin whales concentrate and feed (Širović et al.,2006),particularly off Elephant Island (Pankow and Kock,2000),even during the austral autumn (Burkhardt and Lanfredi,2012).OurERand KDE results indicate that only 8.2% of all fin whales occurred in SSI,including Elephant Island,but 79% of them occurred around the SOI.This suggests that the SOI could be the largest central habitat for this species in western Antarctic waters north of 66°S.Because no krill surveys occurred at the time of our sightings,we cannot determine if these central habitats represent likely feeding,migration or socialization areas.However,the SOI is an area in which most krill fishing effort occurs (Brooks,2013).Five individuals sighted northwest of the Weddell Sea could suggest that the WED was part of the species’ home range.However,their presence may also be due to ice,sea currents,foraging,or the “idiosyncrasy” of this species,as described by de Marco and Nóbrega (2018).
In the entire studied area,the pRDA analysis revealed that spatial variables (latitude and longitude) are more important than environmental variables such as SST and ocean depth.However,environmental variables such as SST and salinity have been previously identified as deterministic in the distributions of fin and humpback whales around the SOI (Orgeira et al.,2017).This suggests that environmental variables may only explain part of the distribution patterns and occurrences of species at local scales,but at larger scales,spatial variables have a greater influence on distribution patterns.
The distributions of species are determined mainly by their dispersal capacities and body size (Heino et al.,2015),distribution of environmental conditions favoring the establishment,survival and reproduction of individuals,and the biotic environment comprising competitors,predators and pathogens,together with prey availability and their dynamics (Soberón,2007).When spatial variables are included in the pRDA analysis,most of all these factors are implicit;as Heino et al.(2015) identified,the inclusion of spatial variables as latitude and longitude allows expansion of knowledge regarding the distributions of species.Species modelling techniques,such as those used in this study,provide important tools for approximating the fundamental niches of species based on different predictor variables (Elith et al.,2006).This set of factors might also act differentially for each species,explaining the differences in pRDA values of variables for fin and humpback whales (Figure 5).
Our data were collected opportunistically,no specific route for surveying cetaceans was established,genetic samples were not taken,and sampling effort was affected by various logistical problems.Despite this we recognize similarities and differences in our data and interpretations with those of previous studies.For example,although we report horizontal niche partitioning between fin and humpback whales (as suggested by Herr et al.in 2016),the niches of these two species obviously overlapped in some SOI areas.OurERand KDE results suggest that the South Orkney Islands area represents a summer migration feeding area for humpback whales,as reported by Engel and Martin (2009).
5 Conclusions
Kernel density estimates indicate spatial segregation of fin and humpback whales,between and within areas.In the South Orkney Islands region,possible niche overlaps exist for both species.In addition to the South Shetland Island and West Antarctic Peninsula regions,humpback whales are frequently associated with the South Orkney Islands,which indicates that this area might represent an important habitat for this species.Based on pRDA results,spatial variables have a greater effect on the distributions of fin and humpback whales at larger spatial scales than temperature and depth do at more local scales.
Acknowledgements We are grateful to Armada Argentina and to the crew of the R/VPuerto Deseadofor support provided during surveys.We also thank two anonymous reviewers for their assistance in improving the manuscript.We thank the contributions of Yulie Shimano Feitosa for reading and revising this manuscript,and Steve O’Shea,PhD,from Edanz Group,for editing a draft of this manuscript.This work was conducted with logistical and financial support of the Instituto Antártico Argentino.
杂志排行
Advances in Polar Science的其它文章
- Nitrous oxide research progress in polar and sub-polar oceans
- Installing a prototype wind turbine to produce energy in Antarctica to allow a permanent Colombian scientific base to be established
- Air pollutants and greenhouse gases emission inventory for power plants in the Antarctic
- Are Antarctic Specially Protected Areas safe from plastic pollution? a survey of plastic litter at Byers Peninsula,Livingston Island,Antarctica
- Large spread across AeroCom Phase II models in simulating black carbon in melting snow over Arctic sea ice
