Nitrous oxide research progress in polar and sub-polar oceans
2020-04-12ZHANLiyangZHANGJiexiaLIYuhongWUMan
ZHAN Liyang*,ZHANG Jiexia,LI Yuhong &WU Man
Key Laboratory of Global Change and Marine-Atmospheric Chemistry,Third Institute of Oceanography,Ministry of Natural Resources,Xiamen 361005,China
Abstract N2O gas depletes ozone and has a powerful greenhouse effect.Oceans are among the most important N2O sources and have been the subject of extensive studies.Polar oceans are important regions for deep water formation and global-scale thermohaline circulation.Therefore,these water bodies play an important role in the N2O budget,however,these regions were not well studied.This review of previously published studies and data on polar oceans,including both the Arctic Ocean and Southern Ocean,describes the distribution pattern of N2O and possible regulating mechanism of these distribution patterns and shows that the Arctic Ocean and Southern Ocean both represent source and sink regions,suggesting that the source/sink characteristics of the Arctic and Southern oceans and their strengths need further study.Questions related to N2O circulation in polar oceans were proposed,and future work is suggested.
Keywords nitrous oxide,source/sink,Arctic Ocean,Southern Ocean,Prydz Bay
1 Introduction
N2O is a trace gas that contributes ~298 times more to the greenhouse effect than CO2on a per-molecule basis (https://www.epa.gov/ghgreporting/ghg-reporting-programdata-sets);moreover,it has become the dominant contributor to ozone depletion since chlorofluorocarbon (CFC) emissions were eliminated by the Montreal Protocol (Ravishankara et al.,2009).Therefore,it is of wide concern,and the Intergovernmental Panel on Climate Change (IPCC) continues to update information on its contribution to global warming,the global budget,etc.(IPCC,2001,2007).
Oceans are considered one of the most important sources of N2O (Nevison et al.,1995;Seitzinger and Kroeze,1998;Suntharalingam and Sarmiento,2000;Freing et al.,2012) and contribute approximately 4 Tg N·a-1.Previous studies showed that the Atlantic Ocean is a N2O source (Walter et al.,2006),although its contributions likely have been underestimated.The East Tropical Pacific Ocean and the Arabian Sea have been reported as N2O production hotspots,where the surface water has high N2O concentrations and the subsurface layer shows the lowest N2O concentrations (Cohen,1978;Naqvi and Noronha,1991).More recent following studies elucidated that the significant N2O supersaturation of 12244% at the ETSP (Arevalo-Martínez et al.,2015) and fast N2O turnover rate of about 20 times at that of outgassing rate of the ETNP (Babbin et al.,2015).In addition to these regions,the Southern Ocean is also predicted to be a significant source of atmospheric N2O due to possible upwelling in the high-latitude Southern Ocean in N2O-rich Circumpolar Deep Water (CDW) (Bouwman et al.,1995).However,relatively limited surface water N2O data are available for the Southern Ocean (Rees et al.,1997;Zhan et al.,2015a,2015b,2018),and the information is insufficient to elucidate the source/sink characteristics and constrain the budget of the Southern Ocean.Although a few studies on the N2O characteristics of the Arctic Ocean have been carried out (Zhan et al.,2015a,2015b,2016;Zhang et al.,2015),this water body has long been ignored in terms of N2O source/sink characteristics since it is usually covered with sea ice;however,with the retreat of sea ice,its role in the global oceanic budget should be considered.Moreover,significant denitrification may occur along the Arctic continental shelf,which may also be a significant source of atmospheric N2O.Therefore,the role the Arctic Ocean in the N2O budget must be considered.Although the N2O characteristics in polar and sub-polar oceans have been less frequently studied,these regions are important locations for thermohaline circulations,where upwelling water approaches the surface and deep water forms;moreover,some of these regions are also considered important N2O sources.To provide a better understanding of the N2O research progress in polar and sub-polar oceans,this study reviewed the literature focused on these regions and proposed directions for further investigations.
2 Data
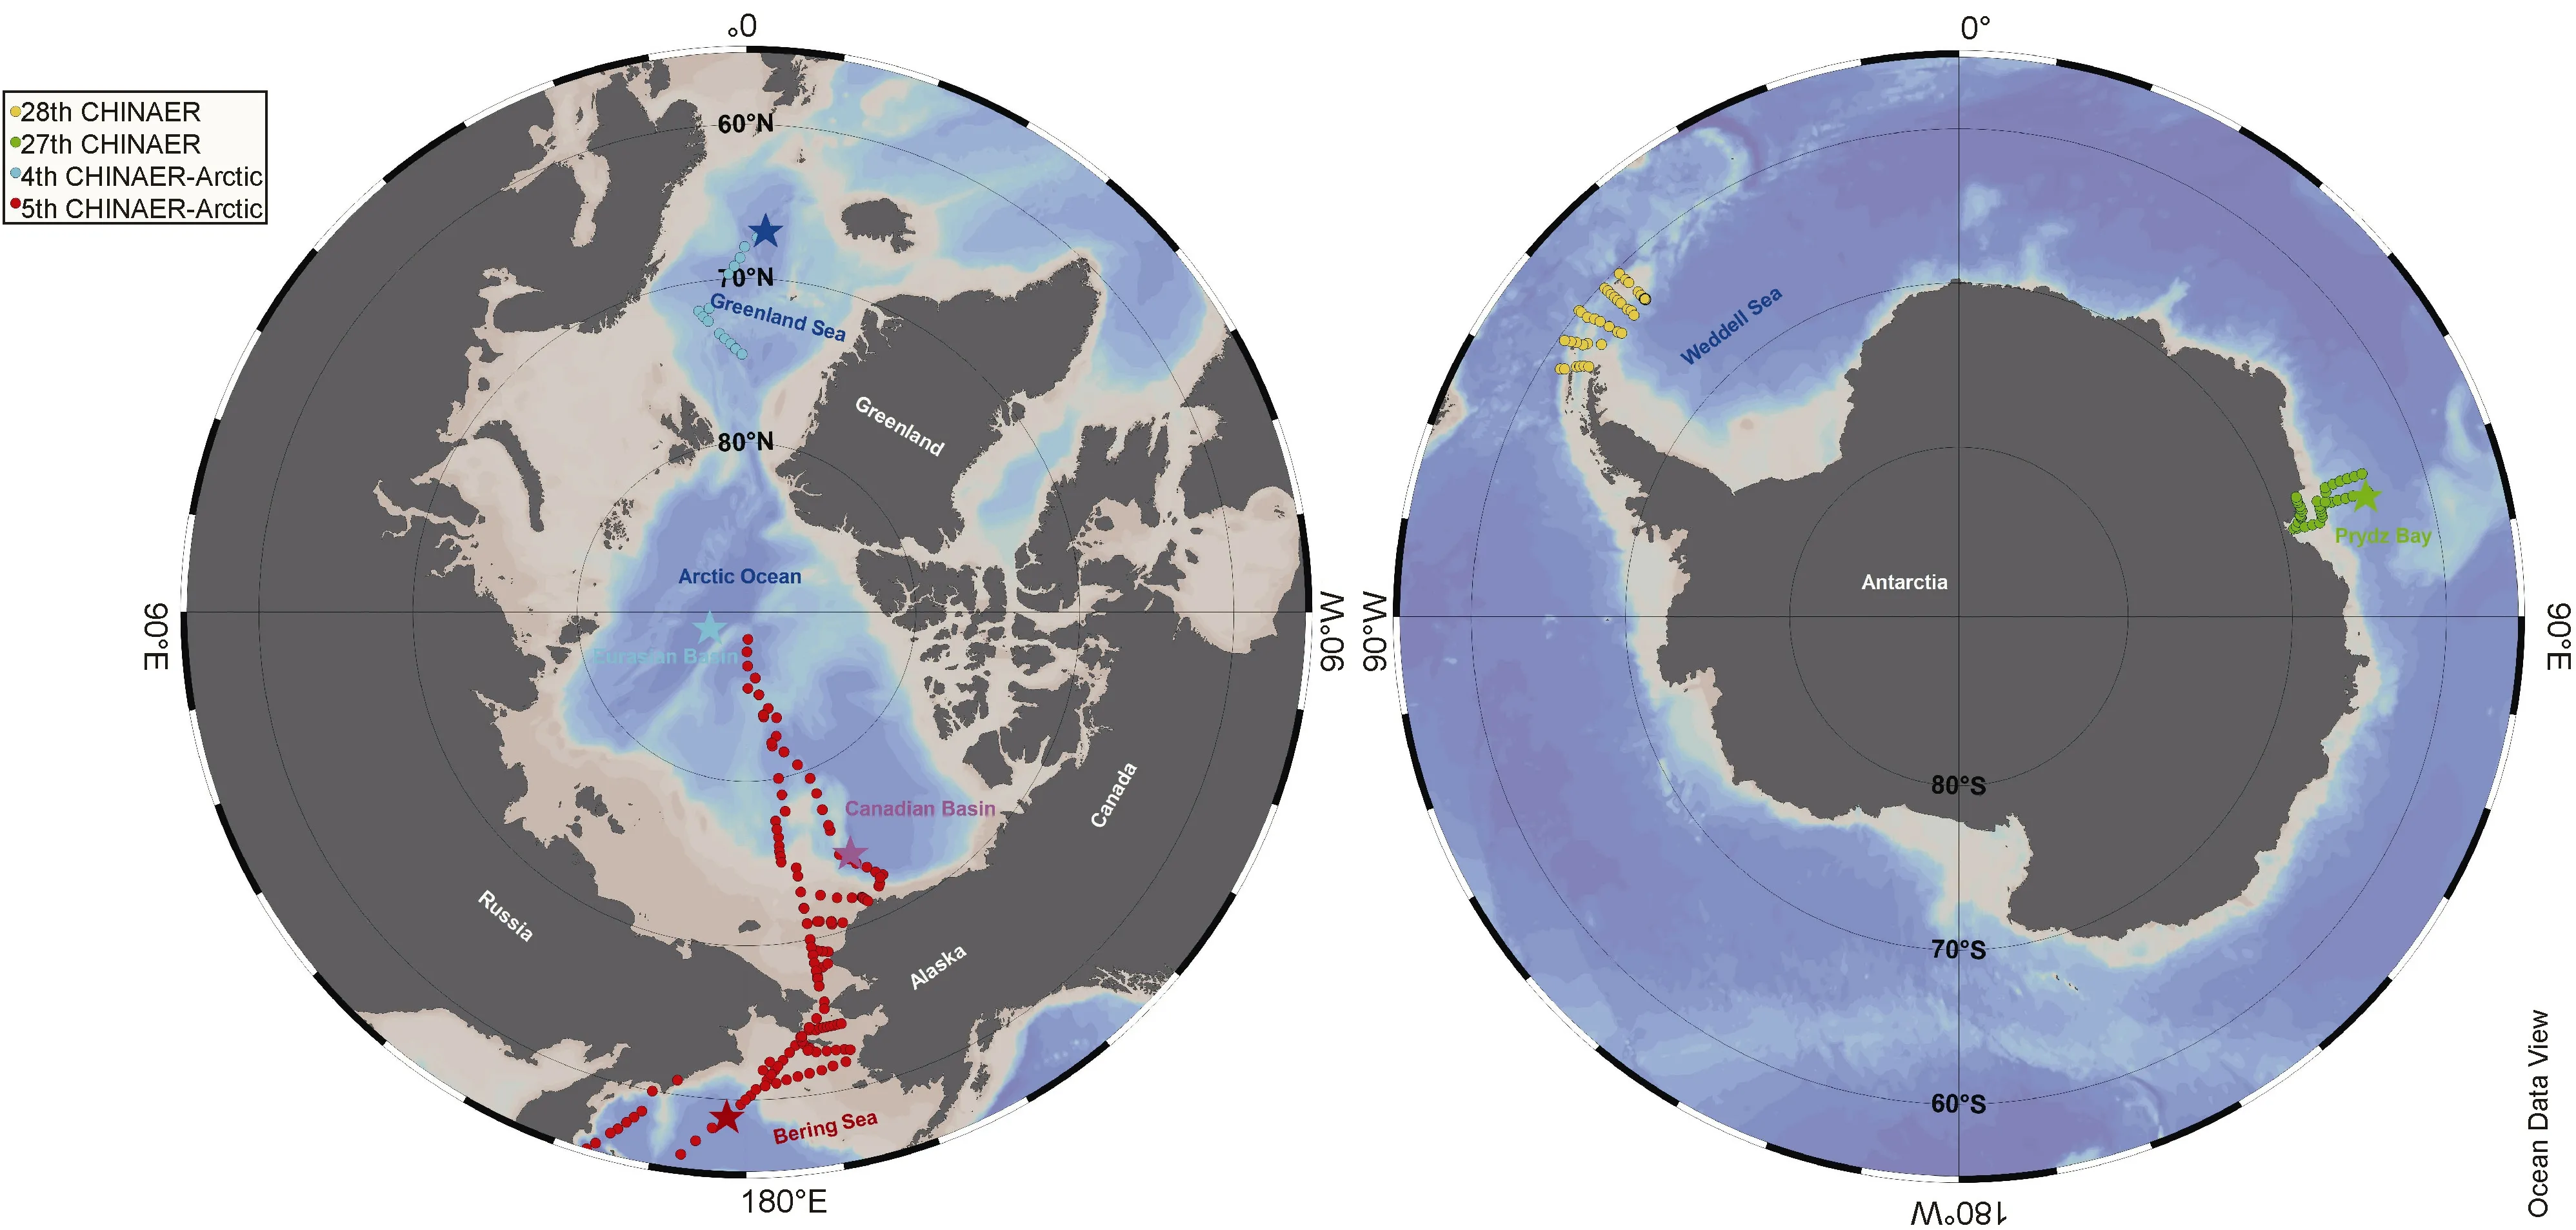
The data shown in this work were obtained during the Chinese National Arctic and Antarctic expeditions.Data for the Arctic and sub-Arctic oceans were obtained during the 4th and 5th Chinese National Arctic Research expeditions (CHINAREs-Arctic),which were carried out during 2010 and 2012,respectively,and data for Southern Ocean were obtained during the 27th and 28th Chinese National Antarctic Research expeditions (CHINAREs),which were carried out between 2010 and 2012.The sampling stations are shown in Figure 1.The study area of the Arctic and sub-Arctic oceans includes the Bering Sea,Chukchi Sea,Beaufort Sea and Nordic Sea,and the study area of the Southern Ocean includes the Prydz Bay and the Antarctic Peninsula.

Figure 1 The air-sea fluxes of N2O in polar and sub-polar oceans.
3 N2O Distribution in polar and subpolar oceans
3.1 N2O in the Arctic and sub-Arctic oceans
3.1.1 Arctic continental shelf
In the Arctic Ocean,studies have been conducted on N2O over continental shelves.Several studies about the N2O distribution,production mechanism and source/sink characteristics have been carried out along the Bering/ Chukchi Sea continental shelf.Hirota et al.(2009) investigated the Bering Sea and Chukchi Sea and used nutrient stoichiometry and isotope data to reveal the mechanism of N2O production.Their results showed that continental shelf sediment may be a source of the N2O supersaturation observed in the Bering/Chukchi sea continental shelf water and denitrification in the sediment may be the main production mechanism of N2O.Further studies have reported the role of the Bering/Chukchi sea continental shelf as a N2O sources (Zhang et al.,2015;Fenwick et al.,2017;Wu et al.,2017) and identified similar saturation states in these regions,suggesting that the supersaturation of N2O in the Bering Sea and Chukchi Sea is a persistent source of atmospheric N2O during summer.The melting ice edge near the continental shelf is oversaturated with N2O (Kitidis et al.,2010).Two studies have focused on the Northwest Passage of the Arctic Ocean (Kitidis et al.,2010;Fenwick et al.,2017),and in the same passage of the Canadian Arctic Archipelago,degrees of N2O saturation of 179% and 110% were observed;moreover,denitrification along the western Arctic shelf was believed to be the source of N2O in the water column (Fenwick et al.,2017).
Thus,the Arctic continental shelf may contain important locations for N2O production (Hirota et al.,2009).Since the continental shelf of the Arctic area accounts for 20% of the continental shelf area worldwide,it is an active site of denitrification (Chang and Devol,2009).Therefore,the Arctic continental shelf may be an important N2O source,and further investigation is required.
3.1.2 Arctic and sub-Arctic oceans
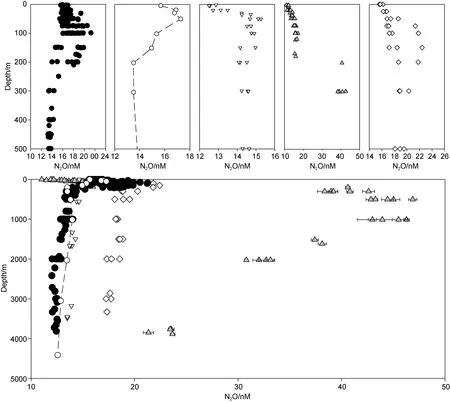
The distribution pattern of N2O in the Arctic Ocean is shown in Figure 2.The black dots are data observed in the Canadian Basin (CB),and the white dots are data obtained in the Eurasian Basin (EB).The data were obtained during the 4th and 5th CHINAREs-Arctic.

Figure 2 Vertical distribution of the N2O concentration in the Canadian Basin (black dots),Eurasian Basin (white circles),Greenland Sea (white triangles),Southern Ocean (north of the Prydz Bay,diamonds) and Bering Sea (gray triangles).
As shown in Figure 2,the N2O concentrations in the upper 300 m of the two basins are similar.The maximum concentration of ~18 nmol·L-1was observed between 50 m and 100 m,and it declines with depth to ~13.5 nmol·L-1at 300 m.The surface water is well-oxygenated,and nitrification is prohibited by light (Ward,2008);therefore,the production of N2O in the surface layer was dominated by the air-sea-ice interaction.The surface water N2O concentrations are in near-equilibrium with that in the atmosphere.Surface water N2O undersaturation was observed in the Arctic Ocean,and it had a minimum saturation of approximately 80% (Kitidis et al.,2010;Zhang et al.,2015).The undersaturation in the Arctic Ocean may be a result of melting ice.The first sea ice N2O measurement shows that sea ice contains only a low concentration (~6 nmol·kg-1) of N2O (Randall et al.,2012),which will dilute the N2O in the surface water during the ice melting process.In general,2–3 weeks is required for the surface water to reach equilibrium again (Butler et al.,1989),which results in surface water undersaturation.The subsurface layer N2O maximum is generally associated with nitrification that occurs during particulate matter remineralization.The productivity in the surface water of the central Arctic Ocean is limited (Anderson et al.,2003);therefore,sinking particulate matter should be limited and the local production of and contribution to the N2O maximum should also be limited.Rather,the N2O maximum should be the result of advection.Zhang et al.(2015) suggests that the N2O maximum observed at 100 m in the CB is Pacific-origin water (Zhang et al.,2015),and it can still be observed in the EB,where it rises to approximately 50 m.The water temperature increases at 300 m,below which Atlantic-origin water is located.
The N2O concentrations in the CB and EB are similar at between 300 m and 1000 m,and the average value is approximately 13.5 nmol·L-1.The similarity in N2O concentrations in these two basins at this depth range is because this layer of water originates from the Atlantic,and it descended to this depth and experienced a limited accumulation of N2O during its transportation (Zhan et al.,2015a).
The difference in N2O concentrations between the two basins increases with depth below 1000 m,with the largest difference observed between 2000 m and 3000 m.Then,the difference between the two basins decreases again below 3000 m.This phenomenon may be explained by the presence of the Lomonosov Ridge.The CB and EB are separated by the Lomonosov Ridge,which has a depth of ~1500 m and acts as a barrier to prevent deep Atlantic water from flowing into the CB below 1500 m.Therefore,the CB deep water below 1500 m may retain a preindustrial record (Zhan et al.,2015a;Fenwick et al.,2017).Below 3000 m,the N2O concentrations in the EB and CB are similar,suggesting that the deep bottom water in the EB may be of a similar age as that in the CB.
3.2 N2O and its source/sink characteristics in the Southern Ocean
Several studies have focused on the N2O in the Southern Ocean.The N2O concentration in the surface water is close to equilibrium,while that in the surface water was undersaturated.Rees et al.(1997) first observed N2O undersaturation of approximately 90% in the Bellingshausen Sea;Boontanon et al.(2010) reported N2O undersaturation of approximately 94% south of 60°S along 140°E;and a similar phenomenon was also observed near Prydz Bay (Zhan and Chen,2009;Zhan et al.,2015b,2017).Grefe et al.(2017) also reported 96.5% saturation near the ice edge at the polar front near the Weddell Sea.N2O undersaturation may also be caused by water dilution from sea ice and glacier melt.This melt water input and solar irradiance warm the stratified Antarctic surface water,which is further transported northward and results in a large area of near-equilibrium surface water.Farías et al.(2014) also observed N2O undersaturation and suggested that N2O may be consumed by nitrogen-fixing organisms.All these previous results show that the weak undersaturation of N2O may be common in the high latitude Southern Ocean.
In the subsurface layer,a N2O maximum can be observed in the Southern Ocean as well as Prydz Bay (white diamonds).The maximum N2O concentration in Prydz Bay is approximately 22.4 nmol·L-1as shown in Figure 2 (Zhan et al.,2015b).A similar maximum N2O concentration can be observed near the Antarctic Peninsula (Zhan et al.,2018),and it corresponds to the core of the upper CDW,which rises to approximately 200 m (Zhan et al.,2015b).The CDW is an “old” water mass transported from the North Atlantic Ocean,and it has a relatively high concentration of N2O resulting from long-term accumulation via the deep-water nitrification process.However,significant supersaturation resulting from CDW upwelling is not observed at the surface water of Prydz Bay,whereas the north flank of the Antarctic Peninsula shows a higher N2O oversaturation since the upwelling of CDW at this site further approaches the surface layer because of the topography.These limited findings suggest that the upwelling of CDW during summer may not cause stratification and likely releases large amounts of N2O into the atmosphere.
The N2O concentration in the deeper part of the Southern Ocean ranges from 17.0–18.0 nmol·L-1.Zhan et al.(2015b) suggested that the N2O concentration may result from the mixing process between CDW and Antarctic shelf water,which not only explains how this concentration can be observed at this depth but also suggests that the mixing process in the high-latitude Southern Ocean may provide a path for downward transportation of N2O and a mechanism for removing N2O from the atmosphere.
3.3 Implications of the N2O distribution in polar and sub-polar oceans
N2O is a relative inert chemical compound that accumulates along the path of thermohaline circulation;therefore,it shows unique variations across the oceans.The Greenland Sea (GS) and the Bering Sea (BS) are both Arctic-adjacent seas and sub-Arctic seas.As shown in Figure 2,the N2O concentrations in the GS (white triangles) are more vertically homogeneously distributed than those in the BS (gray triangles).The Aleutian Basin of the BS,indeed,is virtually part of the North Pacific Ocean,which is the oldest water in the global ocean.The N2O concentration is identical to that of the North Pacific Ocean (Butler et al.,1989;Zhan et al.,2013).The highest N2O concentration in the BS is at ~900 m,which corresponds to the oxygen minimum zone,which is the oldest water in the global ocean.The N2O concentration in the GS is ~2 nmol·L-1higher than that in the CB,indicating the age difference between these two water masses.The oldest water in the GS is approximately 40 years old,whereas the deep water in the CB may be 300–500 years old (Zhan et al.,2015a).Zhan et al.(2015a) reveals that the N2O concentration in a certain water parcel and the age of this parcel are significantly correlated.A simulation of the N2O concentration in the intermediate CB water and deep CB water using a model based on the above correlation presented results that correspond well with the field observation results,thus showing that N2O can be used as a tracer for ocean circulation.
The N2O concentration difference between the CB and BS in the 3000 m to 4000 m interval is approximately 10 nmol·L-1.Assuming that the accumulation rate is 0.0057 nmol·L-1(Bange and Andreae,1999),the difference in the age between the BS deep water and CB deep water is approximately 1754 years,which is very close to that from the evaluation by Bange and Andreae (1999).However,Bange and Andreae (1999) mainly studied the water below 2000 m,and a deep water formation may occur in the Southern Ocean,even in the Aleutian Basin (Warner and Roden,1995),which may bring relatively “new” N2O to the bottom water.Hence,it is important to estimate the contents of N2O in the deep ocean.The answer to this question will help to better constrain not only the production of N2O in the deep ocean but also the N2O sink strength of high-latitude oceans.
4 Source/sink characteristics of the polar and sub-polar oceans
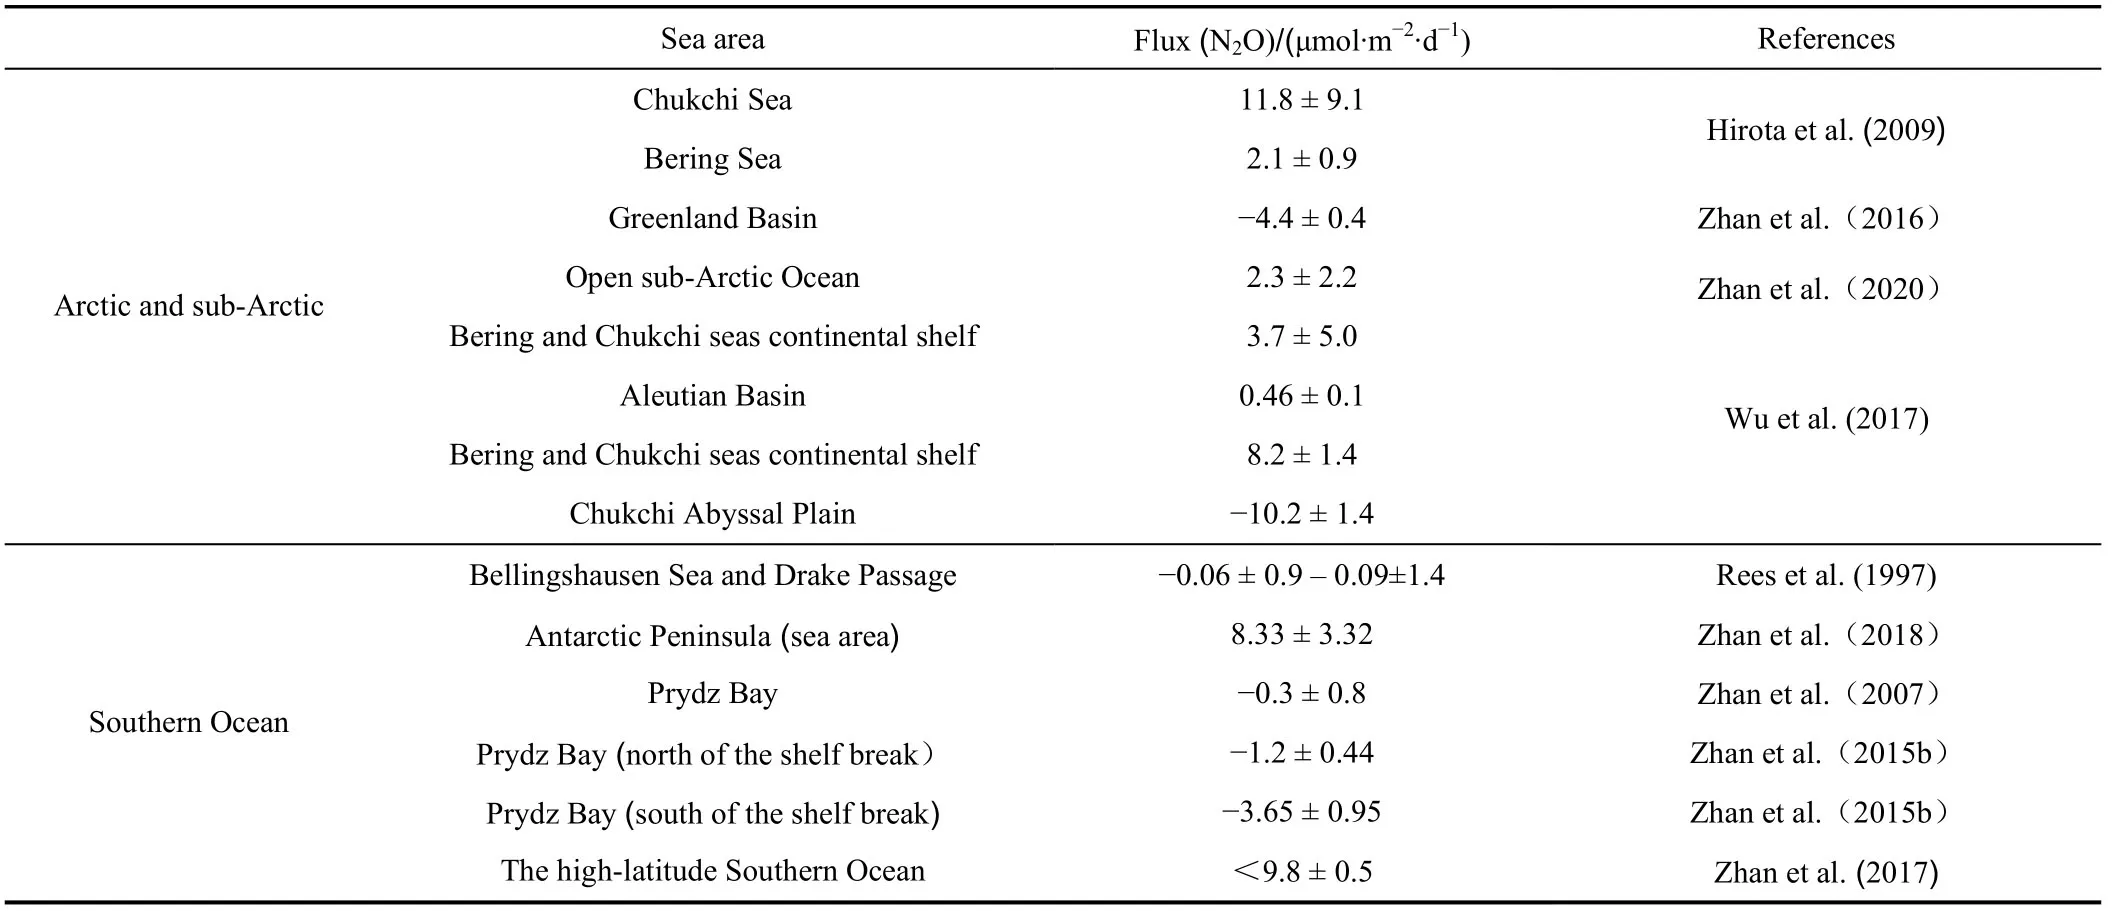
The contribution of oceans to the global N2O budget is approximately 4 Tg N·a-1;however,the role of polar and sub-polar oceans is not well constrained.The contribution of N2O from the Arctic Ocean has been previously neglected,which is probably because this ocean is mostly covered by sea ice.However,global warming has led to sea ice retreat,thus exposing more Arctic Ocean water,which may result in changes to the source/sink characteristics of the Arctic Ocean.Wu et al.(2017) showed that the BS did not show obvious source or sink characteristics while the continental shelves (both BS and Chukchi Sea) and open Arctic Ocean showed source and sink characteristics during the expedition (Table 1).However,the “sink” characteristic is probably a seasonal phenomenon caused by the seasonal melting of sea ice.Due to its role as one of the deep convection centers,the GS is the only permanent N2O sink that has been discovered thus far.For the past 40 years,the sink strength of this region has been approximately-5.0 ± 0.4 μmol·m-2·d-1to-4.4 ± 0.4 μmol·m-2·d-1(Zhan et al.,2016).

Table 1 The air-sea fluxes of polar and sub-polar oceans
The Southern Ocean has been considered one of the most important oceanic N2O sources to the atmosphere as proposed by Bouwman et al.(1995),who assumed that the upwelling of N2O-rich CDW in the Southern Ocean may be a significant source for atmospheric N2O.Using historical data,Nevison et al.(1995) suggested that the Southern Ocean may contribute approximately 1/3 of the oceanic source;however,her study further revealed that the above evaluation may overestimate the source strength of the Southern Ocean.Thus,the contribution of the Southern Ocean has been approximated at 0.9 Tg N·a-1(Nevison et al.,2005).
To date,few air-sea-flux studies have been performed.The sea-to-air fluxes at the N2O undersaturation regions of Prydz Bay,the Drake Passage and the Bellingshausen Sea are-0.3 ± 0.8 μmol·m-2·d-1,~3.7 ± 1.0 μmol·m-2·d-1(Zhan and Chen,2009;Zhan et al.,2015b) and-0.6 ± 0.4 μmol·m-2·d-1–-0.9 ± 0.7 μmol·m-2·d-1(Rees et al.,1997),respectively,suggesting weak sink characteristics;however,in the upwelling region in the Southern Ocean,a relatively strong source can be observed.The sea-to-air fluxes at the upwelling regions of the Bellingshausen Sea and the area north of the Antarctic Peninsula are 3.1 μmol·m-2·d-1(Rees et al.,1997) and 8.8± 2.2 μmol·m-2·d-1(Zhan et al.,2018),respectively.The N2O produced near the lower euphotic zone may also be a N2O source for the Southern Ocean (Law and Ling,2001).Considering that the upwelling of CDW may occur in certain regions with a limited area,its contribution to the global budget may be limited,whereas N2O production in the low euphotic zone may be limited but has a wider distribution.Therefore,the importance of these two sources and their contributions may need to be evaluated.
5 Conclusions and future work directions
Although the Southern Ocean is considered a significant source of N2O,polar oceans are infrequently studied.However,both polar oceans show that small areas of regional N2O undersaturation can act as a possible temporal or even permanent sink for N2O,which may not challenge the above conclusion,although the contribution of these areas should be further constrained.The accumulation rate of N2O in deep water is very low and linearly corresponds to the age of the water mass,thus facilitating evaluations of the production of the deep ocean and indicating that N2O is a useful tracer.
According to the advances that have been made,the following questions still need to be addressed:
(1) How much N2O will be released into the atmosphere at the upwelling site? What is the difference between the upwelling outcrop region and the non-outcrop region? Does active production of N2O occur in the lower euphotic zone of the Southern Ocean? If so,what is most important contributor to the N2O budget?
(2) What are the N2O source/sink characteristics of the sea-ice margin region of both poles? Will the ice-melting process together with the deep-water formation process provide a N2O sink in the Southern Ocean?
(3) How much N2O is produced in the relatively “young” water masses,such as the Antarctic Bottom Water (AABW),in the deeper part of the ocean?
To address these questions,high-resolution surface water N2O data of the upwelling region should be obtained to illuminate the upwelling-introduced N2O source pattern and constrain the N2O source contributions.Moreover,powerful tools,such as isotope and molecular biological techniques,should be applied to reveal the complicated N2O production mechanism at the sea ice margin and below euphotic layer and more profile data that capture the N2O signal of certain water masses,such as CDW or AABW,should be acquired.With all these efforts,the N2O source/sink characteristics of the Southern Ocean and their role in N2O circulation will be further addressed.
AcknowledgmentsThis work was supported by the National Key Research and Development Project (Grant no.2016YFE0103300) and National Natural Science Foundation of China (Grant nos.41676186 and 41506225).The authors thank the two anonymous reviewers for their constructive comments and suggestions.
Author contributions Zhan L Y wrote the manuscript;and Zhang J X,Li Y H and Wu M participated in the field work,sample analysis and data processing.
杂志排行
Advances in Polar Science的其它文章
- Contents of Volume 31,2020
- Evaluation of the Polar Code in different environments and for different maritime activities in the two polar regions
- Large spread across AeroCom Phase II models in simulating black carbon in melting snow over Arctic sea ice
- Are Antarctic Specially Protected Areas safe from plastic pollution? a survey of plastic litter at Byers Peninsula,Livingston Island,Antarctica
- Air pollutants and greenhouse gases emission inventory for power plants in the Antarctic
- Installing a prototype wind turbine to produce energy in Antarctica to allow a permanent Colombian scientific base to be established
