Large spread across AeroCom Phase II models in simulating black carbon in melting snow over Arctic sea ice
2020-04-12PANShifengDUANMingkeng
PAN Shifeng &DUAN Mingkeng*
1 Collaborative Innovation Center on Forecast and Evaluation of Meteorological Disasters (CIC-FEMD),Nanjing University of Information Science &Technology,Nanjing 210044,China;
2 Key Laboratory of Meteorological Disaster,Ministry of Education (KLME),Nanjing University of Information Science &Technology,Nanjing 210044,China;
3 Joint International Research Laboratory of Climate and Environment Change (ILCEC),Nanjing University of Information Science &Technology,Nanjing 210044,China
Abstract Over two dozen global atmospheric chemistry models contributing to the Aerosol Comparisons between Observations and Models (AeroCom) project were used in this study to drive the Los Alamos sea ice model to simulate the black carbon (BC) concentration in melting snow on Arctic sea ice.Measurements of BC during the melting season show concentrations in the range 2.8–41.6 ng·g-1 (average:15.3 ng·g-1) in the central Arctic Ocean and Canada Basin.Most results from models contributing to the Phase I project were within the 25th and 75th percentiles of the observations,and the multimodel mean was slightly lower than that of the observations.In contrast,there was larger divergence among the Phase II model simulations and the mean value of BC was overestimated.The multimodel mean bias was-3.1 (-11.2 to +6.7) ng·g-1 for Phase I models and +3.9 (-9.5 to +21.3) ng·g-1 for Phase II models.The differences between the models of the two phases were probably attributable to the updated aerosol scheme in the new contributions,in which removal processes are parameterized by considering the actual dimensions and chemical compositions of the particles.This means the removal mechanism acts in a way that is more selective and leads to more BC particles being transported to the Arctic.In addition,higher spatial resolution could be another important reason for overestimation of BC concentration in snow in Phase II models.
Keywords black carbon,AeroCom,melting snow,Arctic sea ice
1 Introduction
Black carbon (BC) is among the particulate species most efficient at absorbing visible light (Bond et al.,2013).BC that originates from mid–high-latitude anthropogenic emissions can reach the Arctic and influence the local climate through direct radiative forcing,semidirect cloud effects,indirect cloud effects,and deposition onto snow and ice surfaces (Quinn et al.,2011).In the Arctic,BC deposition can effectively reduce the surface albedo,leading to more rapid ablation of snowpack and its underlying sea ice (Hansen et al.,2004;Flanner et al.,2007;McConnell et al.,2007;Holland et al.,2012;Goldenson et al.,2012).Previous related studies suggested that the annual mean radiative forcing over the Arctic region attributable to BC deposition is 0.1–0.3 W·m-2(Flanner et al.,2009;Quinn et al.,2011;Zhou et al.,2012;Jiao et al.,2014).However,considerable uncertainty remains regarding this effect in the sea ice region owing to lack of field measurements and model verification.
Many measurements of BC concentration in snow have been conducted in the Arctic during various seasons (e.g.,Grenfell et al.,2002;Forsström et al.,2009;Doherty et al.,2010;Sinha et al.,2017,2018;Jacobi et al.,2019).Previous studies have provided extensive verification of modeled BC deposition using ground observations during spring (e.g.,Flanner et al.,2007;Wang et al.,2011;Dou et al.,2012;Jiao et al.,2014).In contrast,simulations of BC deposition and of its effect on snow and ice ablation in the melting season are poorly validated and thus considerable uncertainties remain (Dou et al.,2016),especially over the Arctic Ocean.It is well known that BC particles could accumulate at the surface layer of the snowpack through melting of snow,strengthening BC–snow albedo feedbacks (Doherty et al.,2013;Dou et al.,2017;Dou et al.,2019).Therefore,uncertainties regarding BC deposition and the redistribution of BC particles in melting snow might be amplified in modeling of sea ice ablation.
It is necessary to validate the modeled results of BC in melting snow to reduce the uncertainty of such simulations over sea ice areas in the melting season.The Aerosol Comparisons between Observations and Models (AeroCom) project was initiated to allow the aerosol observation and modeling communities to enhance understanding of global aerosols and of their impact on climate (Samset et al.,2013).A large number of atmospheric chemistry and climate models have contributed to the AeroCom archive (Koch et al.,2009;Myhre et al.,2013).Here,we assessed the performance of state-of-the-art aerosol models in simulating BC in melting snow over Arctic sea ice using observations published in earlier studies (Perovich et al.,2009;Doherty et al.,2010;Dou et al.,2012).Two phases of AeroCom models were considered in this study,and the differences between the two sets of modeled results and the intermodel divergences were analyzed.
2 Data and methods
Monthly gridded fields of BC deposition output from 12 (13) models contributing to Phase I (II) of the AeroCom project were used to simulate the BC concentration in melting snow over Arctic sea ice.Table 1 summarizes the names,resolutions,and emission rates of the 25 models.Phase I simulations were performed under the present-day “B” protocol (Kinne et al.,2006) with all models adopting harmonized BC emissions fields,while Phase II simulations were performed under the present-day “A2 control” protocol (Schulz et al.,2009) with each model adopting its own emissions fields.
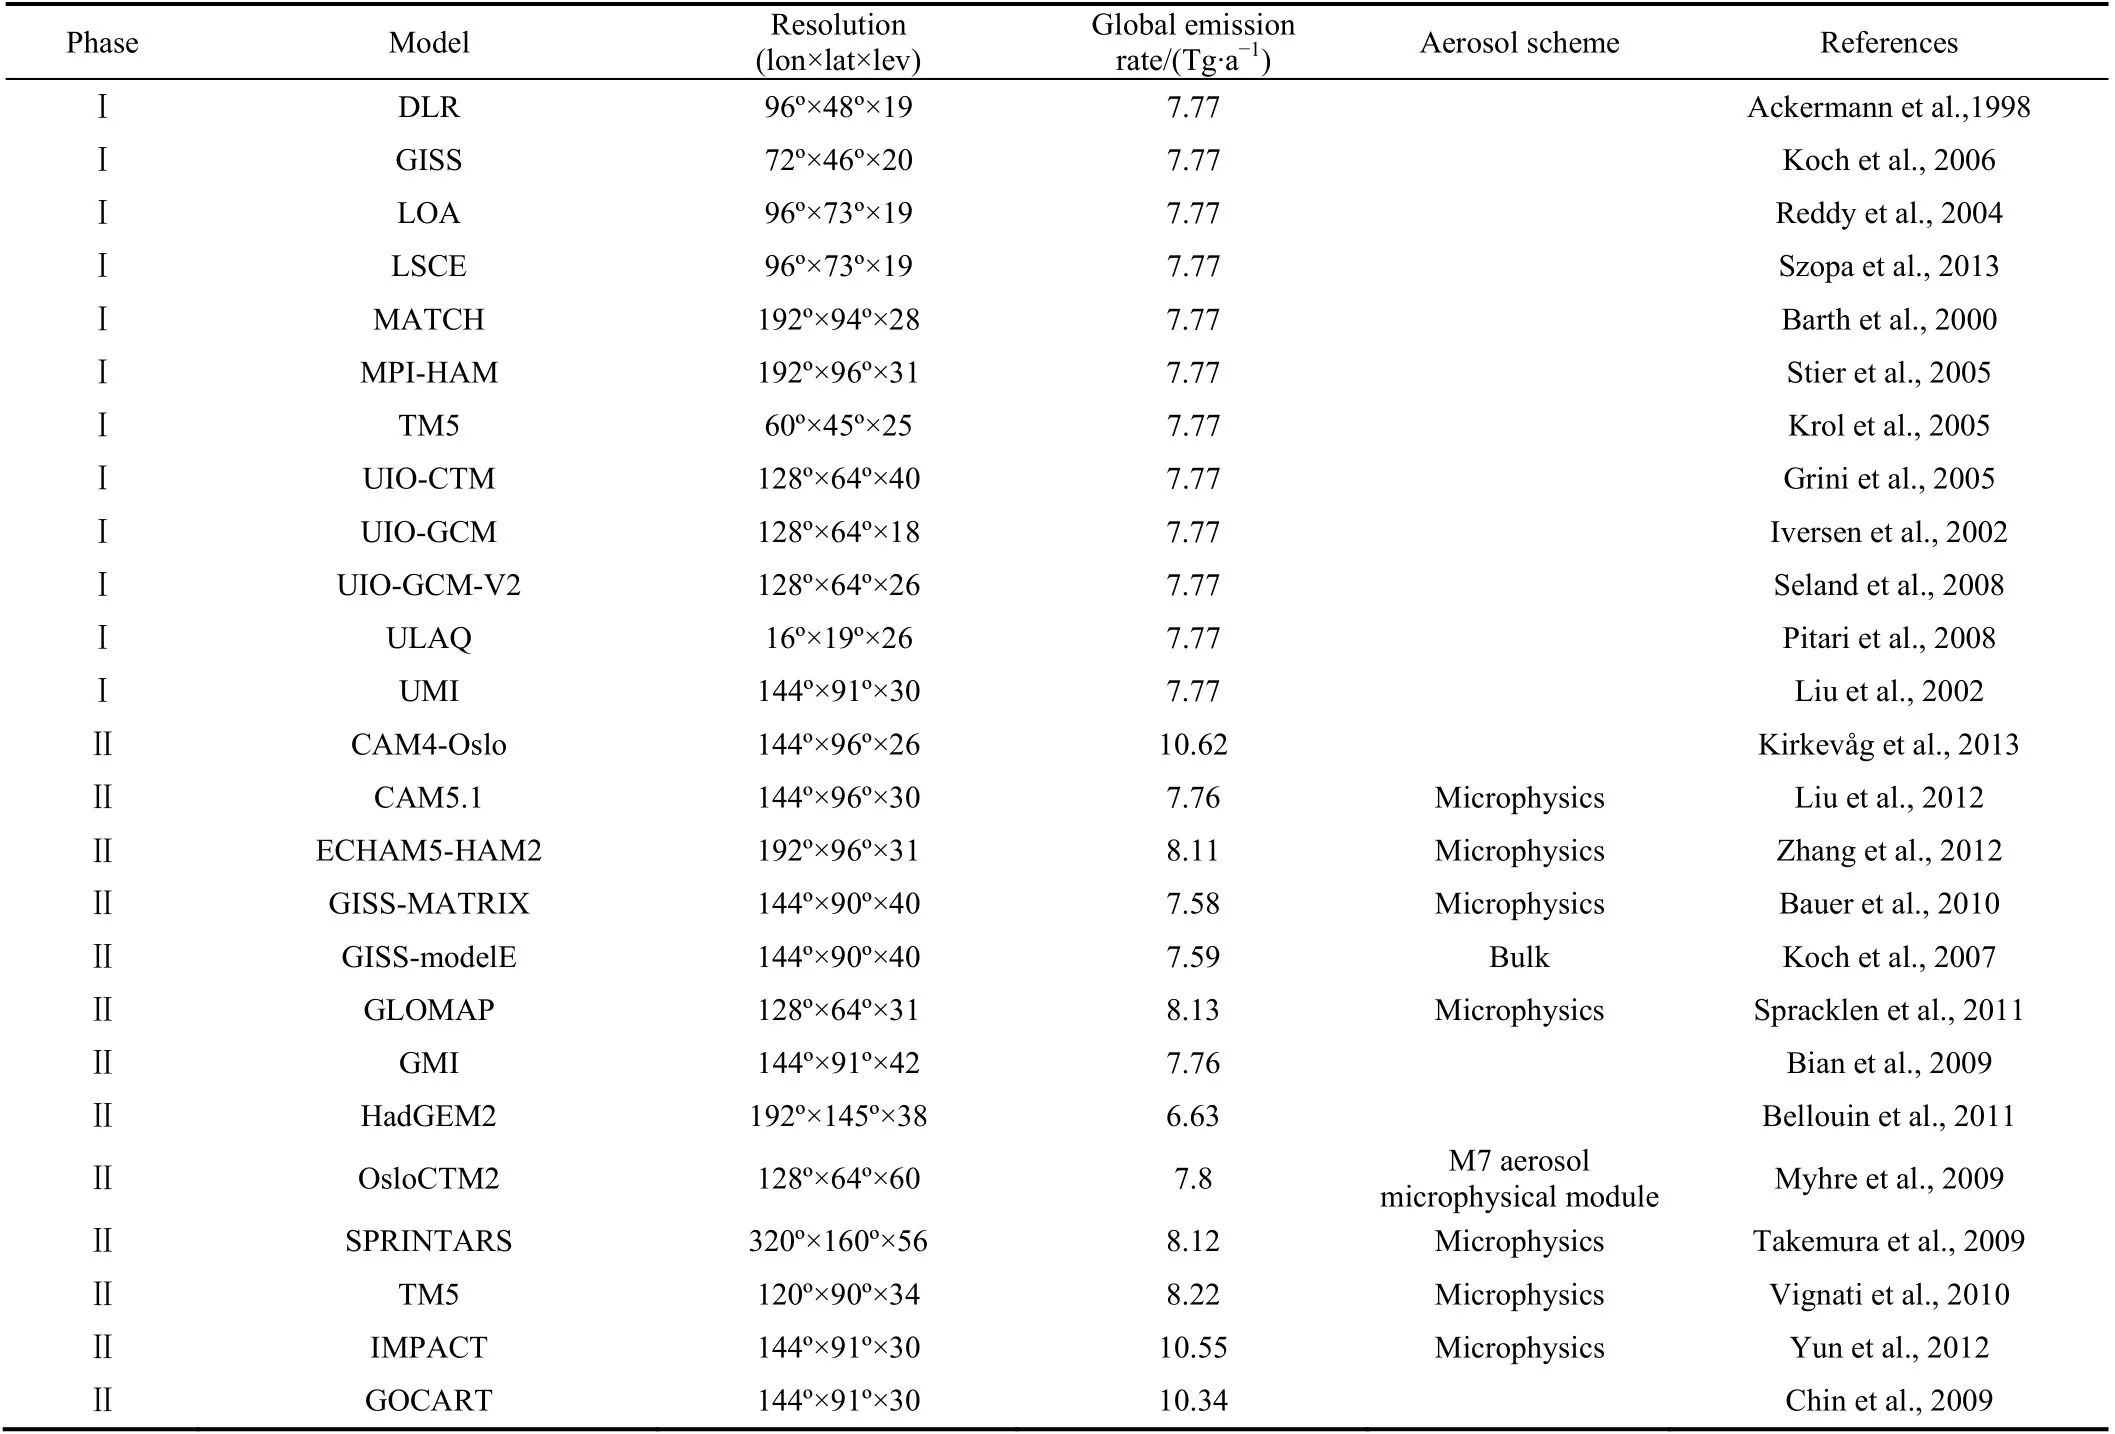
Table 1 Phase I and Phase II AeroCom models used in this study
All fields of BC deposition were regridded to 1.9° × 2.5° resolution and used to drive the Los Alamos sea ice (CICE) model with NCEP/NCAR reanalysis data (with 6-h temporal resolution) in 2005,2008,and 2010,which is when the BC measurements were conducted.This model is able to simulate the effects of BC deposition,meltwater scavenging,and sublimation on the vertical profile of BC within snow cover.Further details regarding the performance of the CICE model can be found in Holland et al.(2012).For hydrophilic and hydrophobic BC,the scavenging coefficients were set at 0.2 and 0.03,respectively,according to Flanner et al.(2007) and Jiao et al.(2014).
The CICE model includes two snow layers on the sea ice surface,and the thickness of the surface snow varied with the modeled depth of the entire snow layer (Hunke et al.,2011).For example,for thick snow (>8 cm),the surface snow layer was specified as 4 cm,while for thin snow (≤8 cm),the surface snow layer was set at half the total thickness (Holland et al.,2012).On average,during the sampling period,the observed snow depth was approximately 5 cm (Dou et al.,2013).Thus,we used the snow water equivalent of the different layers as weights when calculating the weighted average of the BC concentration in the entire snow layer,which we then compared with the observations obtained during the same period.The spatial distribution of the observations used for model verification is shown in Figure 1 and further details are listed in Table S1.As snow melts,superimposed ice will form on the sea ice surface,some of which will mix with the depth hoar at the bottom of the snow layer (Dou et al.,2012).In practice,it is difficult to distinguish between them during the sampling process.Therefore,BC concentrations in “snow/ice samples” were used to validate the model results in this study.For measurement sites within the same model grid,the observed values were averaged to provide a single value for comparison with the modeled value.
3 Results and discussion
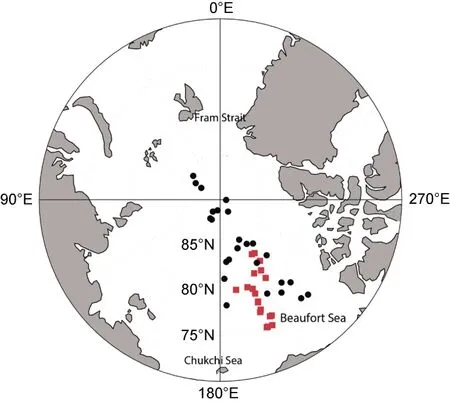
Figure 1 Distribution of measurement sites used in this study.Red squares indicate measurement sites during the 1st Korean Arctic Expedition in summer 2010 (Dou et al.,2012).Black circles indicate the observations provided by Doherty et al.(2010),involving measurements conducted during the HOTRAX* campaign in summer 2005 and during the UVic** campaign in summer 2008.During these three campaigns,the melting snow on Arctic sea ice was sampled.Notes:*The Healy-Oden Trans-Arctic Expedition (HOTRAX) was a summer transect of the Arctic Ocean from the Bering Strait to Fram Strait performed by two icebreakers (Oden and Healy) in 2005.**The UVic campaign was a summer transect in the Beaufort Sea coordinated by the University of Victoria in 2008.
Based on the observations on BC in snow on Arctic sea ice,collated from earlier studies (Table S1),we estimated that the BC concentration in melting snow over the central Arctic Ocean and Canada Basin was in the range 2.8–41.6 ng·g-1(average:15.3 ng·g-1).Before verification,the model results were interpolated to each measurement site in the corresponding month and year of the observations and compared with the mean observed value in cases where more than one measurement was available within a model grid box.Observation–model comparison revealed that all the model results were within the observed minimum and maximum thresholds,although intermodel divergence was large.In comparison with the mean value of the observations,the multimodel mean bias was-3.1 (-11.2 to +6.7) ng·g-1for Phase I models and +3.9 (-9.5 to +21.3) ng·g-1for Phase II models.The results of most Phase I models were concentrated within the 25th and 75th percentiles of the observations,and the average value of the multimodel results was slightly lower than that of the observations (Figure 2).In contrast,model divergence was more apparent in the Phase II contributions,and the mean value of BC concentration was overestimated (Figure 2).Overestimation of the multimodel mean for the Phase II models was mainly driven by overestimation in OsloCTM2,HadGEM2,GOCART,and TM5.
In this study,all simulations were conducted using the same sea ice model driven by the same atmospheric reanalysis data and different atmospheric chemistry models.Thus,the simulated discrepancies of BC values in melting snow were attributable mainly to intermodel diversity in BC deposition.The simulation of BC deposition depends on the emission inventory,parameterizations of aerosol aging,aerosol–cloud interactions,and dry and wet removal processes (Quinn et al.,2011).In this study,Phase I models adopted harmonized BC emissions fields (Table 1),although possibly with slight differences in the partitioning of emissions in terms of the vertical space and size distributions.In contrast,each Phase II model adopted its own emissions,for which the emission rates had a normalized standard deviation of 0.23 (Table 1),leading to wider divergence in model deposition flux.Therefore,part of the increased spread in Phase II BC concentrations in snow originated from the use of different emissions inventories.
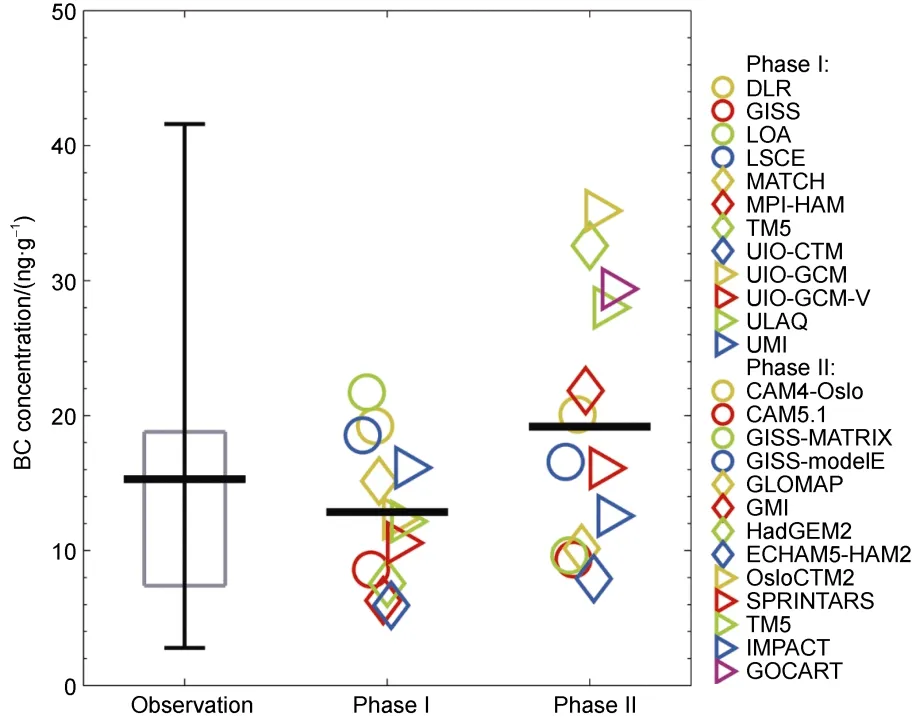
Figure 2 Observed and modeled BC values within melting snow over Arctic sea ice.From left to right:observed snow BC,simulated concentrations over the observational domain based on AeroCom Phase I models,and simulated values from Phase II models.The gray box indicates the 25th and 75th percentiles of the observations,and the whiskers depict the threshold of observed minimum and maximum values.The bold horizontal line indicates the mean value of the observations/multimodel results.Each colored dot represents the mean result of a particular model averaged over the grid cells matching the location,time,and depth of the measurements.
The most important update in the Phase II contributions is the incorporation of a new aerosol scheme.Phase I models apply an aerosol process described as a bulk scheme (Krol et al.,2005).For bulk models,wet removal is overestimated because BC particles are considered wholly soluble in clouds,and because the hygroscopic state and particle size are not taken into account.In contrast,for most models contributing to Phase II (e.g.,TM5,OsloCTM2,HadGEM2,GOCART,SPRINTARS,GMI,and GISS),a new version of aerosol dynamics is applied (Gilardoni et al.,2011;Mann et al.,2014).In these models,aerosol particles are described in modes with coagulation,condensation,and nucleation considered.The removal processes are parameterized by considering the actual dimensions and chemical compositions of the particles (Glassmeier et al.,2017).Therefore,the new aerosol scheme allows the removal mechanism of BC aerosols to act in a way that is more selective and physically realistic,leading to transportation of BC particles to the Arctic that is more effective (Sand et al.,2017).This is the main reason for the overestimation of BC in melting snow and for the more significant intermodel divergence in Phase II models.In addition,it can be seen that most Phase II models run with higher horizontal resolution (Table 1).Previous studies have indicated that underestimation of aerosol concentrations in the Arctic could be improved in part by increasing the horizontal resolution of the models (e.g.,Wiedinmyer et al.,2011;Ma et al.,2014),which might be an important reason for the overestimation of BC concentrations in snow in Phase II models.
Comparison of the model results and observations in the domain of the field measurements revealed that snow depth was overestimated by approximately 3.5 cm on average during the measurement period,leading to overestimation of the total snow BC content in the snow layer.This was expected because the CICE model does not consider the impact of snow drift (Hunke et al.,2011;Blanchard-Wrigglesworth et al.,2015).Affected by impurity enrichment associated with melting snow in the model,the snow BC concentration will be overestimated.This is another reason for the overestimation in Phase II models.
Comparison of the results of each model in terms of the average,maximum,and minimum values and spatial variability (correlation coefficient) revealed that among the Phase I models,MATCH and UMI could well reproduce the observed value of BC over the measurement area,and that the average value of each model was within the 25th and 75th percentiles of the observations (Table 2).For Phase II models,the results of GISS-modelE were most comparable with the observations (Table 3).

Table 2 Comparison of the results from Phase I models and the observations

Table 3 Comparison of the results from Phase II models and observations
4 Conclusions
Two dozen state-of-the-art global atmospheric chemistry models contributing to the AeroCom project were used to drive the CICE model to simulate BC concentration in melting snow over Arctic sea ice.Results showed that the multimodel average of the models contributing to Phase I could generally reproduce the mean level of observed BC concentrations over the Arctic Ocean and Canada Basin,and most of the simulated BC values were concentrated within the 25th and 75th percentiles of the observations.The dispersion in the results of the Phase II models was larger and the mean value of the multimodel results was overestimated in comparison with the observed average concentration.The main reason is the adoption of a new and more selective aerosol scheme in the Phase II models that reduces the BC scavenging efficiency and increases intermodel differences.Overall,the Phase II multimodel results showed no significant improvement in the simulation of BC concentration in melting snow,but did indicate increased intermodel discrepancies.
In terms of individual models,the MATCH and UMI (Phase I) and GISS-modelE (Phase II) models showed better performance in simulation of BC concentration in melting snow over Arctic sea ice.To provide reasonable estimations of BC concentration in melting snow and of its radiative forcing effect over Arctic sea ice,it would be beneficial to first select the optimal models through comparison with observed vertical profiles of aerosol BC in the Arctic,and then use the selected models to drive the sea ice model.Of course,more extensive observations of BC concentration in melting snow will be necessary for model verification.Meanwhile,further improvement is needed regarding the parameterization of BC scavenging associated with melting snow because the redistribution and/or enrichment of BC particles can greatly affect the BC concentration in melting snow.
AcknowledgmentsThis study is funded by the Program of National Natural Science Foundation of China (Grant nos.41675056 and 41991283).We are grateful to the High-Performance Computing Center of Nanjing University of Information Science &Technology for conducting the numerical calculations.The authors thank the reviewer,Dr.H W Jacobi,and another anonymous reviewer for their constructive comments and suggestions.
Appendix
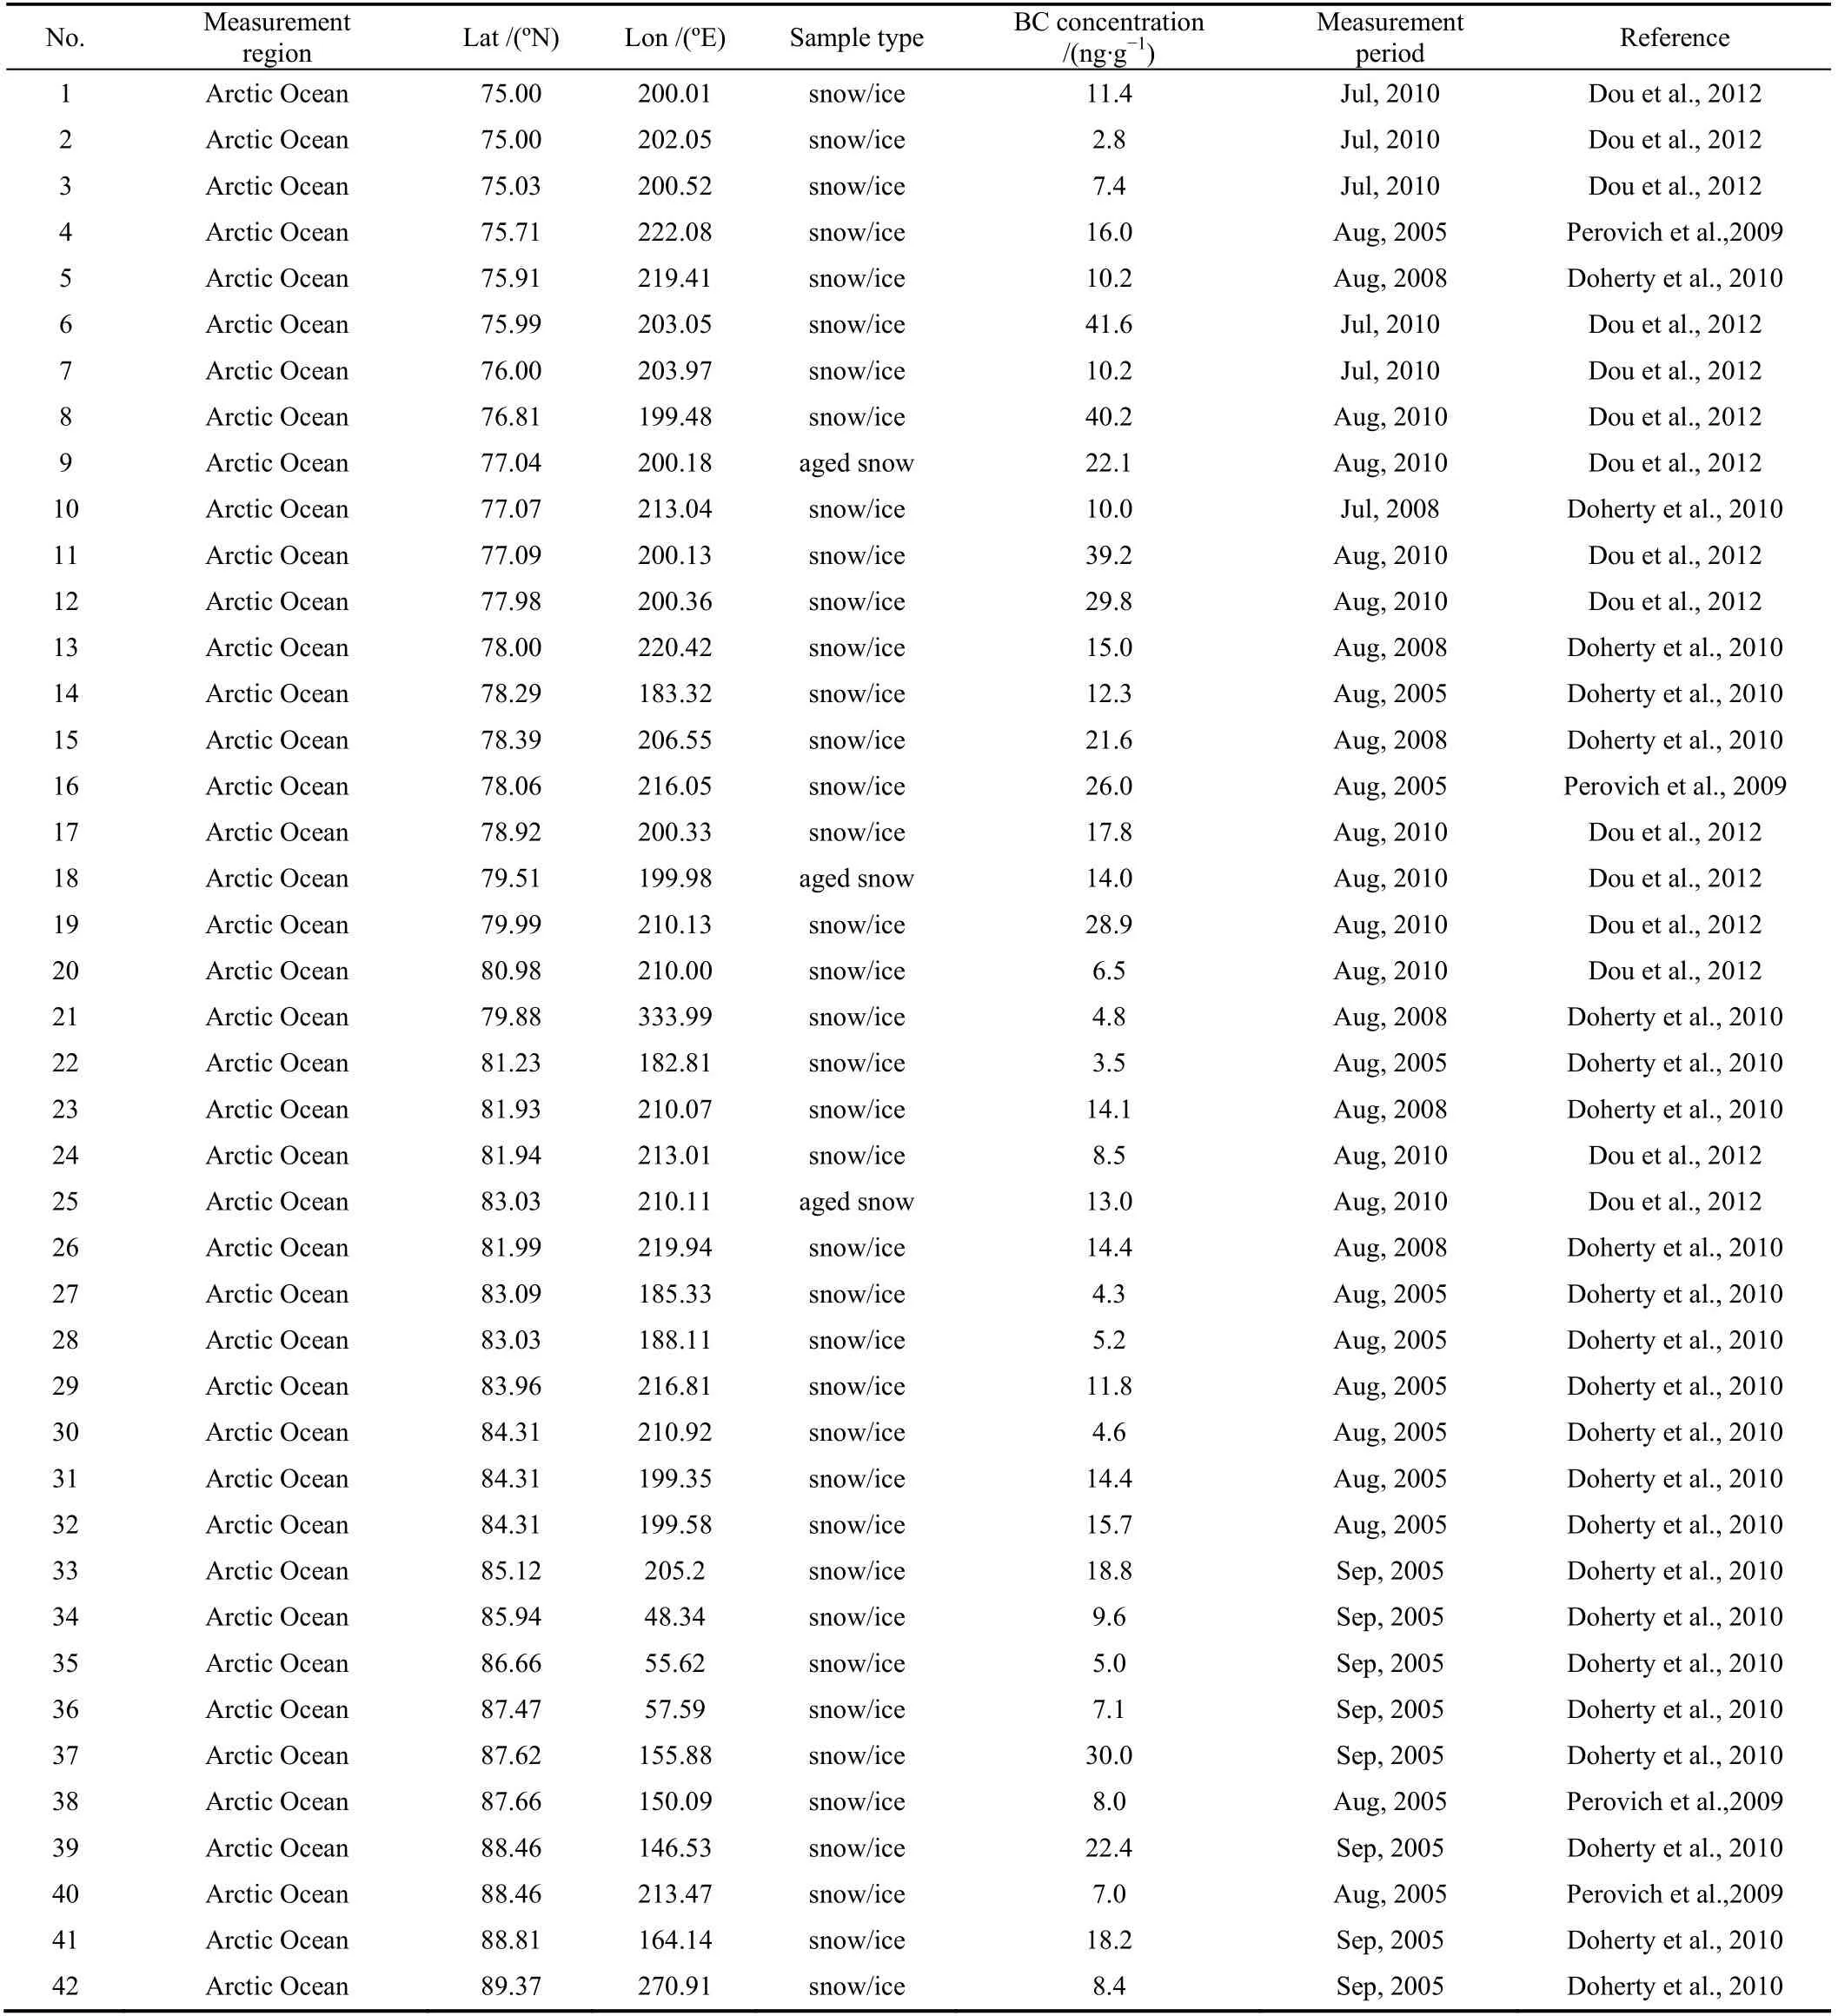
Table S1 BC concentrations observed in the melting snow over summer Arctic sea ice
杂志排行
Advances in Polar Science的其它文章
- Contents of Volume 31,2020
- Evaluation of the Polar Code in different environments and for different maritime activities in the two polar regions
- Are Antarctic Specially Protected Areas safe from plastic pollution? a survey of plastic litter at Byers Peninsula,Livingston Island,Antarctica
- Air pollutants and greenhouse gases emission inventory for power plants in the Antarctic
- Installing a prototype wind turbine to produce energy in Antarctica to allow a permanent Colombian scientific base to be established
- Approximating home ranges of humpback and fin whales in Drake Passage and Antarctica
