集中通风式分娩母猪舍温湿度数值模拟与试验验证
2020-04-09曾志雄魏鑫钰吕恩利刘妍华易子骐郭嘉明
曾志雄,魏鑫钰,吕恩利,刘妍华,易子骐,郭嘉明
集中通风式分娩母猪舍温湿度数值模拟与试验验证
曾志雄1,魏鑫钰1,吕恩利1,刘妍华2,易子骐1,郭嘉明1※
(1. 华南农业大学工程学院,广州 510642;2. 华南农业大学工程基础教学与训练中心,广州 510642)
为研究集中通风式猪舍温湿度场的分布规律,利用计算流体力学技术,对云南省某规模猪场的地沟进风、中央排风式分娩母猪舍进行温湿度场耦合模拟研究,并通过试验进行验证。本研究采用四面体非结构网格进行网格划分,运用重整化群RNG湍流模型进行稳态模拟,通过实测值与模拟值的对比,对模型进行验证。研究结果表明,温度模拟值与实测值最大差值不超过4 ℃,平均相对误差为6.5%;相对湿度模拟值与实测值最大差值不超过10%RH,平均相对误差为7.3%,验证了模型的准确性。温度、相对湿度和风速在垂直高度上的分布差异较大,温度随着垂直高度的增加而增加,且温度梯度逐渐增大;相对湿度随着垂直高度的增加而减小;而风速则随着垂直高度的增加而逐渐减小。本研究揭示了集中通风式分娩母猪舍的温湿度场分布规律,并为分娩舍温湿度场的优化提供参考。
数值模拟;猪舍;温度;湿度;分布特性
0 引 言
猪对生育环境的要求较高,温度、相对湿度、气流速度、氨气浓度、二氧化碳浓度和通风量对其产生影响,其中温度和相对湿度的影响最大[1-2]。Zhao等[3]的调查结果表明华南地区夏季高温多湿,母猪的淘汰率较高,且在7月达到峰值。Myer等[4]则发现湿热环境将减少猪的进食量。Xiong等[5]总结了相对湿度对动物健康的影响,不适宜的湿度将增加动物的疾病感染率。目前,猪舍多采用湿帘风机的方式,维持夏季舍内的温度与湿度,并取得了较好的效果[6-8]。且国内外有不少学者针对湿帘的厚度、材料和风速等,对猪舍内温度场分布的优化研究作出了重要贡献[9-11]。
国内外多采用试验测试、数值模拟等方法开展猪舍温湿度场的研究。试验方法是研究猪舍内部环境(温度、湿度、通风速率、氨气浓度等)的主要方法[12-16]。然而,试验方法具有测量点有限、测量误差、环境不可控和不稳定等缺点[17]。尽管使用比例模型和风洞试验可以较好地解决内部空气流动的问题[18-19],但仍需花费大量的时间和成本。计算流体力学(computational fluid dynamics, CFD)具有缩短时间周期、节省研究成本等优点,目前已广泛应用于农业各领域[20-26],弥补了传统试验方法的缺陷。林加勇等[27]采用标准湍流模型研究了公猪舍的舍内环境分布规律,研究结果显示风速场模拟值与实测值相对误差范围在0.25%~30.8%。Sun等[28-29]分别采用二维和三维CFD模型模拟猪舍内的气流和氨气浓度分布,并比较了不同湍流模型对结果的影响,结果表明2种模型的模拟值与试验值差异不显著,且湍流模型比层流模型的模拟值更接近试验值。王小超等[30]利用标准模型对空载猪舍温度场和气流场进行数值模拟,研究结果表明模拟值比试验值高,且不同的送风角度对温度场和气流场的分布均有影响,且在45°时舍内的温度场和气流场分布较均匀。
目前,国内外学者对集中通风式猪舍建立温湿度场耦合模型的报道较少。谢秋菊等[31]利用Matlab Simulink建立了模拟北方夏季密闭猪舍环境温湿度的模型,结果表明猪舍内温度、湿度模拟与实测值变化趋势一致,温度最大误差为2.4 ℃,最大相对误差为9.2%,舍内相对湿度最大误差为13.34%,最大相对误差为49.66%。
本研究通过建立集中通风式分娩母猪舍的CFD模型,对分娩母猪舍的温湿度场进行模拟,揭示舍内气流组织及其分布规律,对猪舍的结构及温湿度场优化具有一定的参考意义。
1 材料和方法
1.1 试验猪舍
试验猪舍位于云南省沾益市(25°91″N,103°73″E)。该猪场占地面积33.6 hm2,总建筑面积为8.7 hm2。设计生产规模为年出栏商品仔猪18万头,种猪7万头。该舍共有4条生产线,每条生产线均实现了全套化配种、怀孕、分娩等生产作业过程。猪舍采用集中通风式设计,猪舍建筑全部封闭,具有自动化的环控系统、刮粪系统、送料系统等作业设备。
测试的分娩舍整体尺寸为长32.6 m、宽5.8 m、高2.8 m,为东西走向,舍内空间完全密闭(图1a)。分娩舍单元设置成2列,每列18头母猪,舍内中间有1条走道。该舍降温采用地沟进风、中央排风的负压湿帘通风系统。通风系统利用山墙的大功率风机进行抽风,舍外的新鲜空气先流经湿帘和卷帘,随之从地沟的进风管道进入猪头区域,最后经中央排风口的无动力风机排出。中央排风口采用重量轻、可测空气流量的无动力风机,其直径为0.8 m。母猪被限定在长0.6 m、宽2.1 m、高0.8 m的限位栏内,仔猪匍匐或站立在电热毯上,电热毯的尺寸为长1 m、宽0.8 m。每个猪栏的尺寸为1.8 m、宽2.4 m、高0.5 m。中间过道的宽度为1 m。图1为该分娩舍的示意图。
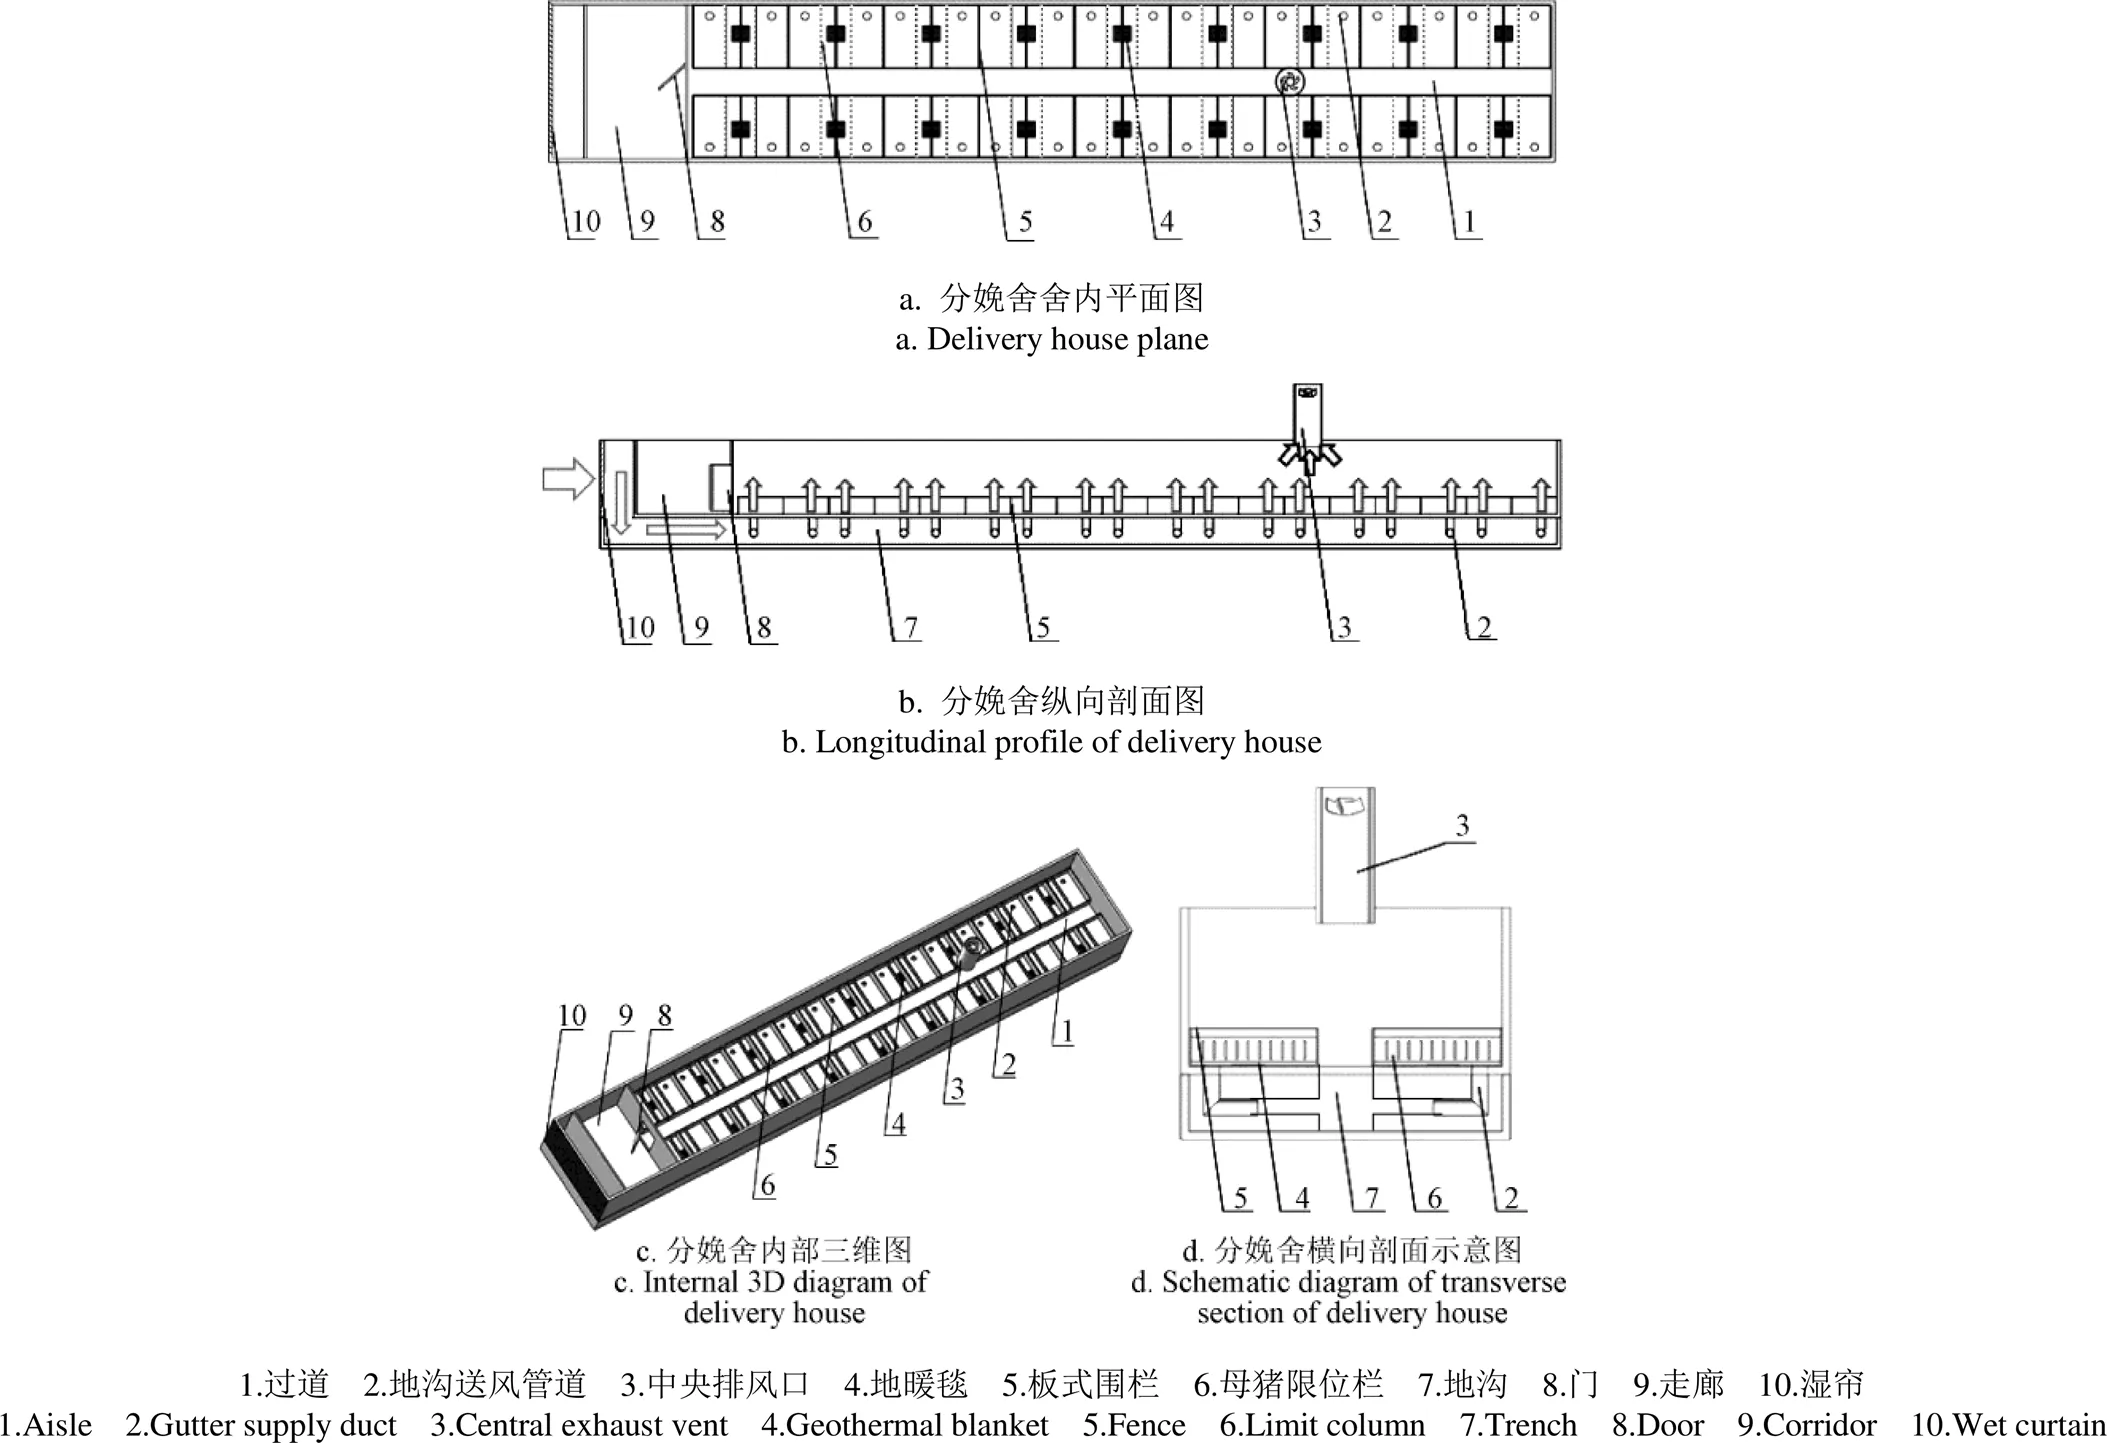
图1 分娩舍布局
1.2 模型参测量
现场测量时间为2018年8月17日下午。当日猪舍舍外气温为17~24 ℃,相对湿度为56%~93%,为西南地区夏季典型气候水平。该分娩舍单元共有母猪36头,仔猪396头,仔猪猪龄为8~14 d。本试验采用热线式风速仪(德国德图集团,型号testo 425,量程为0~20 m/s,精度为0.03 m/s+5%测量值)和温湿度计(中国台湾群特股份有限公司,型号CENTER 310,温度测量范围:−20~60 ℃,相对湿度测量范围:0~100%)检测猪舍内外环境中的风速、温度和相对湿度。热成像仪(美国菲力尔公司,型号FLIR T400,热灵敏度<0.045 ℃,测量范围:−20~120 ℃)则用于测量围护结构的内表面温度,以及母猪与仔猪体表的温度。
测量点的分布如图2所示,作为后续模拟验证条件。采用无线多源多节点监测系统[32-33],该系统由多个监测传感器节点以及1个主节点组成。监测传感器节点为温湿一体传感器,高度()分别为90、50和35 cm。=90 cm的无线传感器置于猪头部上方侧边区域,监测母猪头部上方的温度,每列间隔布置8个。=50 cm的传感器置于猪栏挡板中间位置,每列间隔布置8个,监测仔猪群上方的温度。=35 cm的传感器置于过道的猪尾部栏挡板上,监测猪栏尾部温度。同时,在舍外和湿帘后分别布置2个无线传感器节点。
为评价舍内温湿度场的分布状况,引入不均匀系数作为其评价指标[34]。绝对均匀度可用下式表示:

式中t为第个测点的温度,℃;t为个测点的平均温度,℃。
注:图中0~15号节点高度90cm;16~33号节点高度为50cm;34~41号节点高度为35 cm;42、43号节点在湿帘后,高度35cm;44、45号节点在室外、湿帘前,高度100cm。
Note: Height of node 0-15 is 90 cm;height of node 16-33 is 50 cm; height of node 34-41 is 30 cm;height of node 42,43is 35 cm,behind the wet curtain; height of node 44,45is 100 cm, outdoor and in front of wet curtain.
图2 分娩舍传感器节点布置示意图
Fig.2 Schematic diagram of sensor layout in delivery house
2 CFD数值模型
2.1 基本控制方程
2.1.1 质量守恒方程
任何流动问题都满足质量守恒定律,即:单位时间内流体微元体中质量的增加等于同一时间间隔内流入该微元体的净质量。


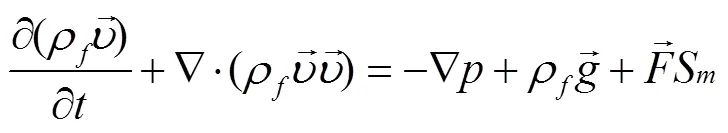
2.1.2 动量守恒方程
动量守恒定律即:微元体中流体动量对时间的变化率等于外界作用在该微元体上的各种力之和。
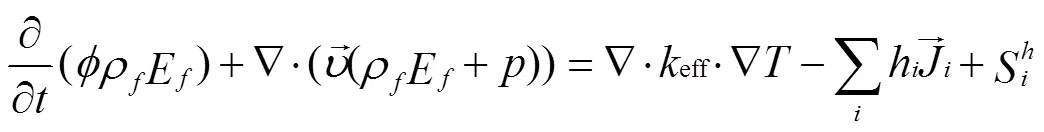
2.1.3 能量守恒方程

2.1.4 组分传输方程
为研究舍内湿度场的分布规律,引入基于组分质量分数的输运方程[35]。其方程为

式中Y为组分的质量分数,本研究即为水蒸气的质量分数,通过试验测得进口的相对湿度为99%,转换成质量分数的数值为0.014 788;S为水蒸气质量源项,kg/(m3·s)。
2.2 数值模型前处理
为提高计算效率,节约计算机模拟时间,采用SolidWorks建立分娩母猪舍物理模型(图3),并简化限位栏、漏粪地板、母猪和仔猪等结构,将母猪和仔猪假设为与实际等三维尺寸的长方体[27]。采用ICEM CFD将模型离散成四面体非结构网格(图4),并对壁面、仔猪与母猪进行局部加密。所划分的网格单元数2 695 341,节点数为1 612 356,整体的网格数量为1 690 897。

图3 猪舍模型图
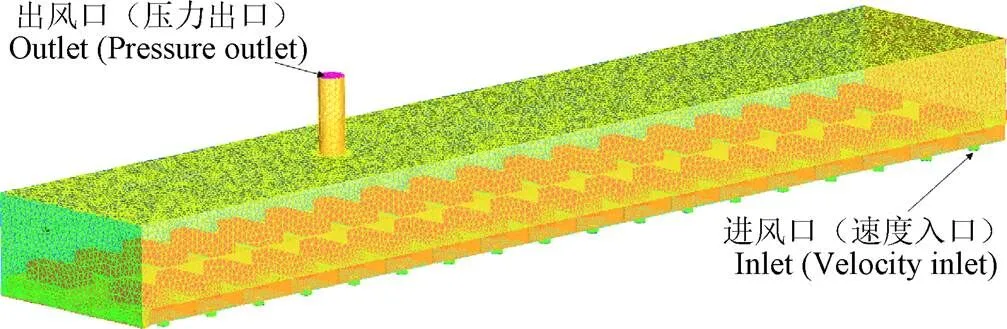
图4 网格模型
2.3 边界条件设置及求解
为简化模型,提高仿真效率,对模型进行如下假设[36-37]
1)舍内气体为牛顿流体;
2)舍内气体在流动过程中不可压缩且符合Boussinesq假设;
3)水蒸气在固体壁面不凝结;
4)舍内气密性良好。
在该模拟研究中,由于试验测试时,猪舍外界温度较稳定,负压风机连续运行,故采用稳态模拟[2]。
对分娩母猪舍模型进行雷诺数求解[37-38],雷诺数根据经验公式(6)计算。

式中(雷诺数)为流体力学中表征黏性影响的相似准则数;为流体密度,取1.225 kg/m3;为速度,取1.445 m/s;为特征直径,取0.3 m;为动力粘度系数,取17.9×10⁻⁶Pa·s。求得雷诺数约为29 667,为高湍流状态,故选择湍流模型。
Seo等[17,26]和Lee等[39]发现重整化群RNG湍流模型能有效表达畜禽舍内流场分布,故本研究选择精度较高的重整化群RNG湍流模型开展了数值模拟。
舍内进气口设置为速度入口,共计36个速度入口。出口边界条件设置为压力出口。固体壁面为无滑移的壁面,热边界条件设置为温度。考虑到猪只的产热最终作用于体温的维持,故将猪只设置为恒温体,表面温度由热成像仪获得,忽略猪只的呼吸热。舍内空间较大,猪只表面对气流的影响较小,故将其表面设置为光滑壁面。
风机出口设为压力出口,其他边界条件设置如表1所示。

表1 边界条件设置
3 结果与讨论
3.1 试验验证
图5a为各测点实测温度与模拟温度对比图。其中,温度模拟值与实测值最大差值不超过4 ℃,相对误差为0.44%~17.04%,平均相对误差为6.5%。图5b为各测点相对湿度实测值与模拟值对比图。其中,相对湿度模拟值与实测值最大差值不超过10%RH,相对误差为0%~13.9%,平均相对误差为7.3%,相比于谢秋菊等[31]的湿度相对误差为49.66%的结果更准确。通过式(1)可得,猪舍的温度场均匀性系数为1.29,相对湿度场均匀性系数为1.51,温度场均匀性比湿度场好。从对比结果可以发现,温度模拟值相对于实测值整体上偏小,而相对湿度模拟值相对于实测值整体偏大,可能是因为模拟过程中未考虑猪只的呼吸热,从而造成温度的模拟结果偏小。同时由于温度模拟值比实测值偏低,导致相同质量的水蒸气在表示为相对湿度时数值会偏大。计算结果的相对误差在合理的范围内,模拟结果较可靠,可准确揭示猪舍内的温湿度场分布情况。
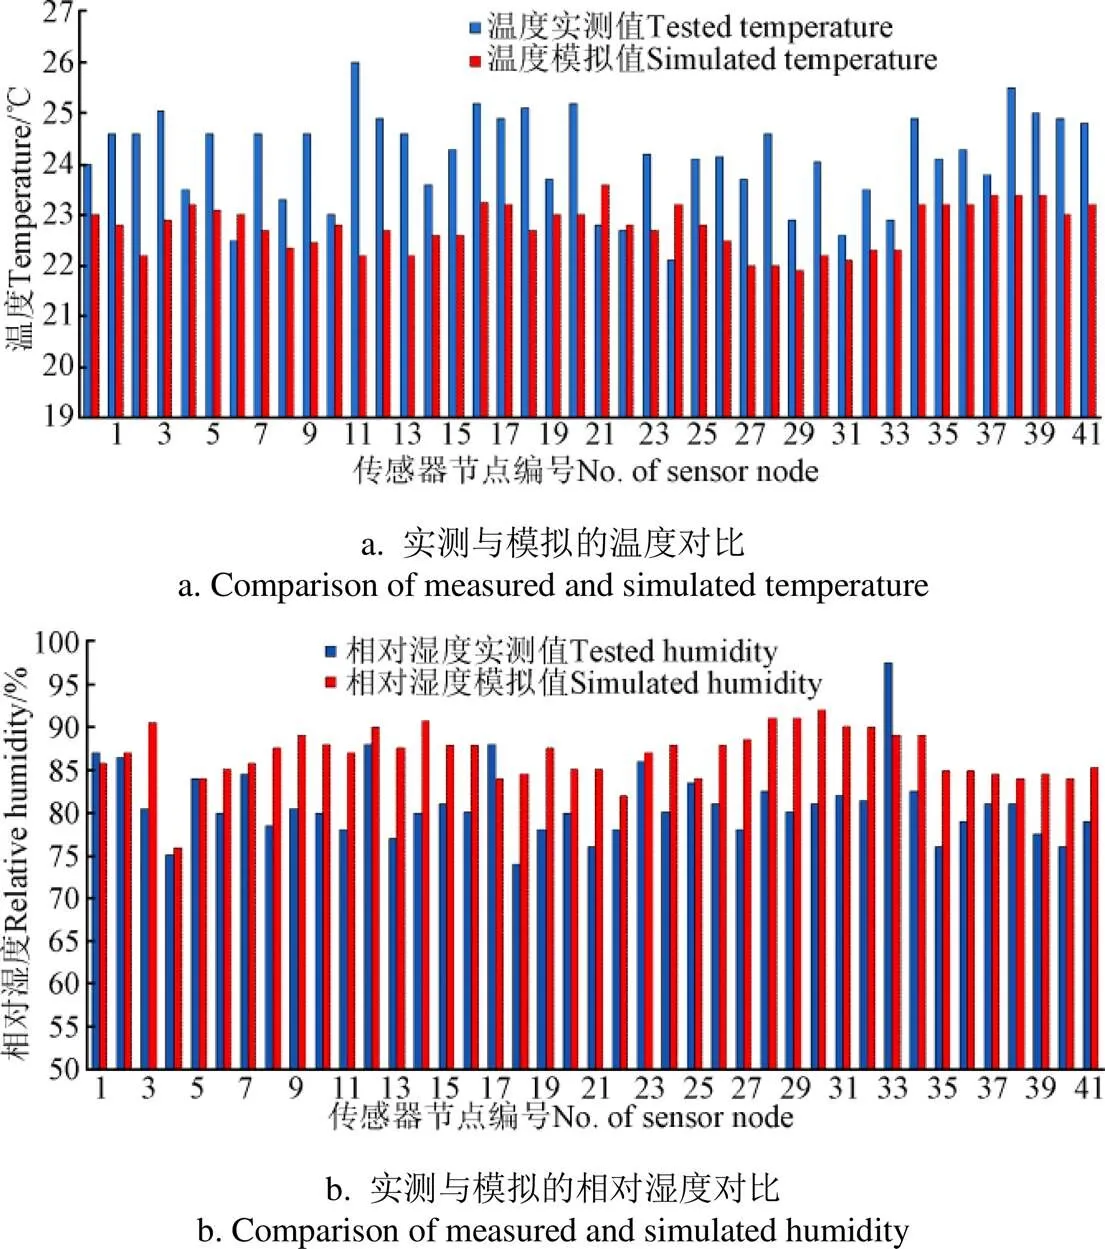
图5 各测点实测值与模拟值对比
3.2 舍内环境评估
3.2.1 温度场
图6a为截取的猪舍纵截面()分别为=5.5 m、=12.7 m、=18.1 m、=22.7 m(风机所在截面)、=28.9 m的5个平面内的温度分布图。其中,各截面上在水平位置上随着高度的增加,温度逐渐升高,且以过道中线为对称轴,各纵截面的温度分布呈现出明显的对称性,说明舍内温度在过道两侧的分布较为一致,验证了该舍采用的负压湿帘通风系统中将进风口对称布置的科学性。在靠近门口、远离风机的=5.5 m和=12.7 m 两个纵截面内,温度的波动相对较小,范围主要分布在20~24 ℃。在较靠近风机的=18.1 m和=28.9 m 两个纵截面内,温度波动较大,且底部温度较低,但随着高度的增加,温度梯度增大(图6c),顶部温度约为27 ℃,一部分原因是由于靠近风机的顶部区域存在气流死区,导致部分区域与顶部换热之后造成局部温度较高;另一部分原因则是由于舍内顶部的热负荷较大,热量主要从天花板传入分娩舍内部,因此使用具有良好隔热效果的保温材料对维持舍内温度场的均匀性具有良好效果。在风机所在截面的=22.7 m内,温度分布与远离风机的纵截面类似,在该截面的中部区域(过道),较高区域的温度较低,原因是该区域内存在较大的气流速度,四周的新风经过短暂的换热后被吹出舍外,使得该区域的温度较低。整体而言,舍内温度在纵截面的分布较均匀,主要分布范围为21~25℃。
图6b为截取的猪舍横截面()分别为=0.2 m、=2.7 m(风机所在截面)、=5.6 m的3个平面内的温度分布图。如图6b 三个位置的横截面所示,在过道两侧的平面内,温度在水平高度上具有明显的分布梯度,而在过道平面内,温度在水平高度上分布较均匀,主要保持在23~24 ℃,出风口的出风温度为24 ℃左右。猪群所在区域,温度基本维持在22~23 ℃。从图中可以看到,吹向猪只头部区域的新风温度为20 ℃,对猪只换热后扩散到周围空气中,因此不会出现仔猪直接吹冷风的现象,且电热毯为仔猪提供了及时的取暖。

图6 温度场分布
3.2.2 湿度场
图7a为截取的猪舍纵截面()分别为=5.5 m、=12.7 m、=18.1 m、=23.5m(靠近风机截面)、=28.9 m的5个平面内的相对湿度分布图。各截面相对湿度随着高度的增加而逐渐降低。底部的进风口区域的相对湿度在90%以上,越靠近中间过道,相对湿度有降低的趋势,但降幅不明显,过道处的相对湿度在80%以上。在仔猪与母猪所处的位置高度内,相对湿度的分布大部分在80%以上。观察各截面与风机的距离关系可以发现,越远离风机的截面,相对湿度变化越大,范围波动更明显;而越靠近风机的截面内相对湿度值波动较小,可能是因为在靠近风机的截面内风速较大,水蒸气迅速地被带出舍外。同时出风口处的气温较低,相对湿度的变化更小。各截面的相对湿度分布与温度类似,同样以过道中线为对称轴,具有明显的对称性。
图7b为截取的猪舍横截面分别为=0.2 m、=2.7 m(风机所在截面)、=5.6 m的3个平面内的相对湿度分布图。与温度分布规律相反,各截面内相对湿度随着高度的增加而逐渐降低,原因是由于水汽的沉积导致舍内湿度分布呈现“下高上低”的现象,整体分布范围主要在80%~100%。由于进风口进入的新风相对湿度较高,母猪需要承受较高的空气湿度,同时,仔猪也由于湿度的扩散会受到空气湿度过高的影响,这是夏季南方地区采用负压湿帘通风系统对舍内降温必然导致的进风湿度较高的问题,如何对进风水汽进行有效除湿,并保证送风湿度在合理范围,是目前对畜禽舍内环境调控的重点与难点。

3.2.3 速度场
图8a为截取的猪舍纵截面()分别为=5.5 m、=12.7 m、=18.1 m、=22.7 m(风机所在截面)、=28.9 m的5个平面内的气流速度分布图。其中,在风机远墙一侧,由于纵深较长,导致气流速度的汇集作用更明显,因此随着纵截面离风机距离的减小,出现截面内风速变化相对剧烈的情况;在此侧离风机较远的=5.5 m截面,气流速度的变化范围主要在0~0.2 m/s,而在较靠近风机的=18.1 m截面内气流速度保持在0.2~0.5 m/s。而在风机近墙一侧,=39.5 m的截面内气流速度变化较小,与截面=5.5 m类似,该截面内主要是在底部存在较小的气流速度,随着高度的增加气流速度逐渐减小,在猪只高度以上的气流速度大部分为0。在=22.7 m截面内,气流速度有明显的分区现象,气流主要汇集在靠近出口处,气流在该纵截面下方的速度较小,可能是由于气流方向主要是以水平截面为主,在纵截面上的较低位置气流速度并不大。但在接近风机出口高度0.2 m的位置,气流速度急剧增加。气流速度与温湿度类似,也存在着较为明显的对称分布特性。整体而言,舍内纵截面风速能满足国标要求,即使是在风速较大的进风口位置,风速维持在0.4 m/s以下,结合水平截面与纵截面的气流分布来看,舍内猪只高度以下不存在气流死区。同时,越靠近风机的猪只需要承受更大的纵向气流,但是气流速度在国标规定值以下,说明了该时刻的舍内风速能保证猪只的正常需求。
图8b为截取的猪舍横截面()分别为=0.2 m、=2.7 m(风机所在截面)、=5.6 m的3个平面内的气流速度分布图。从过道两侧截面可以发现,在猪只旁边会存在一个小的射流,射流方向指向风机方位,说明负压通风的效果显著,对舍内的气流风向起到了较强牵引作用。在靠风机较远一侧,负压抽风的影响范围比靠风机较近的一侧影响更大,因此离风机较远侧的猪只会受到较大气流速度的影响。为减少风机远侧气流速度较大的影响,有必要针对不同位置设计不同结构的风口,以改善舍内猪只生活的舒适性。除了风机下部以及进风口位置会存在较大气流,在整个猪舍的其它大部分位置气流都在0.4 m/s以下,在贴近出风口附近的下部,风速也较小,说明了此种地沟进风、中央排风的负压湿帘通风方式能较好的满足舍内通风情况,该舍对于纵向长度的选择、风机的安装位置、进风速度的设定都较为合理。

图8 速度场分布
4 结 论
通过建立地沟进风、中央排风式分娩母猪舍的CFD模型,对分娩舍的温湿度场进行耦合模拟,主要得出以下结论:
1)采用该模型模拟分娩舍的温湿度场,温度模拟值与实测值最大差值不超过4 ℃,相对误差为0.44%~17.04%,平均相对误差为6.5%。相对湿度模拟值与实测值最大差值不超过10%RH,且相对误差为0%~13.9%,平均相对误差为7.3%。模拟温度值相对于实测值整体上偏小,而相对湿度模拟值相对于实测值整体偏大。
2)从温湿度的空间分布可以看出,温度随着垂直高度的增加而增加,且温度梯度逐渐增大;而相对湿度则随着垂直高度的增加而减小。猪舍的温度场均匀性系数为1.29,相对湿度场均匀性系数为1.51,温度场均匀性比湿度场的较好。风机的距离可以影响相对湿度在空间上的分布,距离风机越远,相对湿度变化越大,波动更明显。
3)从速度场的空间分布可以看出,随着垂直高度的增加,风速逐渐减小,且在猪只旁产生一个小的射流,该射流方向指向风机方位,可以看出负压通风的效果较为显著。
本研究对分娩母猪舍进行温湿度场的耦合模拟,得到舍内温湿度场和气流组织的分布规律,对集中通风式猪舍的温湿度场优化具有一定的参考意义。
[1]李伟,李保明,施正香,等. 夏季水冷式猪床的降温效果及其对母猪躺卧行为的影响[J]. 农业工程学报,2011,27(11):242-246. Li Wei, Li Baoming, Shi Zhengxiang, et al. Cooling effect of water-cooled cover on lying behavior of sows in summer[J]. Transactions of the Chinese Society of Agricultural Engineering (Transactions of the CSAE), 2011, 27(11): 242-246. (in Chinese with English abstract)
[2]汪开英,李开泰,李王林娟,等. 保育舍冬季湿热环境与颗粒物CFD模拟研究[J]. 农业机械学报,2017,48(9):270-278.
Wang Kaiying, Li Kaitai, Li Wanglinjuan, et al. CFD simulation of indoor hygrothermal environment and particle matter of weaned pig building[J]. Transactions of the Chinese Society for Agricultural Machinery, 2017, 48(9): 270-278. (in Chinese with English abstract)
[3]Zhao Yunxiang, Liu Xiaohong, Mo Delin, et al. Analysis of reasons for sow culling and seasonal effects on reproductive disorders in southern China[J]. Animal Reproduction Science, 2015, 159: 191-197.
[4]Myer R, Bucklin R. Influence of hot-humid environment on growth performance and reproduction of swine[J]. 2018. http://edis.ifas.ufl.edu/AN107.
[5]Xiong Yan, Meng Qingshi, Gao Jie, et al. Effects of relative humidity on animal health and welfare[J]. Journal of Integrative Agriculture, 2017, 16(8): 1653-1658.
[6]Suriyasomboon A, Lundeheimd N, Kunavongkrit A. Effectof temperature and humidity on sperm production in Durocboars under different housing systems in Thailand[J]. Livestock Production Science, 2004, 89(1): 19-31.
[7]Chiang S H, Hsia L C. The effect of wet pad and forced ventilation house on the reproductive performance of boar[J]. Asian Australasian Journal of Animal Sciences, 2005, 18(1): 96-101.
[8]贺城,牛智有,廖娜. 基于CFX的猪舍纵向与横向通风流场模拟[J]. 华中农业大学学报,2009,28(5):641-644.
He Cheng, Niu Zhiyou, Liao Na. Vertical and horizontal wind field simulation of pigsty based on CFX[J]. Journal of Huazhong Agricultural University, 2009, 28(5): 641-644. (in Chinese with English abstract)
[9]Wang Chaoyuan, Cao Wei, Li Baoming, et al. A fuzzy mathematical method to evaluate the suitability of an evaporative pad cooling system for poultry houses in China[J]. Biosystems Engineering, 2008, 101(3): 370-375.
[10]Xuan Y M, Xiao F, Niu X F, et al. Research and applicationof evaporative cooling in China: A review (I)–research[J]. Renewable and Sustainable Energy Reviews, 2012, 16(5): 3535-3546.
[11]Dağtekin M, Karaca C, Yildiz Y, et al. The effects of air velocity on the performance of pad evaporative cooling systems[J]. African Journal of Agricultural Research, 2011, 6(7): 1813-1822.
[12]Guo H, Dehod W, Agnew J, et al. Daytime odor emission variations from various swinebarns[J]. Transactions of the ASABE, 2007, 50(4): 1365-1372.
[13]Huynh T T T, Aarnink A J A, Gerrits W J J, et al. Thermal behavior of growing pigs in response to high temperature and humidity[J]. Applied Animal Behavior Science, 2005, 91: 1-16.
[14]Morsing S, Zhang G, Strøm J S, et al. Air velocity and temperature distribution in a covered creep for piglets[J]. Transactions of the ASABE, 2004, 47(5): 1747-1755.
[15]Myer R O, Bucklin R A. Influence of rearing environment and season on growth performance of growing finishing pigs[J]. Transactions of the ASABE, 2007, 50(2): 615-620.
[16]Wathes C M, Demmers T G M, Teer N, et al. Production responses of weaned pigs after chronic exposure to airborne dust and ammonia[J]. Animal Science, 2004, 78: 87-97.
[17]Seo I H, Lee I B, Moon O K, et al. Modelling of internal environmental conditions in a full-scale commercial pig house containing animals[J]. Biosystems Engineering, 2012, 111(1): 91-106.
[18]Morsing S, Strøm J S, Zhang G, et al. Scale model experiments to determine the effects of internal airflow and floor design on gaseous emissions from animal houses[J]. Biosystems Engineering, 2008, 99(1): 99-104.
[19]Zhang G, Bjerg B, Svidt K, et al. Measurements of isothermal compact ceiling jets generated by rectangular wall inlets[J]. Biosystems Engineering, 2002, 82(4): 463-468.
[20]Fernando R, Bournet P E, Hassouna M, et al. Modelling heat and mass transfer of a broiler house using computational fluid dynamics[J]. Biosystems Engineering, 2015, 136: 25-38.
[21]Kwon K S, Lee I B, Zhang G Q, et al. Computational fluid dynamics analysis of the thermal distribution of animal occupied zones using the jet-drop-distance concept in a mechanically ventilated broiler house[J]. Biosystems Engineering, 2015, 136: 51-68.
[22]Toma’s N, Jim G, Richard F, et al. Optimising the ventilation configuration of naturally ventilated livestock buildings for improved indoor environmental homogeneity[J]. Building and Environment, 2010, 45: 983-995.
[23]Li R, Peter V N, Bjarne B, et al. Summary of best guidelines and validation of CFD modeling in livestock buildings to ensure prediction quality[J]. Computers and Electronics in Agriculture, 2016, 121: 180-190.
[24]Bjarne B, Giovanni C, Lee I B, et al. Modelling of ammonia emissions from naturally ventilated livestock buildings. Part 3: CFD modelling[J]. Biosystems Engineering, 2013, 116(3): 259-275.
[25]Demmers T G M, Burgess, L R, Phillips V R, et al. Assessment of techniques for measuring the ventilation rate, using an experimental building section[J]. Journal of Agricultural Engineering Research, 2000, 76(1): 71-81.
[26]Seo I H, Lee I B, Moon O K, et al. Improvement of the ventilation system of a naturally ventilated broiler house in the cold season using computational simulations[J]. Biosystems Engineering, 2009, 104(1): 106-117.
[27]林加勇,刘继军,孟庆利,等. 公猪舍夏季温度和流场数值CFD模拟及验证[J]. 农业工程学报,2016,32(23):207—212.
Lin Jiayong, Liu Jijun, Meng Qingli, et al. Numerical CFD simulation and verification of summer indoor temperature and airflow field in boar building[J]. Transactions of the Chinese Society of Agricultural Engineering (Transactions of the CSAE), 2016, 32(23): 207—212. (in Chinese with English abstract)
[28]Sun H, Stowell R R, Keener H M. et al. Two-dimensional computational fluid dynamics modeling of air velocity and ammonia distribution in a high-rise hog building[J]. Transactions of the ASAE. 2002, 45(5): 1559—1568.
[29]Sun H, Keener H, Deng W, et al. Development and validation of 3-D CFD models to simulate airflow and ammonia distribution in a high-rise hog building during summer and winter conditions[J]. Agricultural Engineering International CIGR. 2004, 6.
[30]王小超,陈昭辉,王美芝,等. 冬季猪舍热回收换气系统供暖的数值模拟[J]. 农业工程学报,2011,27(12):227-233. Wang Xiaochao, Chen Zhaohui, Wang Meizhi, et al. Numerical simulation of heat supply for heat recovery ventilation system of piggery in winter[J]. Transactions of the Chinese Society of Agricultural Engineering (Transactions of the CSAE), 2011, 27(12): 227-233. (in Chinese with English Abstract)
[31]谢秋菊,倪既勤,包军,等. 基于能质平衡的密闭猪舍内小气候环境模拟与验证[J]. 农业工程学报,2019,35(10):148-156. Xie Qiuju, Ni Qinging, Bao Jun, et al. Simulation and verification of microclimate environment in closed swine house based on energy and mass balance[J]. Transactions of the Chinese Society of Agricultural Engineering (Transactions of the CSAE), 2019, 35(10): 148-156. (in Chinese with English abstract)
[32]吕恩利,陆华忠,王广海,等. 一种畜禽养殖环境参数多点无线智能监控系统及其方法:CN201910281334.3[P]. 2019-04-09.
[33]吕恩利,陆华忠,王广海,等. 一种环境多源信息感知和预警系统及其方法:CN201910281348.5[P]. 2019-04-09.
[34]谢如鹤,唐海洋,陶文博,等. 基于空载温度场模拟与试验的冷藏车冷板布置方式优选[J].农业工程学报,2017,33(24):290—298.Xie Ruhe, Tang Haiyang, Tao Wenbo, et al. Optimization of cold-plate location in refrigerated vehicles based on simulation and test of no-load temperature field[J]. Transactions of the Chinese Society of Agricultural Engineering (Transactions of the CSAE), 2017, 33(24): 290-298. (in Chinese with English abstract)
[35]谭升魁,王锐,安瑞冬,等. 基于组分输运模型和RNG-模型的浑水异重流数学模型研究及其应用[J].四川大学学报:工程科学版,2011,43(S1):48-53. Tan Shengkui, Wang Rui, An Ruidong, et al. Research and application of numerical model of turbidity currents based on species transport model and RNG-model[J]. Journal of Sichuan University: Engineering Science Edition, 2011, 43(Supp.1): 48-53. (in Chinese with English abstract)
[36]程秀花,毛罕平,倪军. 温室环境作物湿热系统 CFD 模型构建与预测[J]. 农业机械学报,2011,42(2):173-179. Cheng Xiuhua, Mao Hanping, Ni Jun. Numerical prediction and CFD modeling of relative humidity and temperature for greenhouse-crops system[J]. Transactions of the Chinese Society for Agricultural Machinery, 2012, 42(2): 173-179. (in Chinese with English abstract)
[37]刘妍华,曾志雄,郭嘉明,等. 增施CO2气肥对温室流场影响的数值模拟及验证[J]. 农业工程学报,2015,31(12):194-199.
Liu Yanhua, Zeng Zhixiong, Guo Jiaming, et al. Numerical simulation and experimental verification of effect of CO2enrichment on flow field of greenhouse[J]. Transactions of the Chinese Society of Agricultural Engineering (Transactions of the CSAE), 2015, 31(12): 194-199. (in Chinese with English abstract)
[38]Guo Jiaming, Liu Yanhua, Lü Enli. Numerical simulation of temperature decreases in greenhouses with summer water-sprinkling roof[J]. Energies. 2019, 12: 24-35.
[39]Lee I, Sase S, Sung S. Evaluation of CFD accuracy for the ventilation study of a naturally ventilated broiler house[J]. JARQ, 2007, 41(1): 53-64.
Numerical simulation and experimental verification of temperature and humidity in centralized ventilated delivery pigsty
Zeng Zhixiong1, Wei Xinyu1, Lü Enli1, Liu Yanhua2, Yi Ziqi1, Guo Jiaming1※
(1.,510642,; 2.,,510642,)
High requirements for the environment are needed for pigs in the delivery house. This paper aimed to study the distribution of temperature and humidity in a centralized ventilated delivery house by numerical simulation. Tetrahedral non-structural meshes were used for mesh division, and the RNGturbulence model with high precision was used for steady-state simulation. The results showed that the maximum difference between the simulated temperature and the measured temperature was less than 4 ℃, and the relative error was 0.44% to 17.04%, while the average relative error was 6.5%. The maximum difference between simulated humidity and measured humidity is less than 10%, and the relative error was 0 to 13.9%, while the average relative error was 7.3%. The simulated value of temperature was smaller compared with the measured value, while the simulated value of relative humidity was larger than the tested value. It could be seen from the Z cross-section that in the horizontal position of each section, the temperature gradually increased with the increase of height, and the median line of the aisle was taken as the axis of symmetry. The temperature distribution of each longitudinal section presented an obvious symmetry, indicating that the temperature distribution in the dormitory was consistent on both sides of the aisle. The relative humidity of each section decreases gradually with the increase of height. The relative humidity of the air inlet area at the bottom was above 90%. The closer it was to the middle passage, the relative humidity tends to decrease, but the decrease was not obvious. The relative humidity in the passage was above 80%. The wind speed of the longitudinal section in the shed could meet the requirements of the national standards. Even in the position of the inlet with high wind speed, the wind speed was maintained below 0.4 m/s. According to the airflow distribution of the horizontal section and the longitudinal section, there was no airflow dead zone below the height of the pigs in the shed. At the same time, the closer the pig was to the fan, the greater the longitudinal airflow, but the speed of the airflow was below the national standard. In the plane (X cross-section) on both sides of the aisle, the temperature had an obvious distribution gradient in the horizontal height, while in the plane of the aisle, the temperature was evenly distributed in the horizontal height, mainly maintained at 23-24 ℃, and the air outlet temperature was about 24 ℃. Contrary to the temperature distribution law in the X cross-section, the relative humidity in each section gradually decreased with the increase of height, and the distribution range was mainly between 80% and 100%. From the cross-sections on both sides of the corridor, it could be found that there was a small jet beside the pigs, and the jet direction pointed to the fan bearing, indicating that the effect of negative pressure ventilation was significant, which played a strong drag role on the airflow direction in the shed. On the far side of the fan, the influence range of negative pressure exhaust was greater than that on the near side of the fan. Simulated values had a great agreement with experimental values. The study revealed the temperature and humidity distribution of the delivery house and provided a better reference for the optimization of the temperature and humidity distribution of the delivery house.
numerical simulation; piggery; temperature; humidity; distribution characteristics
曾志雄,魏鑫钰,吕恩利,刘妍华,易子骐,郭嘉明. 集中通风式分娩母猪舍温湿度数值模拟与试验验证[J]. 农业工程学报,2020,36(3):210-217.doi:10.11975/j.issn.1002-6819.2020.03.026 http://www.tcsae.org
Zeng Zhixiong, Wei Xinyu, Lü Enli, Liu Yanhua, Yi Ziqi, Guo Jiaming. Numerical simulation and experimental verification of temperature and humidity in centralized ventilated delivery pigsty[J]. Transactions of the Chinese Society of Agricultural Engineering (Transactions of the CSAE), 2020, 36(3): 210-217. (in Chinese with English abstract) doi:10.11975/j.issn.1002-6819.2020.03.026 http://www.tcsae.org
2019-11-27
2020-01-08
国家重点研发计划项目(2018YFD0401305-2);国家自然科学基金项目(31971806和31901736);广东省普通高校青年创新人才项目(自然科学)(2017GkQNCX010);广东省畜禽疫病防治研究重点实验室开放基金(YDWS1904)
曾志雄,博士生,实验师,主要研究方向为畜禽环境调控研究。Email:zhixzeng@scau.edu.cn
郭嘉明,副教授,博士,主要从事设施农业环境调控研究。Email:jmguo@scau.edu.cn
10.11975/j.issn.1002-6819.2020.03.026
S24; S-3
A
1002-6819(2020)-03-0210-08