Effects of Pioglitazone on Renal Mitochondrial calcium and cytochrome C levels in Early Diabetic Nephropathy Rats
2020-04-03QianYongYangYaDianXiongZhongNieGangLiJingZhang
Qian-Yong Yang, Ya-Dian Xiong, Zhong Nie, Gang Li, Jing Zhang
1. Department of Endocrinology,the 908th Hospital of the Joint Logistics Support Force,PLA, Nanchang 330002,Jianxi,China
2. Department of Pharmacy,the 908th Hospital of the Joint Logistics Support Force,PLA, Nanchang 330002,Jianxi,China
Keywords:
ABSTRACT
1. Introduction
Oxidative stress is caused by the accumulation of reactive oxygen species (ROS) diabetes mellitus(DM) and Diabetic nephropathy(DN) is one of the important mechanisms of the occurrence and development [1-2], is the important link in high blood sugar levels induced mitochondrial ROS produced too much, increase oxidative damage, affect kidney structure and function [3-4]. Therefore, it is a new strategy to reduce ROS level and reverse oxidative stress.Previous studies have shown that piogliazone has a renal protective effect independent of hypoglycemia, and has strong antioxidant activity on serum, renal cortex and renal mitochondria of diabetic rats [5-7]. This study compared the levels of mitochondrial Ca2+and Cyt C in DM rats before and after pioglitazone intervention,aiming to study the kidneyprotective mechanism of pioglitazone and explore better methods for DN correction.
2. Materials and methods
2.1 main reagents and instruments
Streptozotocin (STZ, from Sigma, USA); Piogliazone (hangzhou kangenbei pharmaceutical co, LTD, China, national drug approval H20060592), coomasiliang blue reagent (G250, Qingdao jieskang biotechnology co, LTD, China), mitochondrial suspension ultrasonic breaker (rsm-60s, ningbo xinzhike institute), atomic absorption spectrophotometer (aa-6601f, shimazin); Ultraviolet spectrophotometer (Beijing newbit biotechnology co, LTD, China),biological centrifuge (Shanghai lingyi biotechnology co, LTD,China), transmission electron microscope (nissan H800 model),glucose meter (hangzhou aikang biotechnology co, LTD).
2.2 experimental animals and grouping status
72 healthy Wistar rats (215-255g), aged 10-15 weeks, were purchased from Shanghai experimental animal center, Chinese academy of sciences. Production certificate no: SCXK (Shanghai)2019-009; use certificate no: SYXK (Shanghai) 2019-003.According to the random number table method, all the rats were divided into negative control group (NC group), negative control group + pioglitazone intervention group (NCP group), diabetes group (DM group) and diabetes + pioglitazone intervention group(DMP group), with 18 rats in each group.
2.3 Methods
2.3.1 Construction and intervention of DM model
STZ of 55 mg·kg-1was injected into rats, and the blood glucose was higher than 16.7 mmol· L-1after 3 days as the successful standard of DM model construction. The NCP group and DMP group were gavaged with pioglitazone 10 mg·kg-1·d-1, while the NC group and DM group were given corresponding control treatments.
2.3.2 Specimen integration and determination
At the end of the 10th week of the experiment, the metabolic cage was used to integrate urine samples for 24 h, and the urine volume was recorded, then centrifuged, purified and preserved. Urine protein was determined by coomassie blue. The renal mass index was determined by renal mass/body mass.
2.3.3 Morphological observation of rat glomeruli
At the end of the 10th week, the rats were sacrificed, and both kidneys were taken out. The renal tissues were fixed with 10%formalin for 24 hours, and the samples were collected. After dehydration, transparency, wax immersion and other steps, the rats were sectioned and stained with HE and PAS. Morphological changes were observed under the microscope, and the glomerular area, mesangial matrix area and the mean cell count of the glomerulus were measured by the automatic image analysis system analysis module.
2.3.4 Ultrastructure of the kidney was observed by transmission electron microscopy
The removed renal tissue was immediately fixed in 2.55%glutaraldehyde at 4℃ for 4 h, washed in 0.1mol /L PBS, fixed in 1%osmium acid for 2 h, dehydrated in acetone solution in a series of gradients, soaked and embedded with epoxy resin embedding agent.The semi-thin sections were positioned and then ultra-thin sections were made. The results were double-stained with uranium dioxide acetate and lead citrate. Finally, the images of the rats in each group were taken into the medical image processing system to calculate the thickness of basement membrane.
2.3.5 Purification of renal mitochondria and cytoplasm
The rat kidney was used to prepare the tissue suspension, and the supernatant was taken after centrifugation at low speed. After centrifugation at high speed again, the supernatant was separated,and the final supernatant was cytoplasmic component, while the precipitation was mitochondrial component. The precipitation was mixed to produce mitochondrial suspension.
2.3.6 Determination of Ca2+in renal tissue
Mitochondrial Ca2+was determined by flame atomic absorption spectrometry, 2.0ml of the prepared mitochondrial suspension was placed in a reagent bottle, mixed with concentrated nitric acid for digestion for 7d, and then mixed with 2% lanthanum chloride. The concentration of Ca2+was estimated by detecting the absorption value.
2.3.7 Determination of renal CytC
The CytC of cytoplasm and mitochondria was determined by the zhang juntian method [8] : the prepared cytoplasm and mitochondrial suspension were pulverized at high speed to make cytoplasm and mitochondrial samples to be examined. Diluent and nitric acid were added to the sample in turn, and the concentration of CytC was determined by uv spectrophotometry.
2.4 Statistical methods
SPSS25.0 software was used for statistical analysis. The expression of measurement data was mean ± standard deviation (±s). Oneway anova was used for comparison between groups. Pair-wise comparison was continued if there was statistical significance. If the data do not meet the conditions of the analysis of variance,non-parametric test is used. P<0.05 was used as the standard with statistical significance.
3. Results
3.1 Comparison of blood glucose and renal metabolism indexes in each group
The renal metabolism index of DM group was significantly higher than NC group, and the difference between the two groups was statistically significant (P < 0.01). The renal metabolic index of DMP group was significantly lower than that of DM group, and the difference between the two groups was statistically significant (P <0.01). There was no significant difference in blood glucose between DMP group and DM group (P >.05). See table 1 for details.
Table1 comparison of blood glucose and renal metabolism in each group (±s)
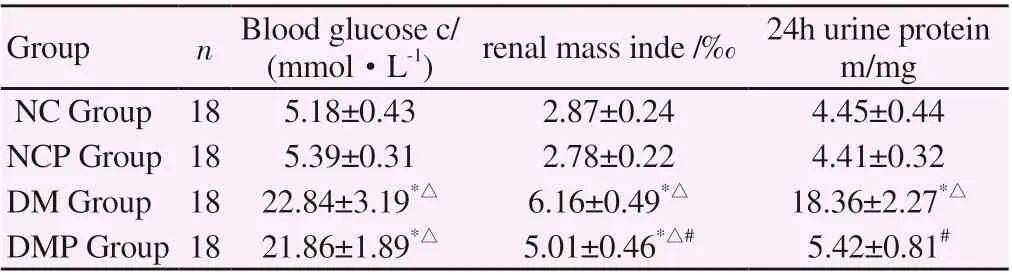
Table1 comparison of blood glucose and renal metabolism in each group (±s)
*P<0.01 was compared with NC group,△P<0.01 was compared with NCP group, #P<0.01 was compared with DM group.
(mmol·L-1) renal mass inde /‰ 24h urine protein m/mg NC Group 18 5.18±0.43 2.87±0.24 4.45±0.44 NCP Group 18 5.39±0.31 2.78±0.22 4.41±0.32 DM Group 18 22.84±3.19*△ 6.16±0.49*△ 18.36±2.27*△DMP Group 18 21.86±1.89*△ 5.01±0.46*△# 5.42±0.81#Group n Blood glucose c/
3.2 Comparison of glomerular morphological indicators in each group
The mean glomerular cross-sectional area, mesangial matrix and mean cell count of the glomeruli in the DM group were significantly higher than those in the NC group (P<0.01). The above lesions in DMP group were improved to different degrees (P<0.05, P<0.01).There was no significant difference between NC group and NCP group (P>.05). See table 2 for details.
Table2 comparison of glomerular morphological indexes in each group (±s)

Table2 comparison of glomerular morphological indexes in each group (±s)
*P<0.01 was compared with NC group,△P<0.05 was compared with NCP group,#P<0.05 was compared with DM group.
Mean total number of cells in glomerulus(number/glomerular cross section)NC Group 18 6.42±0.31 0.27±0.03 73.8±6.19 NCP Group 18 6.48±0.31 0.26±0.02 75.9±4.82 DM Group 18 7.61±0.51*△ 0.36±0.04 *△ 86.6±6.62 *△DMP Group 18 7.28±0.26*△# 0.32±0.04 *△# 81.4±3.28 *△#Group n Mean glomerular cross-sectional area (×103μm2)Mesangial matrix area/glomerular cross-sectional area
3.3 Comparison of glomerular basement membrane thickness in each group
The basement membrane thickness of DM and DMP groups was significantly higher than that of NC group and NCP group(P<0.01). The basilar membrane thickness of DMP group decreased significantly compared with DM group (P<0.01). There was no significant difference in basal membrane thickness between NC group and NCP group (P>0.05) (P). See table 3 for details.
Table3 comparison of glomerular basement membrane thickness in each group (±s)
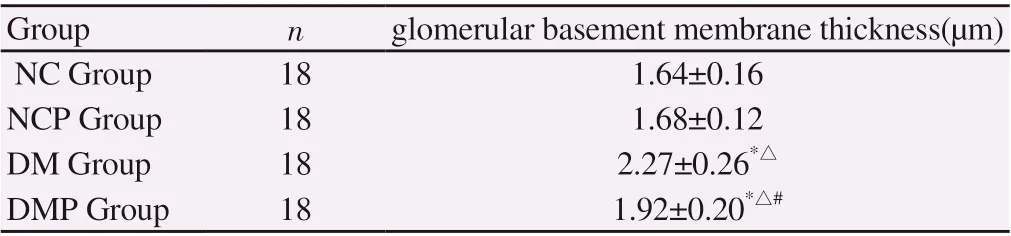
Table3 comparison of glomerular basement membrane thickness in each group (±s)
*P<0.01 was compared with NC group,△P<0.01 was compared with NCP group,#P<0.01 was compared with DM group.
Group n glomerular basement membrane thickness(μm)NC Group 18 1.64±0.16 NCP Group 18 1.68±0.12 DM Group 18 2.27±0.26*△DMP Group 18 1.92±0.20*△#
3.4 Comparison of Ca2+ and CytC in renal tissues in each group
Mitochondrial Ca2+and cytoplasmic CytC in the renal tissues of the DM group were higher than those in the NC group, while mitochondrial CytC was lower than that in the control group. The difference between the two groups was statistically significant (P <0.05). Mitochondrial Ca2+and cytoplasmic CytC in the renal tissues of the DMP group were lower than that of the DM group, while mitochondrial CytC was higher than that of the control group. The difference between the two groups was statistically significant (P <0.05). See table 4 for details.
Table4 comparison of Ca2+ and CytC in renal tissues in each group (±s)

Table4 comparison of Ca2+ and CytC in renal tissues in each group (±s)
*P<0.05 was compared with NC group,△P<0.05 was compared with NCP group,#P<0.05was compared with DM group.
cytoplasm Cyt C (g/L)NC Group 18 2.57±0.07 14.49±1.97 9.61±1.348 NCP Group 18 2.56±0.28 14.67±2.48 9.86±1.87 DM Group 18 3.02±0.37*△ 10.96±2.12*△13.03±2.06*△DMP Group 18 2.57±0.34# 13.86±1.51# 10.64±1.46#Group n Mitochondrial Ca2+ (mg/L)Mitochondrial Cyt C (g/L)
4. Discussion
This study compared the groups of blood sugar, kidney metabolism index, index and ultrastructure of renal glomerular morphology, the results show that the DM group of renal metabolism, glomerular morphology and basement membrane thickness were significantly higher than that of the NC group, two groups are significant difference (P < 0.05 or P < 0.01), the DM group rat glomerular hypertrophy, high filtration and thickening of basement membrane performance, these lesions showed in the early DN [9]. DMP group's kidney metabolism index, glomerular morphology index was lower than that in group DM and basement membrane thickness, two groups are significant difference (P < 0.05 or P < 0.01), suggesting pioglitazone intervention to improve glomerular hypertrophy,high filtration and film thickness at the grass-roots level, reducing urinary protein, delay the progress of DN and protect normal kidney function. And this study glucose numerical difference between DMP and DM group (P > 0.05), the analysis of the reason is that in this study using STZ induced DM rats is similar to the type 1 DM, its an absolute lack of insulin and the mechanism of action of pioglitazone to improve insulin sensitivity, suitable for treatment of insulin resistance of type 2 DM, hypoglycemic invalid model of type 1 DM, so protect renal mechanism of pioglitazone is not originated from direct hypoglycemic effect. Previous studies have shown that oxidative damage in the mitochondria of DN rats is relatively serious, while pioglitazone has positive antioxidant effect, and its kidney-protecting mechanism may be related to the improvement of mitochondrial oxidative damage.
Apoptosis is involved in the occurrence and development of DN. In the early stage of DN, excessive number of apoptotic cells would be detrimental to the maintenance of normal renal function and lead to impaired renal function [10]. Mitochondria store most Ca2+ in cells.ROS may destroy calcium homeostasis, promote cell apoptosis,and thus induce the deterioration of renal function. The possible mechanisms of ROS 'influence on mitochondrial calcium signaling cascade include :(1) abnormal activation of ROS by cells at the beginning of apoptosis, abnormal opening of Ca2+channels, changes in membrane mediated Ca2+permeability, or interference in Na+/Ca2+interaction when the ROS level is too high, and the ultimate effect is to induce excessive Ca2+inflow. (2) the abnormal increase of intracellular Ca2+concentration can further induce the generation of oxygen free radicals, promote the continuous progress of oxidative reaction, and further improve the level of mitochondrial Ca2+. (3)ROS can promote the generation and effect of IP3 receptors, promote the transfer of Ca2+from endoplasmic reticulum to mitochondria,and increase the level of mitochondrial Ca2+. (4) ROS can block the function of Ca2+atpase pump, hinder the external transfer process of mitochondrial Ca2+, and reduce the level of Ca2+in the external mitochondrial site. (5) ROS can promote mitochondrial permeability and promote the development of ROS and the generation of Ca2+.The key stage of Ca2+is to participate in the generation and effect of CytC in the early stage of apoptosis, and its mechanisms include mitochondrial Ca2+overload and Ca2+-mediated enzymes [11]. (6)TRPC6 (Canonical Transient Receptor Potential 6 Channel), a member of the TRPC family of Ca2+conduction channels, is widely expressed in renal cells. There is increasing evidence that TRPC6 is an REDOX sensitive Channel, and regulation of TRPC6 Ca2+signals by changing TRPC6 protein expression or TRPC6 Channel activity is the downstream mechanism of ROS induced renal injury [12].
The destruction of calcium homeostasis and the generation and release of CytC are also important steps to promote apoptosis. Its mechanism includes two pathways: (1) caspase mode: the transfer of CytC to the cytoplasm via mitochondria can induce continuous caspase action and induce apoptosis [13]; (2) non-caspase approach:when mitochondrial Ca2+is overloaded, the coupling protein in the mitochondrial membrane can be used to induce the generation and transfer of CytC and induce apoptosis [14-15].
In this study, the indicators of Ca2+and CytC in renal tissues of each group were compared. The results showed that mitochondrial Ca2+and CytC in renal tissues of the DM group were higher than that of the NC group, while mitochondrial CytC was lower than that of the control group. The difference between the two groups was statistically significant (P < 0.05). Therefore, ROS can cause oxidative damage to the mitochondria of renal tissues, resulting in dysregulation of the normal Ca2+and CytC metabolism in the mitochondria. Excessive Ca2+levels in the mitochondria promote CytC transfer to the cytoplasm, thus accelerating the process of cell apoptosis. In addition, in this study, mitochondrial Ca2+and cytoplasmic CytC in renal tissues in the DMP group were lower than those in the DM group, while mitochondrial CytC was higher than that in the control group, showing a significant difference between the two groups (P < 0.05). It is speculated that piogliazone can effectively improve the status of mitochondrial oxidative damage,ensure Ca2+homeostasis by reversing mitochondrial Ca2+overload,maintain the physiological function of normal respiratory chain,reduce the generation and transfer of mitochondrial CytC, inhibit mitochondrial apoptosis, and finally play a better role in protecting early DN kidney tissues.
杂志排行
Journal of Hainan Medical College的其它文章
- Meta analysis and medication analysis of TCM compound in the treatment of senile osteoporosis
- The Effect of Clinically Used Crystalloid Solution on the Clearance Rate of Lactic Acid in Septic Shock Patients
- Efficacy of intravitreal injection of ranibizumab in the treatment of macular edema secondary to non-ischemic branch retinal vein occlusion
- Efficacy of PC-PRL implantation in the treatment of high myopia and its complications
- Clinical study of warm acupuncture combined with massage in treatment of periathritis of shoulder
- Expression and clinical significance of lncRNA SNHG3 in peripheral blood mononuclear cells of patients with chronic obstructive pulmonary disease