Experimental investigation of thermal transfer coefficient by a simplified energy balance of fault arc in a closed air vessel
2020-03-09MeiLI李美YifeiWU吴益飞PengGONG弓鹏LinLI李林HuadanXU许华丹andFeiYANG杨飞
Mei LI (李美), Yifei WU (吴益飞), Peng GONG (弓鹏), Lin LI (李林),Huadan XU (许华丹) and Fei YANG (杨飞)
1 State Key Laboratory of Eco-Hydraulic in Northwest Arid Region,Xi’an University of Technology,Xi’an 710048, People’s Republic of China
2 State Key Laboratory of Electrical Insulation and Power Equipment, Xi’an Jiaotong University, Xi’an 710049, People’s Republic of China
3 Henan Electric Power Transmission and Transformation Construction Co. Ltd., Zhengzhou 450000,People’s Republic of China
Abstract The thermal transfer coefficient that represents the portion of energy heating the surrounding gas of fault arc is a key parameter in evaluating the pressure effects due to fault arcing in a closed electrical installation. This paper presents experimental research on the thermal transfer coefficient in a closed air vessel for Cu,Fe and Al electrode materials over a current range from 1-20 kA with an electrode gap from 10-50 mm and gas pressure from 0.05-0.4 MPa. With a simplified energy balance including Joule heating,arc radiation,the energies related to electrode melting, vaporization and oxidation constructed, and the influences of different factors on thermal transfer coefficient are studied and evaluated.This quantitative estimation of the energy components confirmed that the pressure rise is closely related to the change in heat transport process of fault arc,particularly in consideration of the evaluation of Joule heating and radiation.Factors such as the electrode material, arc current, filling pressure and gap length between electrodes have a considerable effect on the thermal transfer coefficient and thus, the pressure rise due to the differences in the energy balance of fault arc.
Keywords: fault arc, energy balance, pressure rise
1. Introduction
A closed electrical installation is used to distribute the total system power to multiple load points to meet the electricity demand of the power system and customers. Therefore, the reliability of electrical installations is now becoming a crucial factor in assessing the safety of an electrical system.If a fault arc occurs in a closed electrical installation,a large amount of electrical energy that is released within a few hundred milliseconds will heat up the surrounding gas in the installation.Along with bright arc and sound effects, it causes mainly thermal and pressure stresses,which may endanger personnel,switchgear installations and even the substation building itself.Consequently,it is necessary to investigate the pressure effect of fault arc for the design of electrical installations.
At present, the research on the pressure characteristic of fault arc has been undertaken theoretically and experimentally. Iwata et al [1] used the computational fluid dynamic method to calculate the pressure rise and propagation due to high-current fault arcs in a closed container.Dasbach et al[2]presented a simple calculation of pressure stress from internal arcing in a substation building by using the ray-tracing technique under the assumption of a homogeneous energy input. Friberg et al [3] performed a comparison between the standard calculation method and computational fluid dynamic method to calculate the pressure effects due to arcing fault in electrical installations. Zhang et al [4, 5] combined hydroand thermodynamic equations to evaluate the pressure rise due to fault arc in an electrical installation, in which the fault arc is simplified as a heat source.Experimental work on fault arcs has also been reported recently [6-8]. Pettinga et al [9]studied experimentally the relationship between arc temperature and pressure of fault arc in an MV switchgear filled with air or SF6. Bjørtuft et al [10] tested the influence of the opening time of bursting disks on the pressure characteristics due to fault arcing in a gas-insulated switchgear.Tanaka et al[11] performed measurements to evaluate the pressure rise due to fault arcing under an assumption of a constant radiated energy. Iwata et al [12, 13] presented an experiential and rough assessment of the influence of arc current on pressure rise due to fault arcing based on the existing data of freeburning arcs.
Although the pressure phenomenon of fault arc has been investigated from different aspects,the pressure rise is closely related to the heat transport of fault arc [5, 11, 12], the knowledge of which is rather poor.Furthermore,the pressure phenomenon involves many factors such as the arc current,gas type, shape and so on[4, 6]. However, the existing work mainly concentrates on research of the pressure behavior of fault arc under the condition of a certain single factor and is therefore hard to compare with each other. Thus, these investigations have not resulted in a detailed and comprehensive description on the characteristics of fault arc, since the phenomenon of pressure and energy transfer involves a number of factors.For a general estimation of pressure rise,it would be necessary to study experimentally the influence of various factors on pressure rise and energy balance of fault arc. Therefore, it is important to perform the investigation on the heat transport process and pressure characteristic of fault arc under different influencing factors for the design and optimization of electrical installations.
In this paper,the pressure characteristics of fault arc in a closed air vessel are studied experimentally under different influencing factors. In section 2, the experiment is described and in particular,the estimation on energy balance of fault arc is illustrated. Section 4 gives the measured results of the energy balance and thermal transfer coefficient under the impact of arc current, electrode material, filling pressure and gap length between electrodes.Finally,a conclusion is drawn.
2. The experiment setup and method
2.1. Experimental setup
A simplified fault-arcing vessel based on 252 kV gas-insulated switchgear is designed, as shown in figure 1. The arc is ignited by fusing copper wire 0.2 mm in diameter in the center of the vessel. The arcing duration is 0.1 s. The gas inside is air with filling pressure varying from 0.05-0.4 MPa absolute. The electrodes 20 mm in diameter are arranged symmetrically. The electrode materials investigated are copper,iron and aluminum.The gap length between electrodes is adjusted in the range of 10-50 mm. The arc current ranges from DC 1-20 kA.
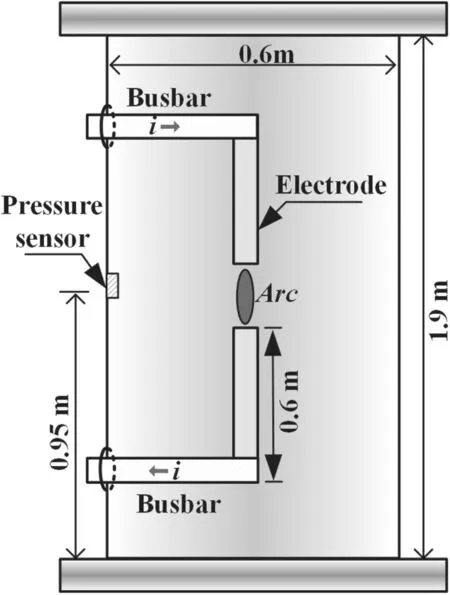
Figure 1.Schematic diagram of the arcing vessel for the investigation of fault arc.
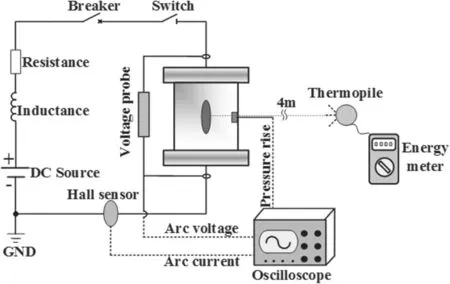
Figure 2.Schematic diagram of the experimental arrangement.
2.2. Experimental method
Figure 2 shows the schematic diagram of the experimental arrangement.A short-circuit generator(DC 2 kV,22.5 MVA)in our laboratory is used as the power supply. The testing voltage is 1.5 kV. The arcing duration is controlled by the circuit breaker. A piezoelectric pressure sensor (PCB 102B16)is installed at the inner wall of the vessel to measure pressure rise.A thermopile(Ophir 12A)is placed at a distance of 4 m away from the core arc in order to detect absolute arcradiated energy through a quartz-glass observation window.Such a long distance ensures the radiation is treated as a point light source. The energy meter connects with the thermopile and is responsible for the data display.The arc voltage and arc current are measured by high-voltage probe and Hall sensor,respectively.

Figure 3.Energy balance of fault arc in an electrical installation.
2.3. Estimation of energy balance
When fault arc happens in closed electrical installations, a large amount of energy is released to the surroundings via different interaction mechanisms, as shown in figure 3. The injected Joule heating Weland the produced chemical energy Wchemfrom reactions between the electrode vapor and surrounding gas are balanced by arc radiation Wrad, energy for electrode melting and vaporization Wmv, gas conduction Wcond, convection Wconvand the gas internal energy devoted to pressure rise Wp. Thus, the energy balance between the input and output energy can be expressed as,

In order to understand the heat transport process in fault arc, it is necessary to estimate all of the energy terms in equation(1).The Joule heating is obtained via measuring the arc voltage and current. The arc radiation is measured by thermopile. Considering that there is no pressure relief in the designed closed vessel, the gas conduction and convection outwards are not included in the energy balance.For the other two energy terms in the energy balance, the estimation is described below.
For the electrode melting and vaporization energy, it mainly contains the following three parts.The first part is the energy used for the melting of the part of the electrodes that was melted but still remains on the electrode surface. The testing in [11] shows that a variation in thickness of the melted layer within±1 mm results in a rather small variation of energy rate,which has no considerable effect on the energy consumption. Thus, a melted layer of 1 mm thickness is assumed to estimate the first part of the energy. The second part is the energy used for the melting of the ejected solid particles that were not vaporized and correspond to the weight of the remaining solid particles from the electrodes.After one test, the ejected solid particles will drop to the bottom of the vessel.In order to estimate the second part of the energy,only relatively large particles were collected as fully as possible,by sifting with a sieve with a mesh size of 0.2 mm, and then weighed.The third part is the energy used for the vaporization of the vaporized part of the electrodes that corresponds to the weight of the vaporization of the electrodes.This weight was calculated by subtracting the weight of the ejected solid particles from the electrode loss.

Figure 4.Oxides and diffraction pattern for Cu electrodes.
In order to estimate the above-mentioned three parts of the energy, the energy per unit weight required by the electrode melting or vaporization was calculated first[14].Based on this data, the energy required by the electrode melting is the weight of the melted part(the sum of the melted layer of 1 mm thickness and remaining solid particles)multiplied by the energy per unit weight for the electrode melting. The energy required for the electrode vaporization is the weight of the vaporized part multiplied by the energy per unit weight for the electrode vaporization.
Regarding the energy produced by the chemical reaction between the gas and electrode vapor, an x-ray diffractometer is first used to identify the oxides in the ejected solid particles.The oxides and their diffraction pattern are typically shown in the case of the Cu electrodes in figure 4. Then, the reactions involving Cu vapor can be found at NIST [15]. Table 1 provides the oxides and corresponding chemical reactions with various electrode materials. The energy produced from oxidation reactions is calculated as the chemical energy per mole in each reaction multiplied by the mole number of the vapor.
3. Experimental results and analysis
3.1. Typical waveforms
Figure 5 shows the measured results of the arc current,voltage and pressure in a typical case with Cu electrodes at the peak current of 10 kA. At the beginning, the voltage increases abruptly until its ignition peak, due to the rapid fusion of copper wire. Afterwards, the arc burns steadily and the voltage tends to be stable. Also, the current increases rapidly and the peak value is reached at around 15 ms.As the electrical energy is injected continuously, the arc expands outwards rapidly. Meanwhile, the electrical energy is transmitted to the surroundings via radiation, convection, conduction and heating of the gas.The heating of the gas causes a further increase in gas internal energy and then leads to a risein pressure. From 85 ms, the current begins to fall until it eventually reaches zero. And at the same time, the arc is quenched with the peak pressure.

Table 1.Oxides in ejected particles and corresponding chemical reactions.
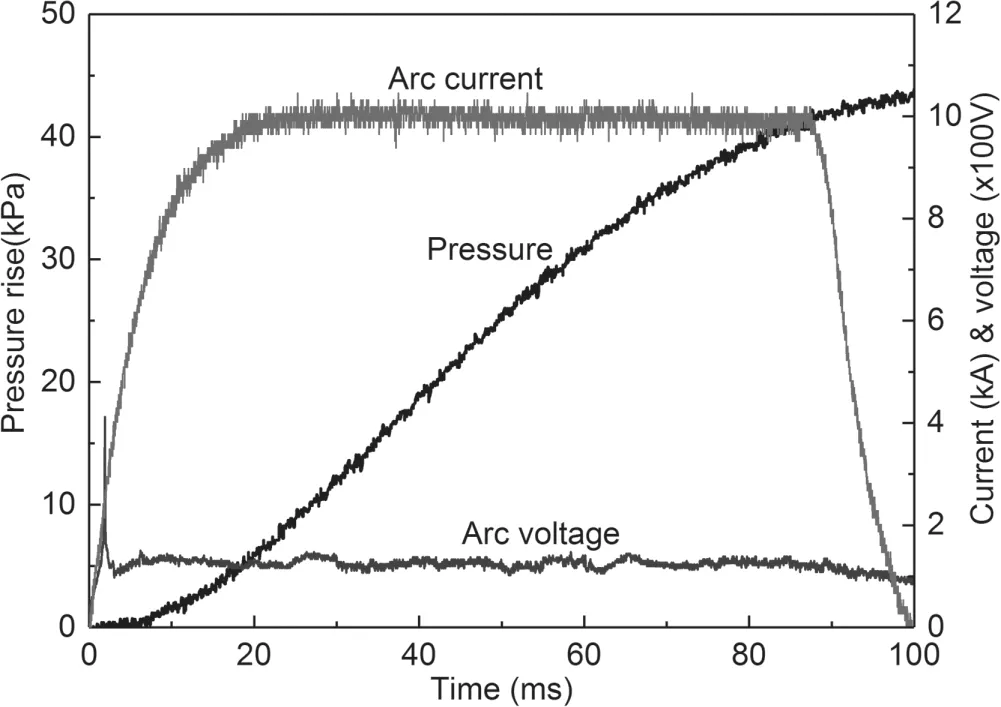
Figure 5.Arc current,voltage and pressure in a typical case with Cu electrodes.
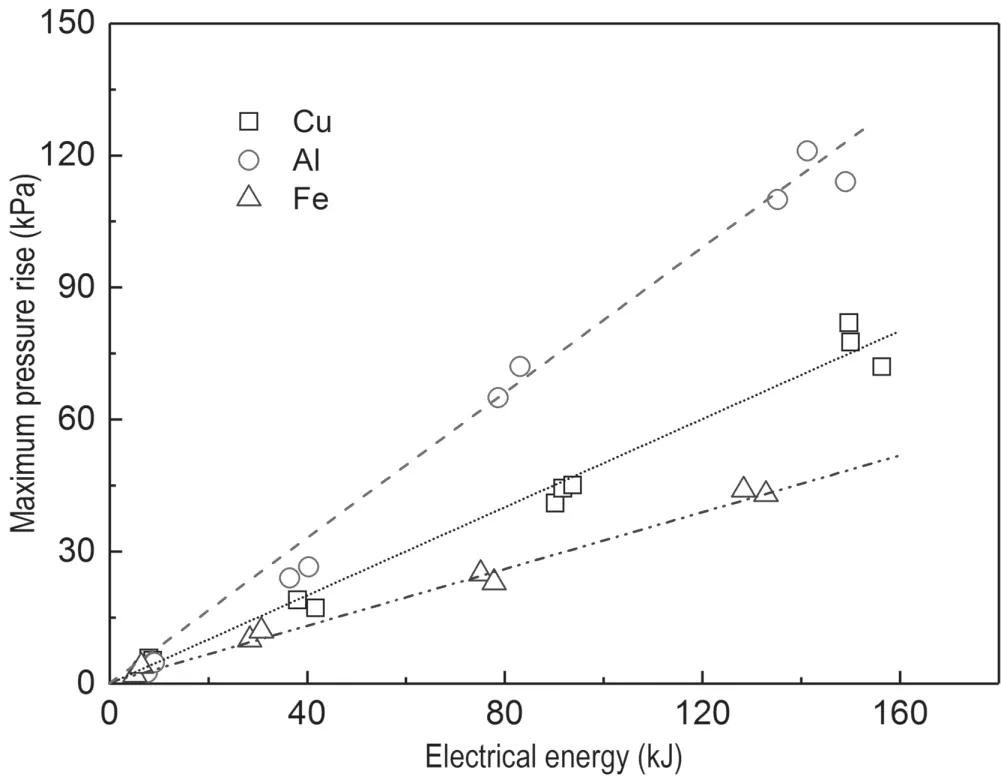
Figure 6.Dependence of pressure peak on arc energy.
Figure 6 shows the maximum pressure rise versus electrical energy for different electrode materials. For each material, the rise to maximum pressure tends to occur with the increase in electrical energy. In particular, the pressure is highest for Al electrodes at the same arc energy, followed by Cu and Fe.At relatively low arc energy,a small difference in pressure is found among the three electrode materials. However, when the arc energy increases to about 90 kJ, the maximum pressures for Al, Cu and Fe are approximately in the ratio of 3:2:1. In particular, for Al electrodes, the maximum pressure rises sharply with the increment in current.This is mainly attributed to the dominant role of the chemical energy produced by oxidation reactions with Al vapor in the energy balance, which is shown in figure 7.

Figure 7.Measured energy balance at low and high currents (the mark of each energy term is identical to equation (1)).
3.2. Energy balance of fault arc
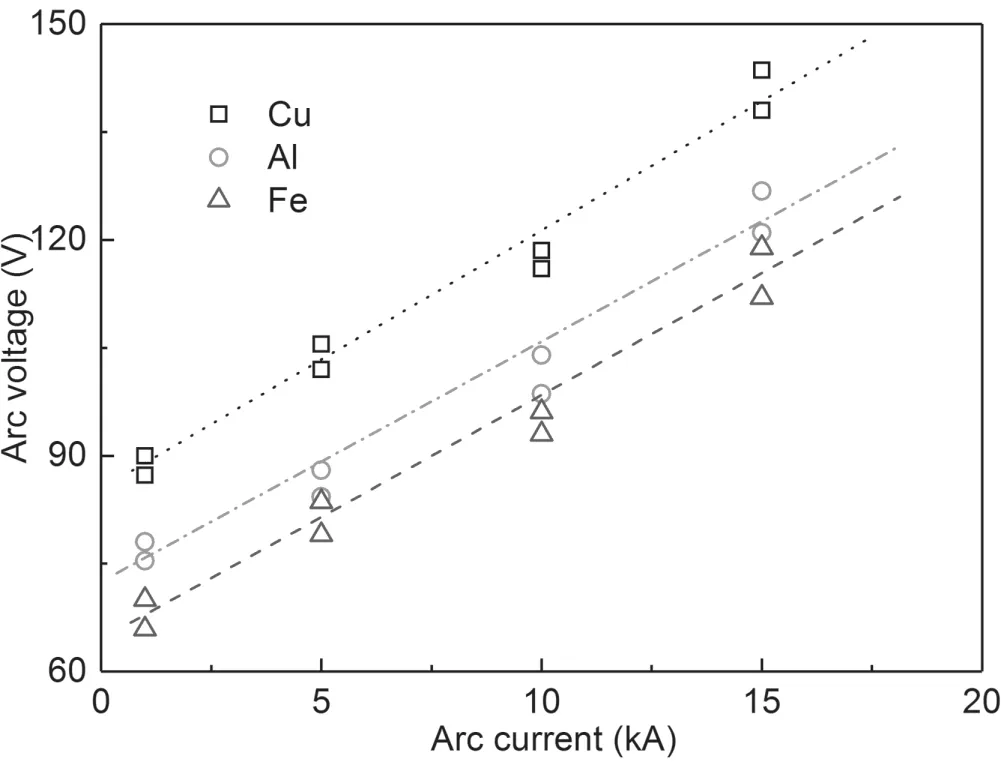
Figure 8.Measured average arc voltage versus arc current with a gap length of 30 mm for different electrode materials.
The energy balance of fault arc is estimated and shown in figure 7. When the current is low, the electrode erosion is weak for the three electrode materials. This indicates that the energy involving the electrode vaporization and chemical reaction is small. Consequently, the injected arc energy is mainly consumed by arc radiation and gas internal energy.The weak deviation of the gas internal energy among the three materials finally results in their almost identical pressure rises, as shown in figure 6. At high currents, the energies related to the electrode melting, vaporization and chemical reactions all increase to a certain extent. When Fe electrodes are used,the radiation emission from arc dominates in energy consumption and exceeds significantly those of Cu and Al,which causes its smallest gas internal energy. This also explains the lowest pressure rise for Fe electrodes, as can be seen in figure 6. In the case of Al, it involves the highest chemical energy with Al vapor because of its largest vaporization of electrodes.This then leads to the largest gas internal energy and pressure rise.
3.3. Electrical energy and radiation
The energy transport process of fault arc in figure 3 indicates that the Joule heating and radiation are two critical energy transport processes. Thus, the Joule heating and arc radiation are focused on in this part. The arc voltage was measured while varying the arc current in the range of 1-20 kA.Figure 8 presents the measured average arc voltage versus current with a gap length of 30 mm for various electrode materials. It shows a linear rise in arc voltage with current.This means that the increment in electrical energy versus current is also linear. Obviously, the voltage is highest when Cu electrodes are used, while for Fe it is lowest. At 10 kA current,the arc voltage for Cu is approximately 12.5 and 23.4 V higher than the Al and Fe electrodes, respectively.
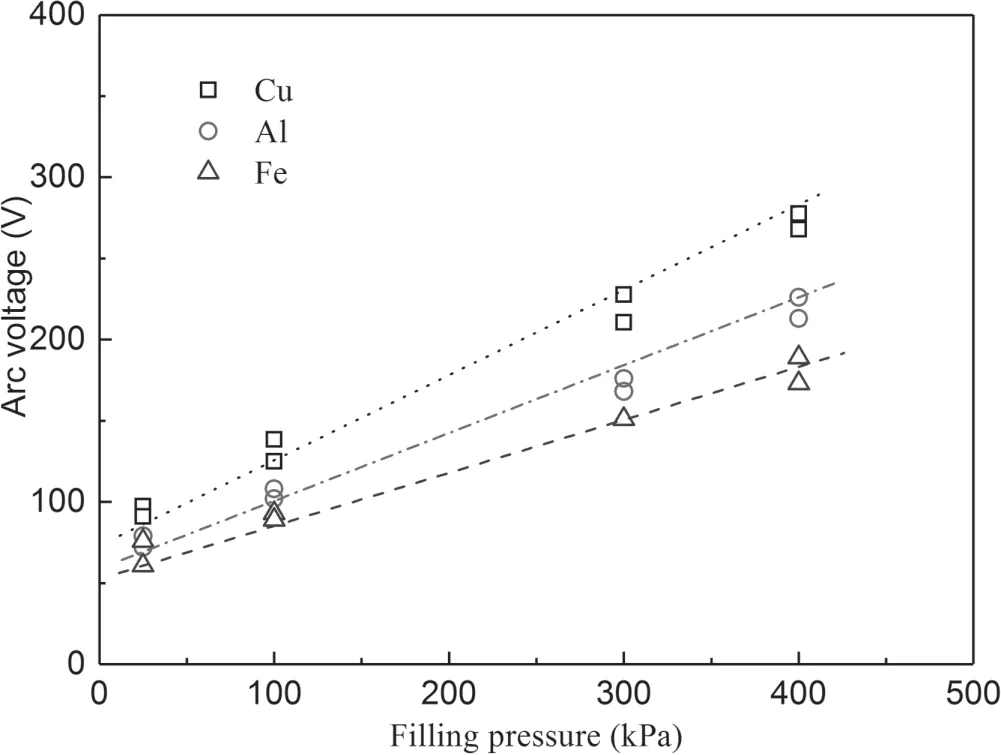
Figure 9.Relationship between arc voltage and filling pressure at 10 kA current with a gap length of 30 mm.
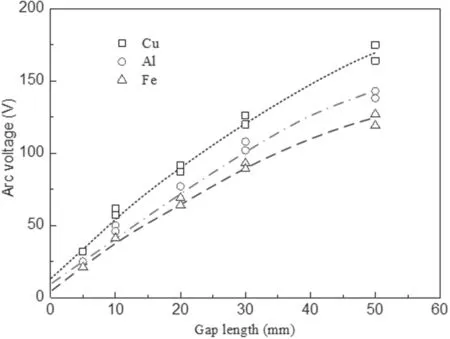
Figure 10.Dependence of arc voltage on gap length at 10 kA current with a filling pressure of 0.1 MPa.
The relationship between the arc voltage and filling pressure is presented at 10 kA current with a gap length of 30 mm in figure 9. The arc voltage versus filling pressure (gas density)exhibits a straight line. This is because the increment in gas density results in more particles being present between the ionized electrodes,resulting in a rise in arc voltage.The gradient of the line is 0.45,0.31 and 0.38 V kPa−1in the case of the Cu,Fe and Al electrodes,respectively.While the filling pressure rises from 0.1 to 0.4 MPa, the arc voltage increases 2.12, 1.98 and 2.08 times,respectively,in the case of Cu,Fe and Al.This means that at the same current,the electrical arc energy increases fastest with the fliling pressure in the case of Cu electrodes, while its increase is slowest when Fe electrodes are used.Figure 10 shows the dependence of arc voltage on gap length.These voltages were obtained at 10 kA current with a fliling pressure of 0.1 MPa.Obviously,the arc voltage gradually rises with gap length.When the gap length is less than 30 mm, the voltage increases almost linearly. However, the growth slows down when the gap length exceeds 30 mm. In the case of Cu, as the gap length increases from 5 to 50 mm,the arc voltage increases from 32 to 169 V.It can be deduced that the rate of increase of the gap length far exceeds the increase rate of the arc voltage, thus causing a reduction in the arc voltage per unit length.

Figure 11.Radiation energy with a gap length of 30 mm and filling pressure of 0.1 MPa as a function of arc current.

Figure 12.Radiation energy as a function of filling pressure for 10 kA current with a gap length of 30 mm.
In a similar way,the arc-radiated energy was also measured,while varying the arc current, filling pressures and gap lengths.Figure 11 presents the measured arc radiation as a function of arc current.The radiation increases markedly with current for the same electrode material. In the case of Cu, Al and Fe, the radiation increases 6.23,5.13 and 4.36 times,respectively,as the current rises from 5 to 15 kA.This means the arc radiation has stronger dependence on current and also, the growth rate of radiation energy far exceeds the increasing rate of arc current.
Figure 12 shows the radiation energy as a function of filling pressure at 10 kA with a gap length of 30 mm.The arc has higher radiation as the filling pressure increases. In the case of Cu, Al and Fe, the radiation grows from 32.2, 34.3 and 48.4 kJ to 52.4, 58.4 and 75.5 kJ, respectively, as the pressure increases from 0.1 to 0.4 MPa. This indicates a slower growth in arc radiation with the pressure. Figure 13 presents the measured arc radiation versus gap length for 10 kA current at 0.1 MPa. As can be seen, the arc radiation increases gradually with the increment in gap length,whereas it exhibits a slower growth rate. In particular, the radiation grows almost linearly when the gap length is less than 30 mm and the increase rate of radiation reduces significantly at the gap length longer than 30 mm.
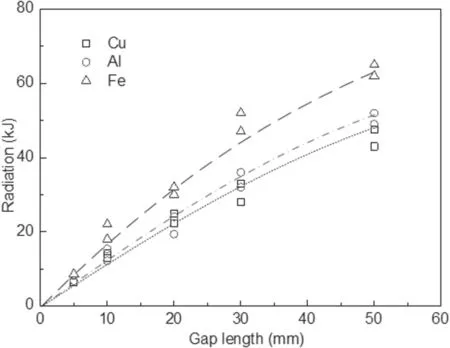
Figure 13.Arc radiation versus gap length for 10 kA current at 0.1 MPa.
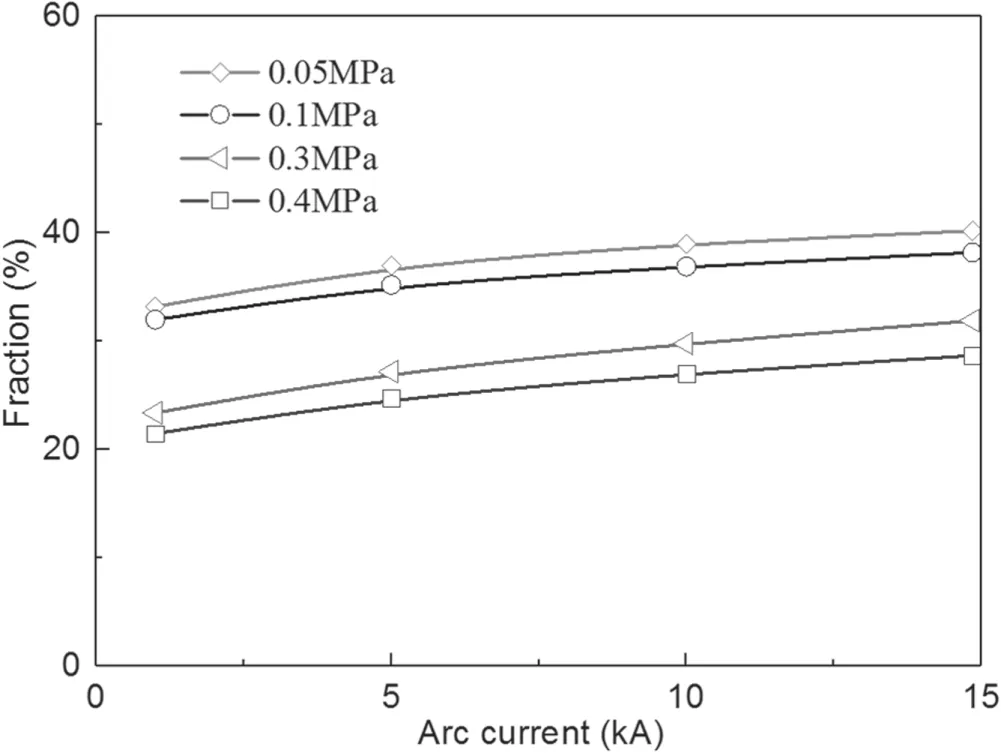
Figure 14.Fraction of arc radiation to injected electrical energy versus current for various filling pressures.
The radiation energy represents the fraction of electrical energy injected into the arc column. It is significant to determine this fraction via the measurement of radiation energy, arc current and voltage. The fraction of radiated energy to injected electrical arc energy versus arc current is indicated in figure 14 for various filling pressures. The radiation energy at 0.05 MPa takes up approximately 35% of the injected electrical energy over the wide current range investigated. The fraction decreases with the increment in filling pressure.For example,the fraction decreases from 38%to around 26%for 10 kA current with the pressure increment from 0.05 to 0.4 MPa.This is because,although the rise in the filling pressure causes the growth in both arc voltage and radiation according to figures 9 and 12,the rise rate of the arc voltage exceeds markedly that of the arc radiation. Thus, a faster rise in Joule heating with filling pressure results in a reduction in the fraction. In addition to this, the fraction fluctuates within a small range as the current increases for the same pressure. For instance, the radiation takes up approximately 30%-40%of Joule heating for 0.1 MPa,while varying the arc current from 1-15 kA.

Figure 15.Fraction of arc radiation to injected electrical energy as a function of gas length at 0.1 MPa and 10 kA for different electrode materials.
Figure 15 shows the fraction of arc radiation versus gap length at 0.1 MPa and 10 kA for different electrode materials.As shown in figures 10 and 13, both the Joule heating and radiation grow as the gap length increases. Yet, it is obvious that the radiation increases faster. As a result, the fraction tends to rise as the gap length increases.At longer gap length,the fraction grows more slowly. This indicates that an equilibrium between radiation and Joule heating is prone to be reached at long arc.
3.4.Influence of different factors on thermal transfer coefficient
In order to assess the pressure effect due to fault arcing in a closed vessel, the thermal transfer coefficient kpis a key parameter and has gained increasing attention. It represents the portion of gas internal energy Wpto electrical arc energy Wel. In general, kpis not constant, but varies with the arc current, electrode material, arc energy and so on. According to the standard calculation method, kpcan be expressed by [3, 4],

where dp is the pressure rise,V the volume of gas space,M the molar mass of gas,Cvthe specific heat at constant volume and R the molar gas constant.
3.4.1. Arc current. Figures 16 and 17 show the dependence of kpon arc current and electrical energy at 0.1 MPa with a gap length of 30 mm,respectively.It is found that kpis always higher under the condition of Cu and Al than that of Fe. This mainly arises from the arc radiation occupying a relatively higher ratio in energy dissipation when Fe electrodes are used, as illustrated in figure 7. In addition to this, kpdecreases somewhat as the arc current and electrical energy increase in the case of Cu and Fe.This is attributed to the increase in current causing a slight growing fraction of arc radiation to input Joule heating,as can be seen in figure 14. Furthermore, the electrode erosion becomes more severe and the consumption of electrode melting and vaporization energy exceeds the release of chemical energy from the vapor oxidation reactions. However, when Al electrodes are used, the growth in the released chemical energy involving Al vapor reactions outweighs the dissipation of the electrode melting and vaporization energy. Thus, a reverse tend in kpappears.

Figure 16.Dependence of kp on arc current.

Figure 17.Dependence of kp on electrical arc energy.
3.4.2. Filling pressure. Figure 18 shows kpversus filling pressure at 10 kA current with a gap length of 30 mm for various electrode materials. Obviously, little difference in kpmeasured for the same electrode material was found at relatively high pressure(>100 kPa),whereas kpvaries greatly at rather low pressure (<100 kPa). This phenomenon is mainly due to the growing importance of radiation at high pressure and the dominant role of the energy related to electrode erosion at low pressure.
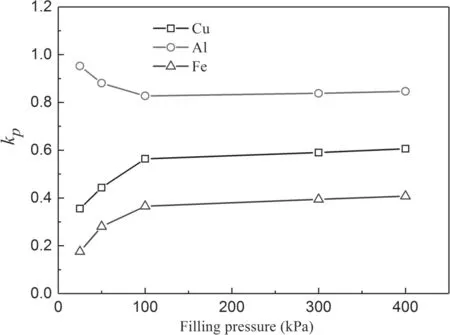
Figure 18.kp as a function of filling pressure at 10 kA current with a gap length of 30 mm for various electrode materials.
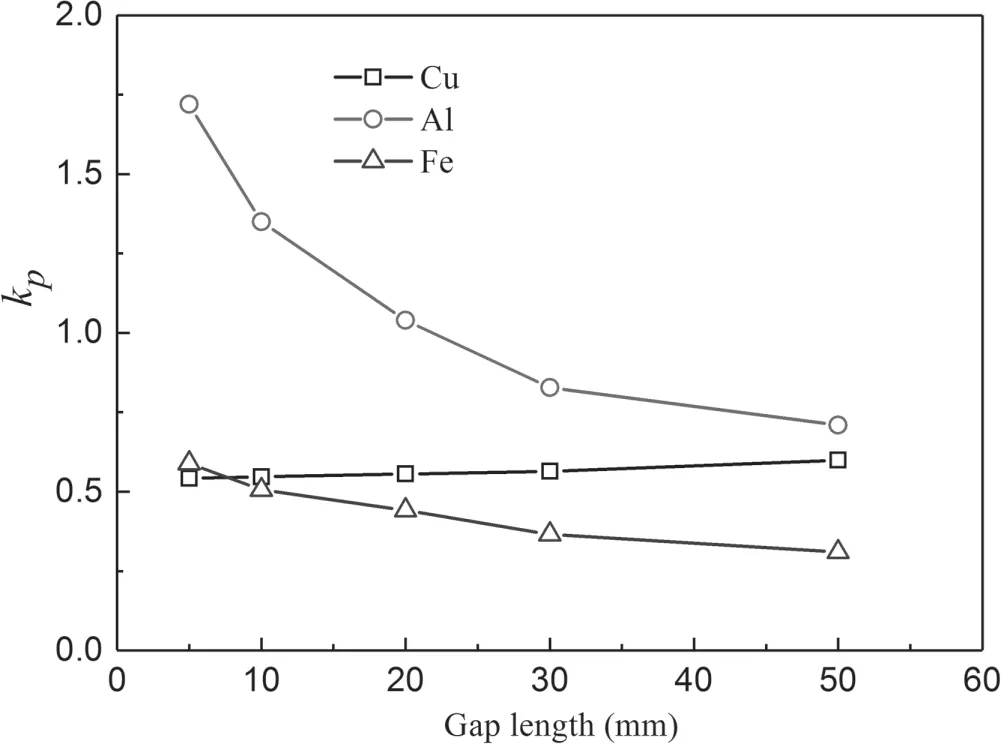
Figure 19.Dependence of kp on gap length.
At small filling pressure below 100 kPa,the surrounding gas could be heated up to higher temperature if the same arc energy is injected. In the case of Cu and Fe electrodes, the electrode melting and vaporization energy increases more than the released chemical energy with vapor as the pressure decreases. Together with the consideration of the rising fraction of radiation to the Joule heating given in figure 14,their kpdecreases with declining filling pressure. In contrast,kprises with declining pressure for Al electrodes.This can be explained by the fact that the chemical energy released with Al vapor reactions plays a more dominant role than the electrode melting and vaporization energy. At high filling pressure above 100 kPa, the radiation dominates in energy dissipation.Consequently,the growing fraction of radiation in figure 14 leads to kpdecreasing slightly with declining density for different electrode materials.
3.4.3. Gap length. Figure 19 shows the dependence of kpon gap length at 10 kA with filling pressure of 0.1 MPa for different electrode materials.The decrease in gap length results in a more concentrated arc energy and more severe erosion on the electrodes. In this case, the electrode melting and vaporization energy as well as the chemical energy involving vapor become more important.For Cu electrodes,as the gap length decreases,the electrode melting and vaporization energy increases more than the released chemical energy with Cu vapor whereas at the same time,the fraction of radiation to the Joule heating happens to decrease.Under the common effects of these two phenomena,a slight reduction trend in kpwas measured.When Fe electrodes are used, the energy required for the electrode melting and vaporization is almost equivalent to the released chemical energy with Fe vapor. Yet, since the fraction of radiation to Joule heating rises with the increasing gap length, as can be seen in figure 15, kptends to decrease as the gap length increases. In particular,when the gap length is less than 10 mm,kpin the case of Fe gradually exceeds that of Cu. This is mainly due to the higher chemical energy with Fe vapor than that with Cu.In the case of Al,kphas a stronger dependence on gap length. As the gap length decreases,the chemical energy involved in Al vapor plays a more dominant role in the energy balance.Furthermore,with the decreasing fraction of radiation to Joule heating in figure 15, kpincreases sharply with the declining gap length.
4. Conclusions
A simplified energy balance by Joule heating,arc radiation,the energy for electrode melting and vaporization as well as chemical energy with eroded metal vapor is constructed to investigate the pressure effects of fault arc in a closed air vessel.The thermal transfer coefficient was investigated for different electrode materials over a wide current range from 1-20 kA with a gap length between electrodes of 10-50 mm at gas pressures of 0.05-0.4 MPa. The measurement result for the air fault arc reveals the pressure rise is closely related to changes in energy balance. Also, the developments of pressure and its corresponding thermal transfer coefficient considerably depend on the electrode material, arc current, filling pressure and gap length,which, in turn, affects the energy balance.
Acknowledgments
This work was supported in part by National Natural Science Foundation of China (Grant Nos. 51707145,51807162, 51577144), Shaanxi province key R&D program 2019ZDLGY18-05, the China Postdoctoral Science Foundation (Grant Nos. 2016M600792, 2018M641007)and was selected from the 1st International Symposium on Insulation and Discharge Computation for Power Equipment.
猜你喜欢
杂志排行
Plasma Science and Technology的其它文章
- Analysis of the characteristics of the plasma of an RF driven ion source for a neutral beam injector
- Synthesis of vertical graphene nanowalls by cracking n-dodecane using RF inductivelycoupled plasma-enhanced chemical vapor deposition
- Application of persulfate in low-temperature atmospheric-pressure plasma jet for enhanced treatment of onychomycosis
- Magnetic field enhanced radio frequency ion source and its application for Siincorporation diamond-like carbon film preparation
- Microwave frequency downshift in the timevarying collision plasma
- Comparison of Reynolds average Navier-Stokes turbulence models in numerical simulations of the DC arc plasma torch
