锂离子电池开路电压曲线形状与多阶段容量损失
2019-12-11张剑波
葛 昊,李 哲,2,张剑波,2
(1清华大学汽车安全与节能国家重点实验室,北京 100084;2北京理工大学北京电动车辆协同创新中心,北京 100081)
It would be superfluous to emphasize the importance of lithium-ion battery aging any more.Intensified efforts have been emerging worldwide including deciphering aging mechanisms via in-situ and ex-situ diagnostic methods[1-4], scrutinizing aging main factors during battery operation by extensive experiment matrixes[5-6], predicting aging states based on a wide spectrum of models[7-8], and improving aging performance with strategies spanning from material screening[9]to system controlling[10].
Regarding the aging behavior, an intriguing phenomenon is that an abrupt drop of capacity,following a gradual degradation, commences at a state of health (SOH)iroughly around 80%, as delineated in Fig.1(a).The abrupt drop capacity is also termed as rapid rollover capacity loss[9]or nonlinear aging[11],leading to the multi-stage capacity loss with cell aging.It is important to note that usually two kinds of capacity are reported in aging studies: ① the capacity recorded when the cells are aged according to a certain aging protocol; ②the capacity measured in a reference performance test when the cell is taken out of the aging process.In the former case, the cell is usually subject to a higher current rate to accelerate the aging process, while in the latter case a relatively small current rate, say 1/25 C or 1/10 C, is used to obtain the thermodynamic capacity.When talking about the inflexion point, we here refer to the former case, which is more relevant to the real applications.
This broadly multi-stage aging mode with an inflexion point in between has been reported in a multitude of battery chemistries: LCO-graphite[1],LFP-graphite[12-13], NCA-graphite[5], NMC-graphite[4,6,9,11], LMO/NMC-graphite[14], and NMCLTO[15].Understanding the mechanism of such an abrupt capacity loss and predicting the inflexion point are crucial as far as the replacement and reuse of aged batteries are considered[11].
Some previous studies attribute this phenomenon to lithium-plating[1,11,13,16]or electrolyte-drying[17].In our opinion, these may not adequately explain the occurrence of abrupt capacity loss: ① the case of LTO anode, in which the anode potential is around 1.5 V (νs.Li+/Li) and lithium-plating is kinetically unfavorable, defies the necessity of an elucidation invoking lithium-plating; ②the frequent emergence can hardly be understood by electrolyte-drying with a relatively low-probability, especially in the cells with abundant electrolyte.Meanwhile, till now, rare attempts have been made to quantitatively predict the inflexion point.
In this work, we propose another interpretation that such an abrupt drop in capacity could be an intrinsic nature of batteries with a varying-slope open-circuit-voltage (OCV) curve and increasing internal resistance during aging.To this end, we put forward a general theory of inflexion point for battery aging.Being general means that this theory is not limited to a particular aging mechanism or a specified battery chemistry.On the contrary, major aging mechanisms and battery chemistries can be incorporated into the framework of this theory.We first demonstrate our basic idea using a simple example in section 2, and then generalize our treatment in section 3.Section 4 concludes the findings.

Fig.1 (a) Relative capacity as a function of cycle number during battery aging.Aging test protocols are: (i) LFP/Graphite:constant current (CC)-constant voltage (CV) cycling with a current of 3.75C between 2.0 and 3.6 V with a cut-off current of 0.57 A at 25[13]; (ii) NMC/Graphite: 1C CC charge followed by CV step at 4.2 V until a current of 100 mA was reached and 1C CC discharge to 2.5 V at 30[9]; (iii) NMC/LTO: the charge rate is set as 3C and the discharge rate is set as 2C.The cells are charged to 2.7 V, rested for 20 min and discharged to 1.5 V at 50[15].(b) The pseudo-OCV (ps-OCV) curves of (i) LFP/Graphitei; (ii) NMC/Graphite[18]; (iii) NMC/LTO[19]
1 A two-stage example
As an introductory example, we describe the battery using ensemble parameters without interelectrode separations.Despite of all kinds of aging mechanisms, we simplify the aging behavior as the change of discharging curves originating from the OCV curves and internal resistances.The model assumptions and specifications are as follows.
(1)The OCV of the battery is assumed to be composed of two lines with different slopes,as displayed by the uppermost curve in Fig 2(a).Albeit being oversimplified, such two-slope feature is frequently seen in the pseudo-OCV1(ps-OCV)curves of batteries, see Fig.1(b).

whereV0is the intercept of the ps-OCV curve.k1andk2,k2>k1>0, are the magnitude of slopes in high voltage and low voltage regions, respectively.The SOC is denoted asxandx1represents the turning point connecting the two lines.h(x) is the Heaviside step function.
(2)The ps-OCV curve is assumed to be unchanged during aging, while the internal resistance increases, due to, for example, thickening of the solid/electrolyte interphase (SEI) film.It has not escaped our notice that the ps-OCV curve would slip and shrink during aging, such an effect is to be considered in a refined model in the subsequent part of this section.The resistance growth is described as,

whereRis the cell resistance during aging,R0is the initial resistance,tthe cycle number, andαthe growth factor which is positive.Such an expression neglects the resistance dependence on SOC, which is to be took into account later.An increasing profile withα= 0.5 is frequently seen, which can be rationalized assuming the SEI growth is diffusion limited[20].
(3)The cell aging test adopts the CC-CV protocol.The cell is fully charged to a SOC of 100%and then is subject to discharge at a current ofI.The discharge process is terminated when the cell voltage reaches the lower bound ofVlb,
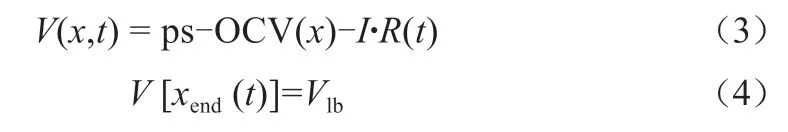
whereVis the cell voltage, andxendreflects the cell SOC when the discharge process is terminated.
We feed this model with the parameters in Table 1.It is worth noting that this model parametrization was made without any attempt to emulate any particular battery chemistry, just for the demonstration of our ideas, instead.The cell voltageνs.SOC curves,exhibited in Fig.2(a), sink along with aging due to the increasing internal resistance as shown in Fig.2(b).The profile of capacity retention ratio calculated from Eq.(3) and Eq.(4) with respect to cycle number is given in Fig.2(c).Clearly, a two-stage aging behavior manifests.Note in passing that the abrupt capacity loss in the second stage is obtained here when the only aging factor is the gradually increasing resistance due to the SEI film growth.
By this point, we see that lithium-plating or electrolyte-drying is not necessarily needed to produce a two-stage aging behavior.For the case examined here, the inflexion point has its root in the two-slope nature of the OCV curve, concomitant with an increasing resistance profile.The resistanceincreasing does not show different stages, while the multi-stage capacity loss results from the multi-slope OCV curves.One can find that, the inflexion point,80% SOH, is exactly the turning point in terms of depth of discharge (DOD) at which the OCV slope translates fromk1tok2.In addition, the stage 1 in the capacity retention curve in Fig.2(c) is corresponding to slope 2 in the OCV curve, while stage 2 is associated with slope 1.
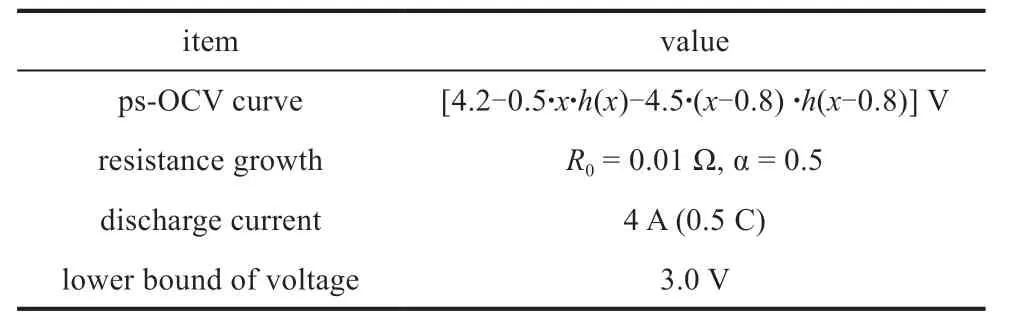
Table1 Parameters for the two-stage example

Fig.2 (a) Evolution of cell discharging voltage curves during cycling.The red line represents the lower bound of cutoff voltage.(b) The growth of internal resistance with battery aging.(c) Capacity retention ratio as a function of cycle number, displaying a two- stage aging behavior.
From the aspect of thermodynamics, slippage of the OCV curve originating from loss of active material and loss of lithium inventory[2-3]can also be incorporated in the above model by reformulating Eq.(1) as,

whereS(t) represents the slippage.
In this scenario, the inflexion point in the capacity retention ratio curve is given by,

wherextrepresents the inflection point corresponding to the capacity retention.
A basic consideration would be a linear slippage,S(t)=ks*twhereksis the slipping rate.Provided the same parameters in table 1 andks= 5×10⁻⁴, we examine the ps-OCV curve, the cell voltage curve and the capacity retention ratio fade during battery aging,as shown in Fig.3.In line with Eq.(6) and Eq.(7), the inflexion point of capacity fade decreases from 80%SOH to~60% SOH because of the slippage of the ps-OCV curve.However, the inflection point in terms of cycle numbertis independent of the slippage.Due to the loss of active materials and lithium inventory,the actual value in terms of SOH of the inflexion point would be smaller than the value in terms of DOD of the turning point in the ps-OCV curve.In other words, the position of the inflexion point can be employed, to some extent, as an indicator of loss of active materials and lithium inventory.
2 A general theory
A generalized formulation is provided in this section to cope with other major aging mechanisms distinguished between positive electrode and negative electrode.When speaking of aging mechanism, we here do not mean fundamental physico-chemical reactions or structural changes but their outcomes that are classified into loss of active materials, loss oflithium inventory and increase of cell resistance[2-3].The use of SOC would bring confusions when both positive and negative electrodes are involved.In this regard, we employ the usable lithium content in an electrode, x, as an intrinsic descriptor of the state of the electrode.The OCV of each electrode can be expressed as,

Fig.3 (a) Slippage of the ps-OCV curve during aging.(b) Evolution of cell voltage curves during discharge and the red line represents the lower bound of voltage.(c) The magnitude of slippage during battery aging.(d) Capacity retention ratio as a function of cycle number, compared to the case without considering slippage.
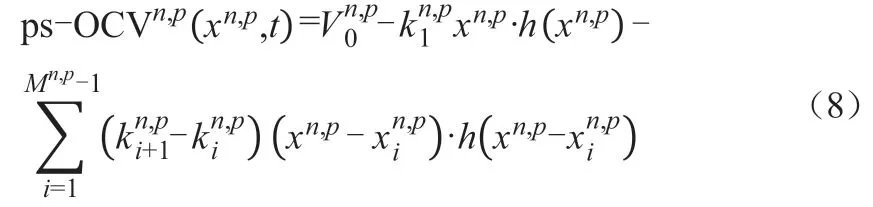
where the superscript ‘n’ and ‘p’ refer to negative electrode or positive electrode, respectively.Eq.(8) can be regarded as an extension of Eq.(1)by considering a multitude of slopes, of which the number is denoted as M.kiis the magnitude of slopes at different regions, and xirepresents the turning point at which the slope of the OCV curve changes.
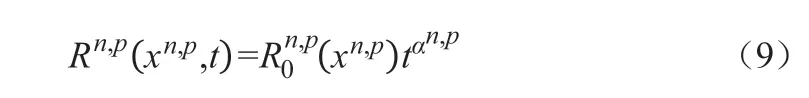
SOC-dependent resistance growth can be formulated as,
Next, we need to correlate xnand xp.Here the xpof a fresh cell is normalized to the region of [0, 1].When the cell is fully charged, the lithium content in the positive electrode has a minimum value that is set as the reference value which is unchanged during aging,, in this study.On the contrary, the lithium content in the negative electrode at this point may slip due to aging factors including the loss of lithium inventory.In addition, loss of active materials commences at both electrodes which would alter the loading ratio between positive electrode and negative electrode.Based on the conservation of lithium-ions,the following relation is established,

where a(t) refers to the fraction of loss of active materials in an electrode, r0is the initial loading ratio.represents the lithium content in the negativeelectrode when the cell is at fully charged state, andis the lithium content in the positive electrode at the same time.S(t) denotes the slippage ofduring aging.The cell voltage is written as,
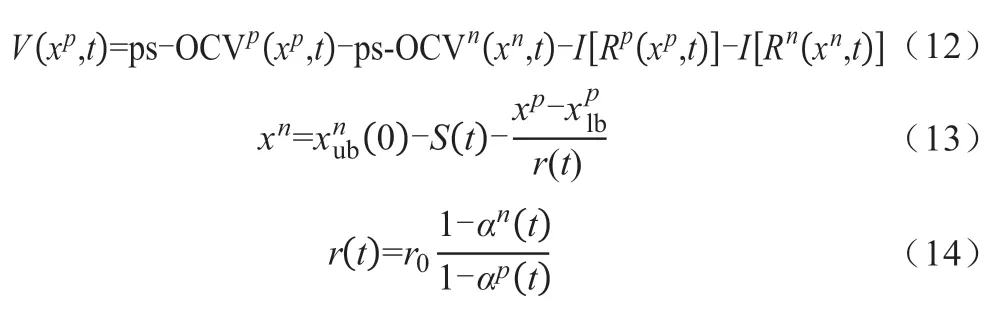
wherer(t) is the time-varying loading ratio.
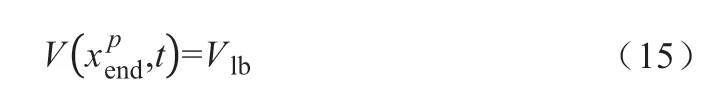
Given the lower bound of voltage during discharge,Vlb, one can solve the lithium content in the positive electrode,xendp, or that in the negative electrode equivalently, when the discharge process is terminated.
Therefore, the capacity retention ratio of the cell during aging,c(t), is defined as,

Fig.4 exemplifies this general theory using the parameters shown in table 2.The OCV curveof positive electrode has three slopes, while that of negative electrode has seven slopes, of which three are set as zero to resemble the voltage terraces in graphite.In this regard, the OCV curve of the full cell has seven slopes, while four of them are relatively obvious.Given the aging factors as delineated in Fig.4(c), Fig.4(b) describes the cell voltage curves with aging.Fig.4(d) depicts the calculated capacity retention ratio of the cell as a function of aging time.Noticeably, four obvious phases can be seen, and they are corresponding to the slopes in both positive and negative (P+N), positive (P), and negative (N), and P+N, respectively.

Table 2 Parameters used in this general theory simulation

Fig.4 (a) Initial OCV curves of the positive electrode, anode electrode and the full cell; (b) Evolution of cell voltage curves during discharge and the red line represents the lower bound of voltage; (c) Profiles of parameters during aging; (d) Multistage drop of the capacity retention ratio as a function of cycle number
The theory and results in this work show a possible way to predict the abrupt drop of capacity retention during cycling, of which the criterion is that the turning point of the multi-slope OCV curve reaches the discharging cut-off voltage.
3 Conclusion
A key message that this work conveys is that the observed multi-stage aging behavior may originate from the multi-slope nature of OCV curves of battery materials and the continuous increasing kinetic polarization during aging.The previously proposed lithium-plating or electrolyte drying can be sufficient causes, however, they are not necessarily required.A general theory that is facile to incorporate major aging mechanisms and battery chemistries is developed.Aside from providing new insights in understanding the abrupt drop in capacity retention, the presented theory is believed to bring new benefits in the full lifespan design and reuse of lithium-ion batteries.They specifically include the prediction of inflexion points, assessment of battery designs exerted by modifications at materials level, and the optimization of operating conditions.