In-situ sulfur isotope and trace element of pyrite constraints on the formation and evolution of the Nibao Carlin-type gold deposit in SW China
2019-09-06JinxiangLiChenghaiZhaoYongHuangYuzhouZhuoJinweiLi
Jinxiang Li · Chenghai Zhao · Yong Huang · Yuzhou Zhuo ·Jinwei Li
Abstract The fault-controlled Nibao Carlin-type gold deposit, together with the strata-bound Shuiyindong deposit, comprise a significant amount of the disseminated gold deposits in southwestern Guizhou Province, China.Five main types and two sub-types of pyrite at the Nibao deposit (Py1a/Py1b, Py2, Py3, Py4, Py5) were distinguished based on detailed mineralogical work. Py1, Py2 and Py3 are Au-poor, whereas Py4 and Py5 are Au-rich,corresponding to a sedimentary and hydrothermal origin,respectively. Through systematic in situ analyses of NanoSIMS sulfur isotopes, the framboid pyrite Py1a with negative δ34S values(- 53.3 to- 14.9‰)from the Nibao deposit were found to originate from bacterial sulfate reduction(BSR)processes in an open and sulfate-sufficient condition while the superheavy pyrite Py1b(73.7—114.8‰)is probably due to the potential influence of closed-system Rayleigh fractionation or the lack of preservation of deepsea sediments.Data of Py2 and Py3 plot within the area of S isotope compositions from biogenic and abiogenic sulfate reduction.In view of few coeval magmatic rocks in the mining district, the near zero δ34S values of the Au-rich pyrites (Py4 and Py5) may discount the potential involvement of magmatic but metamorphic or sedimentary origin.LA-ICP-MS and TEM work show that Au in ore-related pyrite is present as both nanoparticles and structurally bound. LA-ICP-MS analyses show that the Au-rich pyrite also contains higher As, Cu, Sb, Tl and S than other types of pyrite, which inferred a distal manifestation of deep hydrothermal mineralization systems.
Keywords Nibao Carlin-type gold deposit · Pyrite ·NanoSIMS · LA-ICP-MS · Sulfur isotopes
1 Introduction

Fig. 1 Simplifed geologic map showing the location of sediment-hosted disseminated Au deposits in the Youjiang basin (modifed from Chen et al. 2012, 2015b; Hou et al. 2016; Nevolko et al. 2017). F1: Honghe Fault; F2: Panxian-shizong Fault; F3: Ziyun-du’an Fault; F4: Pingxiang Fault; F5: Youjiang Fault; F6: Poping Nappe Structure
The Nibao fault-controlled gold deposit is one of the largest CTGDs in southwest Guizhou Province (Fig. 2),which is rich in mercury,antimony,arsenic,thallium,copper, lead, zinc, aluminium, sulfur, coal and barite (Zhang et al. 2003). Numerous studies of this district have been carried out to reveal the timing of Au mineralization, the source of gold, the evolution of ore-forming fluids and the alteration processes(Zhang et al.2003,2005;Xia 2005;Liu et al.2006a,b; Liu et al.2007,2009,2010,2017;Su et al.2008, 2009a, b, 2012, 2018; Peng et al. 2012, 2014; Xiao 2012; Wang et al. 2014; Liu et al. 2015; Hou et al. 2016;Zheng et al.2016).Previous studies of the Nibao deposit are summarized as follows: the timing of mineralization 141 ± 3 Ma (Chen et al. 2019); the metallogenic mechanism(Tao et al.2005;Qi et al.2014);the source of Au(Wei 2017); the origin and evolution of ore fluids (Liu et al.2006a, b;Zheng et al.2016);the characteristics and distribution of ore bodies (Wang et al. 1995; Chen et al. 2013;Zheng et al. 2014); and the alteration type and ore prospecting(Tao et al.2002;Liu et al.2006b).Based on the relatively reliable ages of previous work in the Youjiang basin, there might be two episodes of gold mineralization,one in about 200—230 Ma(mostly for CTGDs of the southern basin)and another in about 130—150 Ma(mostly for CTGDs of the southern basin), corresponding to Indosinian and Yanshanian orogeny(Hu et al.2017a;Su et al.2018).These data indicate that the age of the Nibao is consistent with the Yanshanian episode of gold mineralization.

Fig. 2 A geological sketch map showing the distributions of various deposits, southwest Guizhou Province (after Zhang et al. 2003; Liu et al.2015). Strata abbreviations in the map: T3-Late Triassic; T2-Middle Triassic; T1-Early Triassic; P2-Middle Permian; P1-Early Permian;C-Carboniferous; D-Devonian
Previous S isotopic analyses of pyrite separated from CTGDs are always hindered by the presence of diagenetic core and ore-related thin rims, which represent a mixed result. Besides, different generations of sedimentary core and hydrothermal rim might have undergone the equilibration of sulfur isotopic composition, and the overprinted result makes the arsenian pyrite a poor candidate to derive the valid interpretation of an original metal source (Zhang 1998; Chen et al. 2009a, b, 2015b). Accordingly, we utilized high-resolution (~100 nm) NanoSIMS technique,complemented with in situ microanalytical LA-ICP-MS and TEM methods. Through a detailed study of the main gold bearing sulfide,this study constrained the contents and chemical forms of Au, the origin and evolution of oreforming fluids, and the genetic model of Carlin-type gold deposits in the Youjiang basin.
2 Geological settings
Regionally, the CTGDs in the district are located tectonically at the joint of the Yangtze Block and the Youjiang fold belt and are bound to the southwest by the Red River fault(F1),to the northwest by the Shizong-Mile fault(F2),to the northeast by the Ziyun-Du’an fault (F3), and to the southeast by the Pingxiang-Nanning fault (F4) (Fig. 1).Experienced with three phases of evolution (rift, back-arc rift and foreland basin), this basin consists of Neoarchean to Proterozoic low-grade metamorphic rocks overlain by thick shale and carbonate sequences of Cambrian to Triassic age(Hu et al.2002;Peters et al.2007;Su et al.2008;Hu and Zhou 2012).
The exposed strata in the Youjiang basin can be further divided into two sections (Fig. 1), platform facies strata(located to the northwest of F6;including the Shuiyindong,Zimudang,Nibao deposit etc.)composed of a thin layer of carbonates, siliceous rock, mudstone and pyroclastics, and basin facies strata (Laizishan sequence, located to the southeast of F6; including the Lannigou deposit etc.)composed of terrigenous detrital turbidite, such as calcareous sandstone,siltstone and mudstone(Suo et al.1993;Chen et al. 2015b). Granite plutons aging from Triassic(Indosinian) to Jurassic-Cretaceous (Yanshanian) are present at the margins,the east and south of the basin(Fig. 1;Hu and Zhou 2012; Mao et al. 2013; Pi et al. 2017; Zhu et al. 2017; Yan et al. 2018).
The Nibao gold deposit is located in Pu’an County of Guizhou Province, and ~50 km southwest of the Zimudang gold deposit (Fig. 2). It has been mined for nearly 30 years and possesses a gold reserve of ~18 t(0.6 Moz)by early geological work(Zheng et al.2016).The exposed strata in this region primarily include the Middle Permian Maokou Formation (P2m), the Upper Permian Longtan Formation (P3l) (including tuffaceous pyroclastic rocks of P3β), the Lower Triassic Feixianguan Formation (T1f), the Lower Triassic Yongningzhen Formation (T1yn) and the Middle Triassic Guanling Formation (T2g), which forms the basic framework of the Nibao gold deposit, together with these faults and the NEE fold (Erlongqiangbao anticline)(Fig. 3). P2m is mainly bioclastic limestone, and P3l contains silicified bioclastic limestone, interlayered with calcareous limestone,siltstone,argillite and sandstone.The Upper Permian Longtan Formation (P3l) is divided into three lithological units (namely P3l1, P3l2and P3l3). The first member P3l1and the second member P3l2are the favorable gold-hosting strata(Zheng et al.2016).T1f,T1yn and T2g similarly consist of carbonate rocks and finely clastic rocks. Noteworthily, structure-controlling alteration zones [abbreviated to SBT, according to its Chinese definition by Liu and Liu (2005)] developed near the uncomfortable interface between the P2m Formation and the P3l Formation, are characterized by discernible features of silicification and brecciation (Liu et al. 2007, 2009, 2010).In addition, they mainly consist of strongly silicified and brecciated limestone, chert, tuff and argillite (Liu et al.2010; Zheng et al. 2016), which are important ore-controlling structures. Gold bodies occur in the main fault F1 and the collapsed place in the core of the anticline(Figs. 4,5).
3 Sampling and analytical methods
3.1 Sampling
To systematically reveal different features of different strata, nearly 20 mining-pit samples were collected from the Nibao deposit (Fig. 4). All samples were made into 90 thin sections of ~0.1 mm thick according to their Au contents, with specially prepared samples (Table 1) for NanoSIMS analyses and high resolution TEM observation.
When he had opened the door he stepped in first, and thought to cover the likeness5 so that the King might not perceive it; but it was hopeless: the King stood on tiptoe and looked over his shoulder
3.2 Analytical methods
Au contents of all samples were detected by the ALS Chemex Co. Ltd, Guangzhou, China. The low Au content samples were detected by the Atomic Absorption Spectroscopy(AAS)method(Au-AA23,0.005—10 ppm).Highgrade samples (over 10 ppm) were firstly dealt with fire assay method of analysis (FAA), and then analyzed by the gravimetric method (Au-GRA21, 0.05—1000 ppm) for the incomplete dissolution of the high-grade samples. Then,thin sections were prepared according to the grade of representative samples for the further measurements below.Backscattered electron (BSE) images and secondary electron images were obtained from a JEOL JSM7800F SEM under the operation conditions of 10—15 kV, 10 nA and a beam size of 1 μm in diameter, at the State Key Laboratory of Ore Deposit Geochemistry, Chinese Academy of Sciences.Major and minor elemental compositions of the selected pyrites were determined using a JEOL JXA-8230 EMPA under the operation conditions of 15 kV,10 nA and a beam size of 1 μm in diameter, with a count time of 10 s(peak)and 5 s(upper and lower background),at the Testing Centre of Shandong Bureau of China Metallurgy and Geology, China. The characteristic X-rays used are Fe (Kα), S (Kα), As (Lα), Au (Lα), Ni (Kα), Co(Kα),Cu(Kα)and Se(Lα).The standard materials for each element are as follows: pyrite (FeS2) for Fe and S,arsenopyrite (FeAsS) for As, pentlandite ((Fe,Ni)9S8) for Ni, galena (PbS) for Pb, gold (Au0) for Au, skutterudite[(Co, Ni, Fe)As3-x] for Co, (silver) Ag0for Ag, cuprite(Cu2O) for Cu, stibnite (Sb2S3) for Sb, bismuth selenide(Bi2Se3) for Se and sphalerite (ZnS) for Zn, respectively.The detection limits for elements are listed in Table 2.Matrix effects were corrected using the ZAF software provided by JEOL.

Fig. 3 Geological map of Nibao gold deposit. Modified after Zheng et al. (2016)

Fig. 4 A geological sketch map showing the cross section along the A—A’ line (Fig. 3) of the Nibao gold deposit. Modified after Zheng et al.(2016)

Table 1 Sampling location and details of samples selected for experiments
In-situ S isotope spot analysis or elemental mapping of three thin-sections,and nearly 30 pyrite grains and 80 spots carefully selected, were undertaken using a CAMECA NanoSIMS 50L instrument at the Institute of Geology and Geophysics, Chinese Academy of Sciences. A related methodology is described in detail by Zhang et al.2014a, b. The analysis used certified international standards (including Pyrite of Balmat, CAR-123 pyrite) and working reference samples (pyrite PY-1117 and CS01),with the conditions of a 2 μm spot size and a 1—2pA Cs+ion beam. The analytical precision (1σ) was about ± 0.5 per mil.
Trace element analysis of pyrites analyzed by Nano-SIMS was carried out by LA-ICP-MS at the Sample-Solution Analytical Technology Co., Ltd., Wuhan, China.Laser sampling was performed using a GeolasPro laser ablation system that consisted of a COMPexPro 102 ArF excimer laser (wavelength of 193 nm and maximum energy of 200 mJ) and a MicroLas optical system. An Agilent 7700e ICP-MS instrument was used to acquire ionsignal intensities. Helium was applied as a carrier gas.Argon was used as the make-up gas and mixed with the carrier gas via a T-connector before entering the ICP, see details in Zong et al.(2017).The spot size and frequency of the laser were set to 24 μm and 5 Hz, respectively, in this study. In addition, the data are calibrated against various reference materials (MASS-1 and NIST 610) and then quantified against the MASS-1 synthetic pyrite and NIST 610 standards, using57Fe as the internal standard by using the Excel-based software ICPMSDataCal. It performs offline selection and integration of background and analysed signals, time-drift correction and quantitative calibration for trace element analysis (Liu et al. 2008).
Focused Ion Beam Scan Electron Microscope (FIBSEM) preparation work was completed at the Centre for Lunar and Planetary Sciences, Institute of Geochemistry,Chinese Academy of Sciences, with using an FEI Scios Dual beam. Ultra-thin slices were examined by a field emission transmission electron microscope(Tecnai G2 F20 S-TWIN, FEI Inc., USA) equipped with an energy dispersive spectrometer in the State Key Laboratory of Environmental Geochemistry, Institute of Geochemistry,Chinese Academy of Sciences. The techniques included high magnification bright field topography imaging analysis, high resolution lattice imaging analysis, selected area electron diffraction(SAED)analysis and Fourier transform structural analysis (Li et al. 2018).
4 Results
4.1 Petrology and mineralography
The detailed descriptions of field outcrops and hand samples are illustrated in Fig. 5.Carbonate minerals have been intensely dissolved in most rocks and locally cemented by quartz-fluorite, which composed the jasperiod rocks with collapsed breccias (Fig. 5c, e, f). Potassium-aluminium silicate mineral assemblages of illite(± kaolinite)occur in the limestone (Fig. 5g). Carbonate mineral occurs as the extensive calcite veins, always associated with realgar,quartz and fluorite (Fig. 5d, f). Representative sulfide mineral presents as disseminated pyrite (Fig. 5e—f).

Table 2 Electron probe microanalysis results (wt%) for all pyrite types from Nibao deposit
Mineralogical work conducted by optical microscope and SEM is summarized as follows. Petrographic and paragenetic studies suggest that Py1 appears as framboidal clusters(0.1—4 μm),and always occurs in the strata of P3l,which mainly consist of argillite and bioclastic limestone with fossil remains, or organic matter (OM, Fig. 6a).Subdivided into Py1a and Py1b, Py1 is distributed in the pore and surrounded by nonmetallic minerals such as quartz, dolomite, and illite. The difference is that Py1a clusters always have much more space than Py1b clusters(Fig. 6b, c), which tightly join together without any pores,with a typical framboidal texture for biological enrichment.Similar to the spongy‘‘matrix’’overgrowing Py1a,Py1b is probably simultaneous or slightly later than Py1a.Enclosing Py1 framboids, Py2 (30—100 μm) is distinguished by a porous texture and filled by nonmetallic minerals such as quartz, dolomite, and illite (Fig. 6d, e).Distributed in tuff and tuffaceous sandstone, Py3(20—200 μm) exhibits a smooth texture (Fig. 6d—i). With the highest bright arsenic rims,porous Py4(50—200 μm)is always developed in strongly deformed zones, shown by the evidence of alteration (Fig. 6d—f) or even erosion(Fig. 6h—i) by high-arsenic fluids along the fractures.Together with Py4, Py5 (5—20 μm, Fig. 6d—i) is directly related to Au mineralization, denoted by bright rims with oscillatory zoning.

Fig. 6 Backscattered electron(BSE)photographs showing textural features and relationships of Py1-Py5 in the Nibao deposit.a—c Microscope and backscattered electron (BSE) images of Py1 enveloped by high arsenic pyrite, coexisting with OM veins of limestone. d-e BSE images of porous Py2 encompassed by smooth Py3, overgrown by porous Py4 and Py5 within tuffaceous sandstone rocks in highly deformed zones. g-i Photomicrograph and BSE photographs showing the clear paragenesis relationships of smooth Py3 and oscillatory Py4 and Py5,and with pyrite in quartz veins (Fig. 6g). Abbreviations: Py-pyrite, OM-organic matter, Qtz-quartz
4.2 Results of EPMA analysis
Electron probe quantitative microanalysis results(wt%)for the pyrite types are shown in Table 2, and the whole dataset is listed in Electronic supplementary material 1(ESM 1).Comparatively,As contents in Py1a to Py5 of the Nibao deposit are bdl,bdl,0—0.01,elevated 0.14—4.50 wt%(1.72 wt% on average), 2.34—8.09 wt% (4.91 wt% on average), 0.50—5.51 wt% (2.29 wt% on average), respectively. Among them, Py4 is characterized by the highest average arsenic content of ca. 4.91%. In addition, Au content ranges from bdl in Py1a,0—0.01 in Py1b,0—0.02 in Py2 (0.01 wt% on average), 0—0.02 in Py3 (0.01 wt% on average),0—0.02 in Py4(0.01 wt%on average),and 0—0.05 in Py5(0.02 wt%on average).Cu content ranges from 0 to 0.01 in Py1a, 0—0.11 in Py1b (0.04 wt% on average),0.02—0.09 in Py2 (0.04 wt% on average), 0—0.26 in Py3(0.08 wt% on average), 0.04—0.17 in Py4 (0.11 wt% on average), and 0—0.26 in Py5 (0.11 wt% on average).
4.3 Sulfur isotope compositions of pyrites
In-situ sulfur isotope data of the Nibao deposit in this study and previous work is delineated in Table 3 and Fig. 7,and the whole dataset is listed in Electronic supplementary material 2 (ESM 2). Similarly, 9 analyses of Py1a and 6 analyses of Py1b of the Nibao deposit range from- 53.3 to- 14.9‰ (- 31.8‰ on average) and 73.7—114.8‰(99.6‰ on average), respectively (Table 3, Fig. 8). The data of Py2 ranges from - 1.1 to - 0.1‰ and for Py3 ranges from 8.4 to 18.0‰, with median values of - 0.6 and 13.3‰, respectively. Ore-related Py4 and Py5 show a similar and sharp variation of - 2.1—4.9‰ and- 3.9—4.8‰, with medians of 2.4 and 2.3‰, respectively.

Fig. 7 NanoSIMS δ34S histograms of pyrites from the Nibao deposit
4.4 Trace element geochemistry of pyrites
Chalcophile-siderophile trace element concentrations were obtained by LA-ICP-MS analyses of all pyrite types are listed in Table 4,which reveal the mean and median values and data distribution features for trace elements in each pyrite type.2 spots of Py1,4 spots of Py2,9 spots of Py3,7 spots of Py4 and 6 spots of Py5 in the Nibao deposit are acquired. Box plots of trace elements concentrations are shown in Fig. 9,which shows the mean and median values and the data spread for selected elements of different pyrite types. Meanwhile, the comparison between the Nibao deposit and the Shuiyindong deposit is shown in Fig. 10.Py1 of the Nibao deposit exhibits Mn(3.55—28.41 ppm)(similarly, mixed with ore—Py4, the spots of 15NB—6—01&02 on Py1 contain high As, Au, Ag, Sb and Tl). Py2contains more V(1.26—6.95 ppm),Mn(6.90—263.08 ppm),Co (118.80—1119.18 ppm), Ni (226.64—862.41 ppm), Cu(89.01—534.26 ppm), Se (0—92.80 ppm) and W (0.14—4.43 ppm)than Py1.Py3 contains less V(0.04—3.73 ppm),Mn (0—35.87 ppm), Co (0.11—163.29 ppm), Ni (0.84—531.45 ppm), Cu (4.68—485.60 ppm), Zn (0.22—16.70 ppm), Ag (0—2.27 ppm), and W (0—1.56 ppm)(especially Mn), but higher As (0—3112.12 ppm) and Se(0—770.84 ppm) than Py1 and Py2. Ore—related Py4 and Py5 contain more As (Py4, 2827.22—17,021.29 ppm; Py5,10,271.43—21,288.81 ppm), Au (Py4, 1.28—24.14 ppm;Py5, 13.21—32.93 ppm), V (Py4, 0.07—2.94 ppm; Py5,0.62—12.99 ppm), Cu (Py4, 148.96—489.05 ppm; Py5,273.30—801.64 ppm), Zn (Py4, 0.32—13.03 ppm; Py5,0.39—2.15 ppm), Ag (Py4, 2.28—12.69 ppm; Py5, 5.76—10.90 ppm), Sb (Py4, 23.78—239.27 ppm; Py5, 95.97—222.30 ppm), Tl (Py4, 1.11—6.68 ppm; Py5, 1.62—6.33 ppm)and W(Py4,0—2.79 ppm;Py5,0.01—9.96 ppm)than the other pyrite types, which indicates hydrothermal characteristics of the Au precipitation stage. In addition,the data shows a large spread(2—4 orders of magnitude)in As and Au concentrations, and the high As and Au concentrations of framboid pyrite Py1 are attributed to mixing with ore-related pyrites. Binary plots of all pyrites in the Nibao and Shuiyindong deposit are completed in Fig. 11.Correlation coefficients for the trace elements in ore-related pyrites show a good correlation of Au versus Tl(R2SYD= 0.5990), As versus Cu (R2NB= 0.3841,R2SYD= 0.5168), Au versus Cu (R2NB= 0.4395), Au versus Ni (R2NB= 0.3150), Co versus Ni (R2NB= 0.5710), and Ag versus Tl (R2NB= 0.8979, R2SYD= 0.3843).

Table 3 δ34S range of different types of pyrites by NanoSIMS and late stage sulfide minerals of Nibao deposits

Fig. 8 NanoSIMS element mappings of representative pyrites Py1a and Py1b of the Nibao deposit. Red squares represent the spot position of selected areas(a,b,c and d)for in-situ sulfur isotope analysis and the white numbers show δ34S values
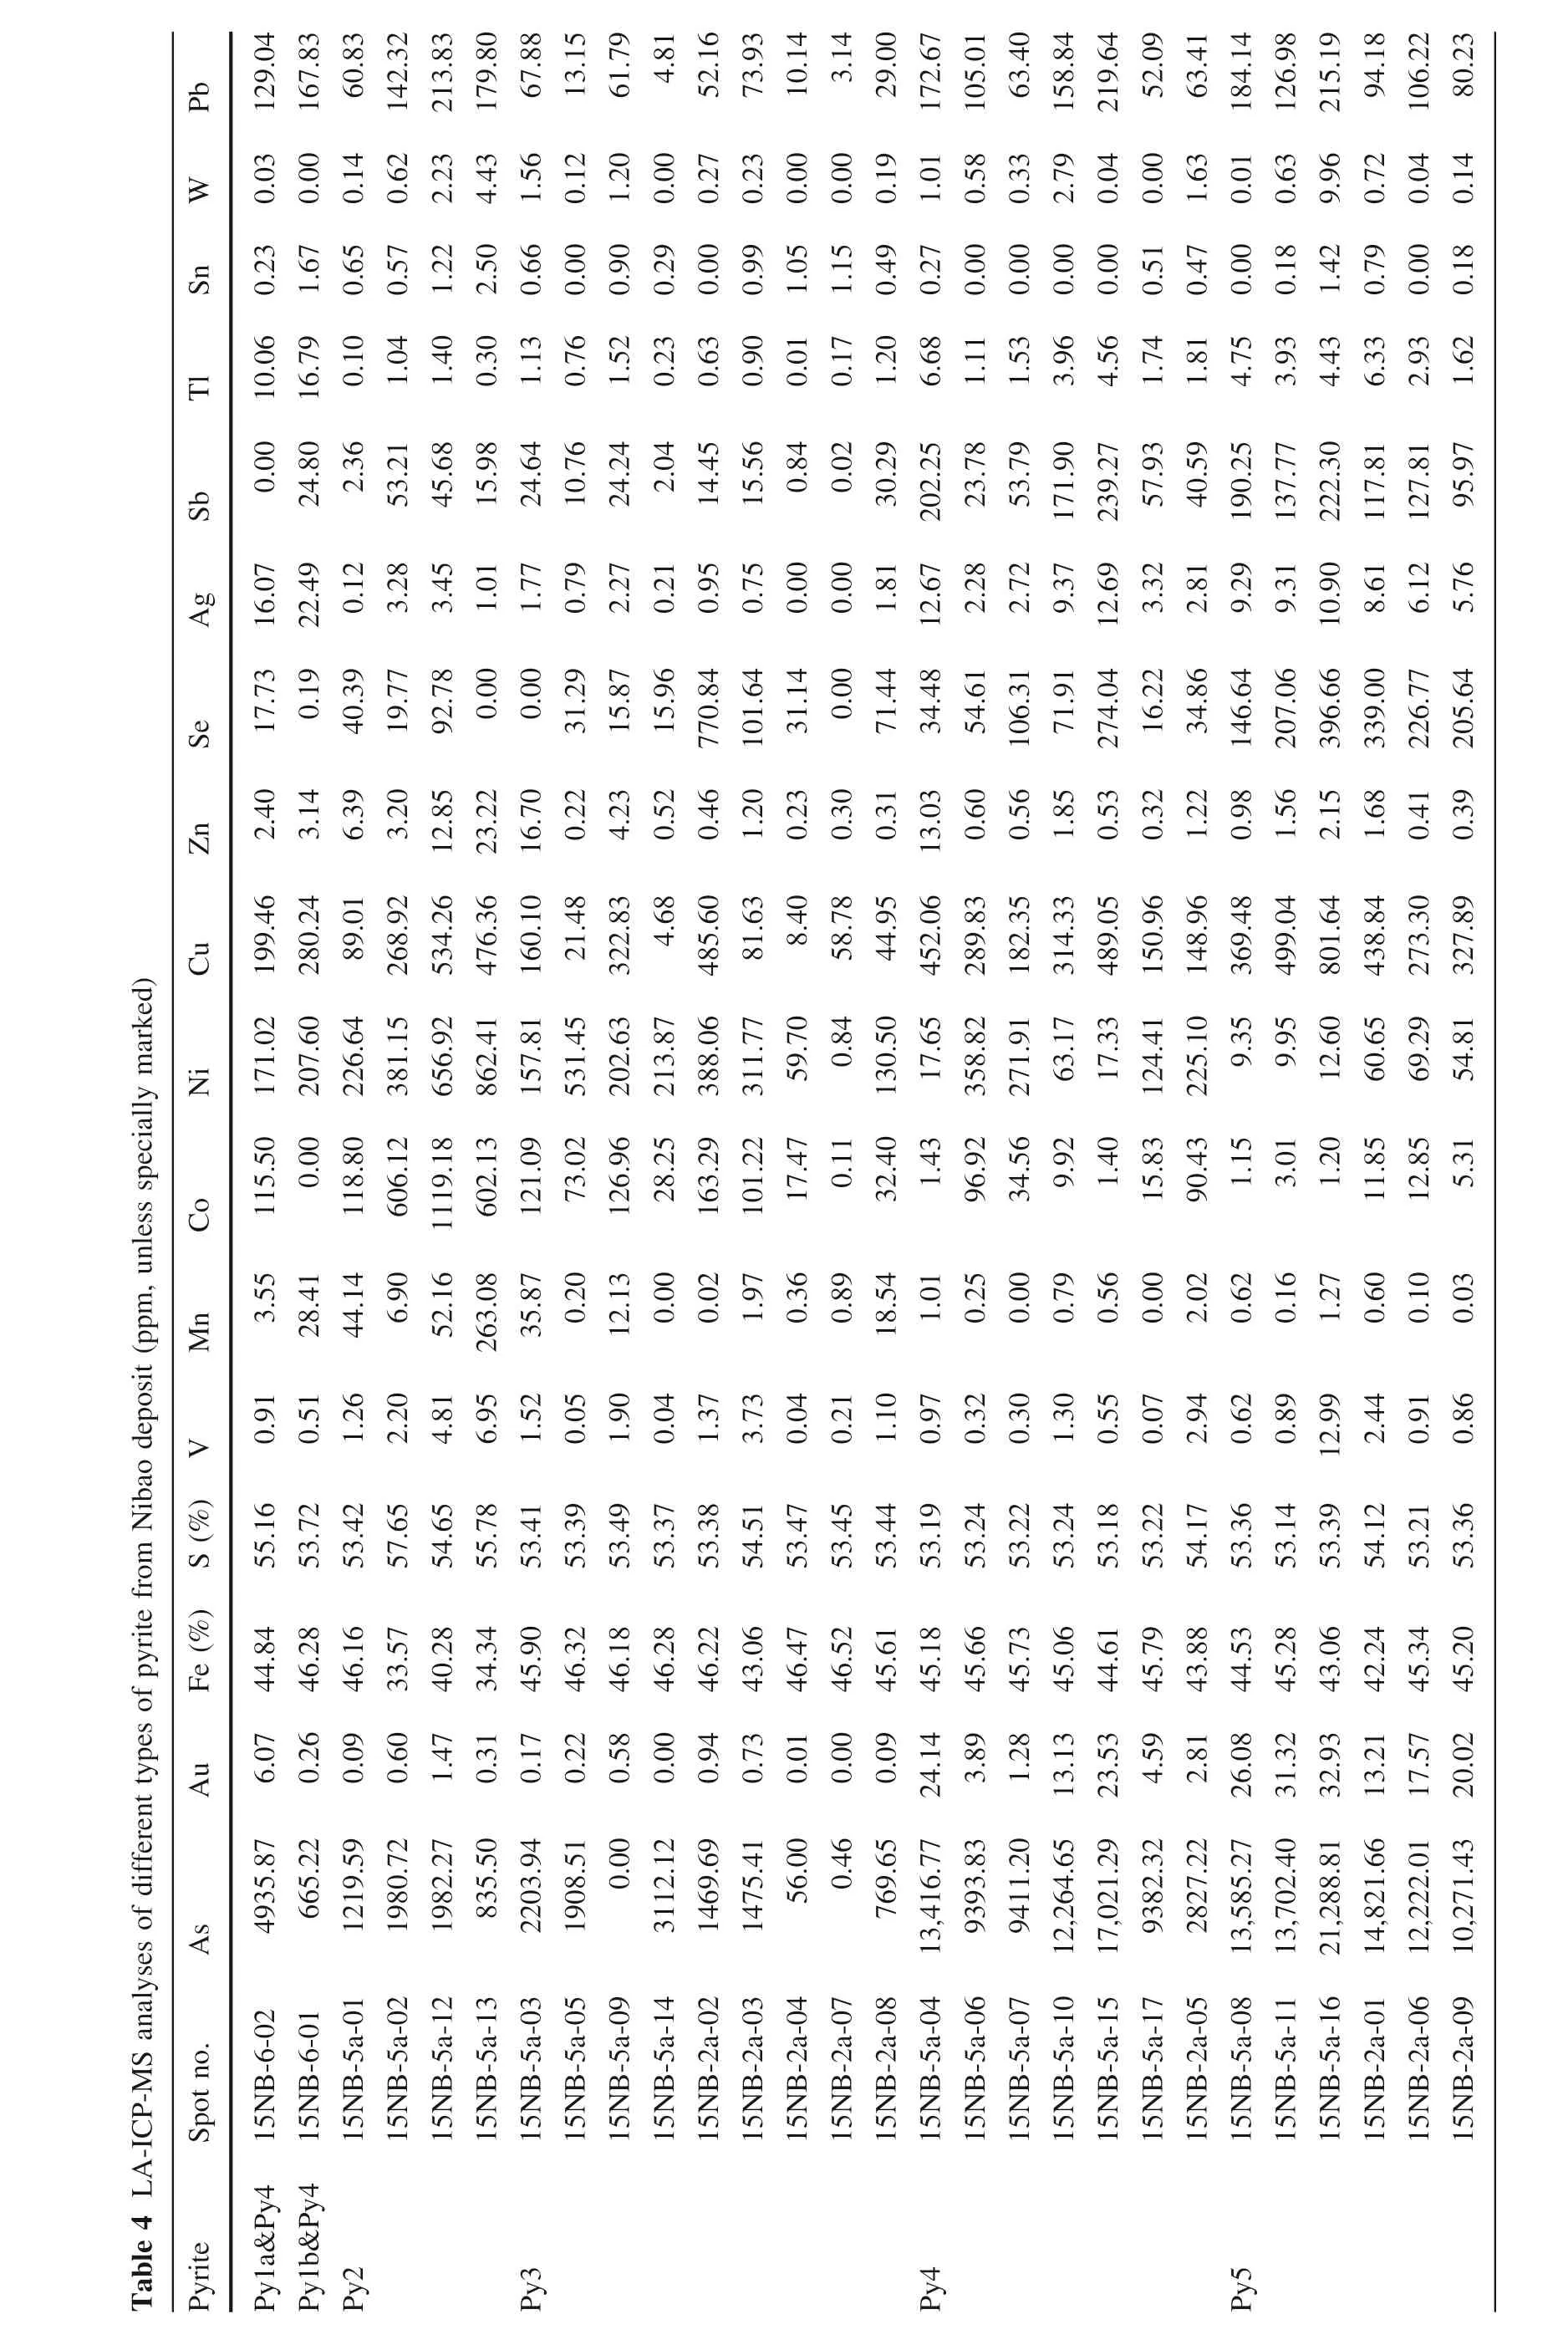
Table 4 LA-ICP-MS analyses of different types of pyrite from Nibao deposit (ppm, unless specially marked)Pyrite Spot no.As Au Fe (%) S (%) V Mn Co Ni Cu Zn Se Ag Sb Tl Sn W Pb Py1a&Py4 15NB-6-02 4935.87 6.07 44.84 55.16 0.91 3.55 115.50 171.02 199.46 2.40 17.73 16.07 0.00 10.06 0.23 0.03 129.04 Py1b&Py4 15NB-6-01 665.22 0.26 46.28 53.72 0.51 28.41 0.00 207.60 280.24 3.14 0.19 22.49 24.80 16.79 1.67 0.00 167.83 Py2 15NB-5a-01 1219.59 0.09 46.16 53.42 1.26 44.14 118.80 226.64 89.01 6.39 40.39 0.12 2.36 0.10 0.65 0.14 60.83 15NB-5a-02 1980.72 0.60 33.57 57.65 2.20 6.90 606.12 381.15 268.92 3.20 19.77 3.28 53.21 1.04 0.57 0.62 142.32 15NB-5a-12 1982.27 1.47 40.28 54.65 4.81 52.16 1119.18 656.92 534.26 12.85 92.78 3.45 45.68 1.40 1.22 2.23 213.83 15NB-5a-13 835.50 0.31 34.34 55.78 6.95 263.08 602.13 862.41 476.36 23.22 0.00 1.01 15.98 0.30 2.50 4.43 179.80 Py3 15NB-5a-03 2203.94 0.17 45.90 53.41 1.52 35.87 121.09 157.81 160.10 16.70 0.00 1.77 24.64 1.13 0.66 1.56 67.88 15NB-5a-05 1908.51 0.22 46.32 53.39 0.05 0.20 73.02 531.45 21.48 0.22 31.29 0.79 10.76 0.76 0.00 0.12 13.15 15NB-5a-09 0.00 0.58 46.18 53.49 1.90 12.13 126.96 202.63 322.83 4.23 15.87 2.27 24.24 1.52 0.90 1.20 61.79 15NB-5a-14 3112.12 0.00 46.28 53.37 0.04 0.00 28.25 213.87 4.68 0.52 15.96 0.21 2.04 0.23 0.29 0.00 4.81 15NB-2a-02 1469.69 0.94 46.22 53.38 1.37 0.02 163.29 388.06 485.60 0.46 770.84 0.95 14.45 0.63 0.00 0.27 52.16 15NB-2a-03 1475.41 0.73 43.06 54.51 3.73 1.97 101.22 311.77 81.63 1.20 101.64 0.75 15.56 0.90 0.99 0.23 73.93 15NB-2a-04 56.00 0.01 46.47 53.47 0.04 0.36 17.47 59.70 8.40 0.23 31.14 0.00 0.84 0.01 1.05 0.00 10.14 15NB-2a-07 0.46 0.00 46.52 53.45 0.21 0.89 0.11 0.84 58.78 0.30 0.00 0.00 0.02 0.17 1.15 0.00 3.14 15NB-2a-08 769.65 0.09 45.61 53.44 1.10 18.54 32.40 130.50 44.95 0.31 71.44 1.81 30.29 1.20 0.49 0.19 29.00 Py4 15NB-5a-04 13,416.77 24.14 45.18 53.19 0.97 1.01 1.43 17.65 452.06 13.03 34.48 12.67 202.25 6.68 0.27 1.01 172.67 15NB-5a-06 9393.83 3.89 45.66 53.24 0.32 0.25 96.92 358.82 289.83 0.60 54.61 2.28 23.78 1.11 0.00 0.58 105.01 15NB-5a-07 9411.20 1.28 45.73 53.22 0.30 0.00 34.56 271.91 182.35 0.56 106.31 2.72 53.79 1.53 0.00 0.33 63.40 15NB-5a-10 12,264.65 13.13 45.06 53.24 1.30 0.79 9.92 63.17 314.33 1.85 71.91 9.37 171.90 3.96 0.00 2.79 158.84 15NB-5a-15 17,021.29 23.53 44.61 53.18 0.55 0.56 1.40 17.33 489.05 0.53 274.04 12.69 239.27 4.56 0.00 0.04 219.64 15NB-5a-17 9382.32 4.59 45.79 53.22 0.07 0.00 15.83 124.41 150.96 0.32 16.22 3.32 57.93 1.74 0.51 0.00 52.09 15NB-2a-05 2827.22 2.81 43.88 54.17 2.94 2.02 90.43 225.10 148.96 1.22 34.86 2.81 40.59 1.81 0.47 1.63 63.41 Py5 15NB-5a-08 13,585.27 26.08 44.53 53.36 0.62 0.62 1.15 9.35 369.48 0.98 146.64 9.29 190.25 4.75 0.00 0.01 184.14 15NB-5a-11 13,702.40 31.32 45.28 53.14 0.89 0.16 3.01 9.95 499.04 1.56 207.06 9.31 137.77 3.93 0.18 0.63 126.98 15NB-5a-16 21,288.81 32.93 43.06 53.39 12.99 1.27 1.20 12.60 801.64 2.15 396.66 10.90 222.30 4.43 1.42 9.96 215.19 15NB-2a-01 14,821.66 13.21 42.24 54.12 2.44 0.60 11.85 60.65 438.84 1.68 339.00 8.61 117.81 6.33 0.79 0.72 94.18 15NB-2a-06 12,222.01 17.57 45.34 53.21 0.91 0.10 12.85 69.29 273.30 0.41 226.77 6.12 127.81 2.93 0.00 0.04 106.22 15NB-2a-09 10,271.43 20.02 45.20 53.36 0.86 0.03 5.31 54.81 327.89 0.39 205.64 5.76 95.97 1.62 0.18 0.14 80.23

Fig. 9 Box plots showing the mean and median values and data spread for As,Au,V,Mn,Co,Ni,Cu,Zn,Se,Ag,Sb,Tl,Sn and W in pyrite types from the Nibao deposit

Fig. 10 Comparative box plots of trace element concentration in orerelated pyrite types of two deposits.Sn is enriched in the Shuiyindong deposit; Au, Ni, Zn, Se, Ag, Sb and W are enriched in the Nibao deposit, respectively. Boxes represent interquartile range (data between 1/4 and 3/4 interquartile), with top and bottom lines extending 1.5 times the interquartile range toward the maximum and minimum, respectively
4.5 TEM observation and nanoparticles
We made six FIB slices for TEM observations. Multiple layers can be classified as No. 1 to No. 4 outwardly,according to the As contents (Fig. 12a). Layer No.1 is the core of the pyrite, corresponding to Py3. Layers No. 2 and No. 3 belong to Py4 (Fig. 12b), and the former has the highest As content but no Au.Only layer No.4 is enriched in<10 nm Au nanoparticles(Fig. 12c),which is coherent with the analyses of LA-ICP-MS spots. The matrix surrounding the nanoparticles are randomly oriented pyrite(Fig. 12d). The crystallographic pattern of layer No. 4 is acquired using SAD images, which shows a monocrystalline mode.
5 Discussions
5.1 Genetic accordance between pyrite and gold

Fig. 11 Binary plots of a Au versus Pb,b Au versus Tl,c Au versus Ag,Te,d Sb versus Ag,e Co/Ni versus Au/Ag,f Au versus As,g As versus Cu, h Au versus Cu, i Au versus Ni, j Co versus Ni, k Au versus Se and l Ag versus Tl,in different pyrite types of two deposit.The dark red and light magenta dotted polygons represent the orerelated pyrites of the Nibao and Shuiyindong deposit, respectively
Au occurred in arsenian pyrite in two patterns of structurally bound invisible gold (Au1+with an undersaturated situation)and sub-micrometre/nanometre-sized native gold grains (Au0with an oversaturation) (Su et al. 2008, 2012).Previous researchers have done a lot of work by spectroscopic measurements (XANES and EXAFS) and microanalysis (TEM and SIMS), according to the occurrence of Au. LA-ICP-MS data elucidates that all spots of two deposits are below the limit line of Au solubility defined by Reich et al.(2005)(Fig. 11f),which implies that Au mainly presents in the form of a solid solution (i.e.Au1+). By the observations of HRTEM, this study first reported that Au nanoparticles occurred in arsenian pyrite of the Nibao deposit. A possible explanation for the lowintensity EDS results may be the fact that the nanoparticles are fine-grained, with a diameter of<10 nm, which is the minimum beam spot of the EDS system of TEM. We also found locally enriched gold accumulations via EPMA elemental mapping of the Nibao deposit (Fig. 13), which reflects the occurrence of Au micro-particles.

Fig. 12 Photographs of FIB-TEM work of the Nibao deposit.a BSE image of selected sample(the red arrow represents the direction of FIB slice of b.b Image of slice for TEM,red dotted line and yellow number showing the different layers.c TEM image of No.4 layer in b.Cicular dotted lines show Au nanoparticles,with the EDS spectra attached to the top right(the signal of Cu originates from the copper grid).d SAD image of No.4 layer, showing the crystallographic pattern
Furthermore, Au distribution patterns for LA-ICP-MS spot analyses of two deposits are relatively steady without sharp spikes, which indicates that gold also occurs in a lattice-bound form, and not only as micro/nano-phase particles that formed in the oversaturated state.Substitution of As for S creates lattice dislocations and plenty of space,facilitating Au1+(ionic radius,0.137 nm)entering into the crystal structures of pyrite (Simon 1999; Palenik et al.2004; Deditius et al. 2008; Reich et al. 2005, 2010; Morishita et al.2008;Kovalev et al.2009;Ciobanu et al.2011;
Liang et al. 2014), which can explain the lattice-bound form.Gold particles may be an enhancement of gold grade,however, the relative importance of these two different modes of occurrence of Au remains unclear.Facilitated by brittle deformation or late hydrothermal alteration, inclusion or exsolution can be explained by the occurrence of gold particles, and the sub-micron gold accumulations in the EPMA maps (Palenik et al. 2004; Reich et al. 2006).
5.2 Pyrite textures and geological significance
Py1a and Py1b clusters of the Nibao deposit exhibited framboid textures, which are considered as primary precipitating texture and interpreted as a syn-sedimentary to an early diagenetic origin(Barrie et al.2009;George et al.2018). Previous work indicates that framboids may often occur in modern marine and non-marine sediments/sedimentary rocks (Sweeney and Kaplan 1973; Perry and Pedersen 1993; Large et al. 2007; Wacey et al. 2015;George et al. 2018), and framboids can be readily formed under wide range of redox conditions (such as suboxic to anoxic/euxinic environment) (Wilkin and Barnes 1996;Wignall and Newton 1998). Also, framboidal pyrites form during late diagenesis,regional deformation,and late-stage hydrothermal alteration (Scott et al. 2009). They may also crystallize via hydrothermal processes(Spirakis et al.1990;England and Ostwald 1993; Scott et al. 2009). Framboidal pyrite has been frequently linked to microbial activity(Large et al. 2001; MacLean et al. 2008), but pyrite framboids have also been synthesized in the laboratory without organic influences (Sweeney and Kaplan 1973;Ohfuji and Rickard 2005). Spongy or approximately subhedral Py1b probably indicates a relative rapid nucleation process (Scott et al. 2009).

Fig. 13 Element mapping of As, Cu, Zn, Au and S in pyrites of the Nibao deposit showing the intimate relations along the pyrite growth outward, to give a visual representation of elemental concentrations and distributions
Similar to Py2 of the Shuiyindong deposit, the porous Py2 was interpreted to result from a diagenetic origin or the inversion of marcasite to pyrite, due to an increase in density and a decrease in volume (Murowchick 1992; Su et al. 2008), which trapped illite, quartz and calcite inclusions. The homogenous Py3 of the Nibao deposit,together with Py3 of the Shuiyindong deposit, likely crystallized in later sedimentary stage (late diagenesis to early deformation), followed by subsequent hydrothermal events represented by ore-related pyrites (Py4 and Py5). With finely oscillatory rims, ore-related Py4 and Py5 of the Nibao deposit, corresponding to Py4a and Py4b of the Shuiyindong deposit, reflect different sub-stages of alteration by Au—As—Cu—Sb—Tl-enriched fluids continuously during the ore-forming process.
5.3 Evolution of ore-forming fluids from the pyrite geochemistry
Various types of pyrite can be interpreted in terms of the polyphasic geological evolution(George et al.2018).Trace element concentrations of gold-hosting pyrites are vital to reveal the ore-forming processes, comment on the timing and conditions of trace element enrichment directly and effectively. These perturbations/fluctuations have been hypothesized to have resulted from changes in chemical gradients, such as redox conditions, pH, fertile sources of elements, volatile partitioning, and direct magmatic contributions (Grant et al. 2018). In addition, the modification of primary trace element distributions can result from hydrothermal reworking, recrystallization, and metamorphism (Grant et al. 2018). The inheritance of diagenetic pyrite trace elements can be fingerprinted by later hydrothermal fluids.
The variation between the Nibao and Shuiyindong deposits is shown in Figs. 10 and 11,which shows various relationships between trace element pairs. From Py1, Py2,Py3 to ore-Py4&ore-Py5, the increasing trend of Au—As—Cu—Sb—Tl is apparent, which is consistent with the Shuiyindong deposit.The median values of Au,Ni,Zn,Ag,Sb and W of the Nibao deposit are slightly higher than the Shuiyindong deposit.By contrast,ore-related pyrites of the Shuiyindong deposit exhibit higher Sn concentration. In addition,flat laser ablation profiles for most trace elements indicate the presence of lattice substitutions rather than as inclusions of other sulfides. But in consideration of the mixture of Py1 and ore-related pyrites, Py1s always hold higher values of ore-related elements (As—Au—Sb—Tl—Cu—Zn).In contrast,relatively high values of Cu and Zn of preore pyrites likely reflect the co-existence of widespread sphalerite and chalcopyrite micro-inclusions in pyrite(Fig. 13). Se is particularly enriched in pyrite at high temperatures (>300 °C) and in moderately to strongly reduced conditions(Grant et al.2018).In comparison with the Shuiyindong deposit, ore-related pyrites of the Nibao deposit record higher Se concentration (Fig. 10), which mainly indicates a relatively higher temperature and a more reduced environment might be triggered by the distribution of extensive tuff.
The Co/Ni ratio has been applied extensively to differentiating the various pyrite origins (Rao and Naqvi 1997;Monteiro et al. 2008; George et al. 2018). In two deposits,the Co/Ni ratios of Au-poor pyrites (mostly 0.01—0.1) and Au-rich pyrites (marked by dotted oval, mostly 0.1—1) are quite different (Fig. 11j). Nearly all pyrites have Co/Ni ratios <1, probably indicating a sedimentary fingerprint,as documented and proposed by previous authors (Chen et al. 2009; Li and Zeng 2005; Zhang et al. 2014a, b;George et al. 2018). And the ore-related pyrites of two deposits are plotted in similar area IV of Fig. 11e, suggesting that they were probably deposited from the homologous fluid system.
The complex geochemistry of pyrites suggests anomalous concentrations of different elements, which may be classified into three groups: (1) divalent cations, possibly involved in isovalent substitutions with Fe; (2) cations involved in heterovalent substitutions; and (3) anions replacing S (George et al. 2018). Divalent Co2+, Ni2+,Mn2+, and Cu2+directly substitute for Fe2+in pyrite(Grant et al. 2018). Cu2+and Zn2+also occur as chalcopyrite/sphalerite inclusions (Fig. 15). Monovalent Cu1+,Tl1+, Ag1+, Au1+and potentially Sb3+participate in coupled substitutions with two Fe2+cations, which is evidenced by the slightly positive correlation of Sb3+and Ag1+, Tl1+and Ag1+(Fig. 11d, l). Se2-and As1-substitute for sulfur,with Te problematically playing the roles of both anion (Te2-) and cation (Te4+) (George et al.2018). Though Pb2+is the least likely to be incorporated into the Fe-sulfide crystal lattice because of its large ionic potential (Z/r ratio) without inducing important structural strains (George et al. 2018), however, it is seldom present as micro-inclusions of galena or Pb-bearing sulfosalts. As discussed above, trace elements can also be micro/-nanophase particles (such as Au0) or chemically complex nanophases (Figs. 12, 13; Deditius et al. 2011; George et al. 2018). Thus, metal incorporation as structurally bound ions or nanophase particle-hosted minerals in pyrite is complex and needs further studies. And the systematic behaviour of trace elements is closely linked to the primary depositional conditions and hydrothermal fluid compositions (Grant et al. 2018).
5.4 Sources of S
Negative values (Py1a, - 53.3 to - 14.7‰, - 34.1‰ on average) is in good covariance with bacterial sulfate reduction (BSR) processes in a relatively open sea condition with sufficient SO42-supplements (Ohmoto 1972). And the variation is within the wide range of sulfur isotope fractionation (up to ~75‰) between the contemporary marine sulfate (~13‰ for Permian) and sulphide, which is produced via the microbial sulfate reduction (MSR) process predicted by previous environmental studies and models(Canfield et al. 2010;Sim et al.2011). However, the superheavy values of Py1b(73.7—114.8‰, 99.6‰ on average) and the large fractionation (Δ34Ssulfate-sulfide) have seldomly been recorded,might be related to the scarcity of preservation of deep-sea sediments (Sim et al. 2011), or the possibility triggered by the potential influence of Rayleigh fractionation in a relatively closed system.

Fig. 14 Sulfur compositions of Py2&Py3, Py4&Py5 from the Nibao deposit with the marine sulfate and sulfide curves (yellow and green boxes represent S isotope area of Py2&Py3 and Py4&Py5, respectively. Modified from Chang et al. (2008), Hou et al. (2016)

Fig. 15 A sketch illustration of the ore-forming processes of the platform-type CTGDs. Modified from Chen et al. (2018)
Data from Py2 and Py3 of the Nibao deposit, with medians of - 0.6 and 13.4‰, respectively plot within the area of S isotope compositions from biogenic and abiogenic sulfate reduction (Fig. 14, Hou et al. 2016), which indicates a relatively closed or not always open system.Comparatively, ore-related Py4 and Py5 of the Nibao deposit,with medians of 2.4 and 2.3‰,respectively,which implies a narrow ‘‘mantle-like’’ range.
Even so, such values can be deciphered from a sedimentary, metamorphic, or magmatic S source. Though a sedimentary origin can provide a wide range of δ34S values, the simple interpretation of the mixture of pre-ore pyrites may be farfetched but not precluded.And the fluidrock interaction between the fluids and sedimentary strata might not be neglected and probably also resulted in the decrease of δ34S values of the fluids (Chen et al. 2015b).The interaction of fluid and the unconformity rocks (e.g.,dominated Emeishan basalt, tuff or silicified limestone)might decrease the δ34S values of precipitated arsenopyrites or other sulfides, which is also appropriate to Nibao gold deposit (0.2‰) with some orebodies hosted in Emeishan basalt (Chen et al. 2015b), Qinglong Sb-Au deposit(average 1.9 ± 4.4‰for pyrites;Chen et al.2018),Getang Au deposit (1.9—8.4‰ for pyrites; Hu et al. 2018)and Shuiyindong Au deposit (average 3.1‰ for pyrites) in SW Guizhou province.
The exposed Triassic strata mostly have experienced low-grade regional burial metamorphism (anchizone to epizone), overlying Proterozoic low-grade metamorphic basement rocks(Wang et al.1995;Suo et al.1998;Su et al.2009b), which makes metamorphic origin a possible interpretation,together with the evidence of H—O isotopes.Though recent isotopic studies and geophysical surveys have documented the occurrence of concealed igneous rocks (Hu et al. 2017a, b; Liu et al. 2017; Jin 2017; Wei 2017), the magmatic origin has been discounted due to the deficiency of coeval igneous rocks adjacent to the mining area, which probably facilitates the interpretation of metamorphic/sedimentary origin from deep hydrothermal mineralization system (Fig. 15). According to the relatively homologous features of pyrite textures, distribution patterns of Au, geochemistry of fluid and sources of S discussed above, two deposits within platform facies point to the similar metallogenic system.
6 Conclusions
Different generations of pyrite have been recognized in the Nibao deposit, which exhibits distinct mineralogical, geochemical, and S isotopic features. In addition to the framboid and coarsely euhedral pyrite with negative δ34S values originated from bacterial sulfate reduction(BSR)processes in an open and sulfate-sufficient conditions, the super heavy pyrite indicates the potential influence of closedsystem Rayleigh fractionation or the lack of preservation of deep-sea sediments. The sulfur of pyrites during later sedimentation stages was derived by biogenic and abiogenic sulfate reduction in a relatively closed system and was near the contemporary values of seawater sulfate.However, the S of ore-related pyrite is not probably dominated by magmatic, but metamorphic or sedimentary origin from a deep source. It’s probably a new finding which supports the hydrothermal mechanisms aimed at CTGDs within platform facies in the Youjiang basin. Gold in orerelated pyrite is present as either nanoparticle partially or structurally bound. Our data support the notion that the fluids may be enriched not only in Au but also in As, Cu,Sb, Tl and S, suggesting a distal manifestation of deep hydrothermal mineralization systems.
AcknowledgementsThis study was funded by the National 973 Program of China (2014CB440906). We thank Guizhou Zijin Gold Mines for field work support. We are grateful to Ms. Dong Shaohua for SEM tests, Mr. Lin Peijun and Li Zengsheng for EPMA experiments, Mr. Zhang Jianchao and Mr. Hao Jialong for helping with NanoSIMS S isotope analyses, Mr. Gao Wei for helping with LAICP-MS analyses, Ms. Li Rui for FIB work and Dr. Liu Shirong for TEM tests, respectively. We acknowledge Dr. Wang Binbin and all the reviewers for their constructive reviews and considerate advices that led to great improvements of this paper.
杂志排行
Acta Geochimica的其它文章
- Equilibrium thallium isotope fractionation and its constraint on Earth's late veneer
- Kyanite far from equilibrium dissolution rate at 0-22 °C and pH of 3.5-7.5
- Quantifying the carbon source of pedogenic calcite veins in weathered limestone: implications for the terrestrial carbon cycle
- First-principles investigation of the concentration effect on equilibrium fractionation of Ca isotopes in forsterite
- Geological cycling of potassium and the K isotopic response:insights from loess and shales
- Adsorption characteristics of copper ion on nanoporous silica