Quantifying the carbon source of pedogenic calcite veins in weathered limestone: implications for the terrestrial carbon cycle
2019-09-06LinZouLinDongMengNingKangjunHuangYongboPengShujianQinHonglinYuanBingShen
Lin Zou · Lin Dong · Meng Ning · Kangjun Huang · Yongbo Peng ·Shujian Qin · Honglin Yuan · Bing Shen
Abstract The continent is the second largest carbon sink on Earth’s surface.With the diversification of vascular land plants in the late Paleozoic,terrestrial organic carbon burial is represented by massive coal formation, while the development of soil profiles would account for both organic and inorganic carbon burial.As compared with soil organic carbon, inorganic carbon burial, collectively known as the soil carbonate, would have a greater impact on the long-term carbon cycle. Soil carbonate would have multiple carbon sources, including dissolution of host calcareous rocks, dissolved inorganic carbon from freshwater, and oxidation of organic matter, but the host calcareous rock dissolution would not cause atmospheric CO2 drawdown. Thus, to evaluate the potential effect of soil carbonate formation on the atmospheric pCO2 level, different carbon sources of soil carbonate should be quantitatively differentiated. In this study, we analyzed the carbon and magnesium isotopes of pedogenic calcite veins developed in a heavily weathered outcrop, consisting of limestone of the early Paleogene Guanzhuang Group in North China. Based on the C and Mg isotope data, we developed a numerical model to quantify the carbon source of calcite veins. The modeling results indicate that 4–37 wt% of carbon in these calcite veins was derived from atmospheric CO2. The low contribution from atmospheric CO2 might be attributed to the host limestone that might have diluted the atmospheric CO2 sink. Nevertheless,taking this value into consideration,it is estimated that soil carbonate formation would lower 1 ppm atmospheric CO2 within 2000 years, i.e., soil carbonate alone would sequester all atmospheric CO2 within 1 million years.Finally,our study suggests the C–Mg isotope system might be a better tool in quantifying the carbon source of soil carbonate.
Keywords Mg isotope · Calcite veins · Pedogenic carbonate · Silicate weathering · Carbonate weathering✉Bing Shen bingshen@pku.edu.cn
1 Introduction
The Earth’s surface temperature is mainly controlled by the atmospheric pCO2level (Henkes et al. 2018). It is widely accepted that the long term greenhouse-icehouse climatic cycle was driven by the secular variation of the spreading rate of mid-ocean ridges (MOR) (Stanley and Hardie 1999).However,the variation of MOR spreading rate alone may not bracket the range of atmospheric pCO2level oscillation.For example,the Cretaceous atmospheric pCO2level was at least one order of magnitude higher than the present atmospheric level (Lee et al. 2013), but the MOR spreading rate was barely twice as fast as the modern value(Hardie 1996). Accordingly, a new model argues for the significance of continental arc magmatism and its associated metamorphic decarbonization of carbonate rocks (i.e.direct reaction between felsic magma and carbonate resulting in the formation of skarns)(Lee et al.2013;Shen et al. 2013). Thus, extremely high atmospheric pCO2level in Cretaceous might be the consequences of rapid spreading rate of MOR (Hardie 1996; Stanley and Hardie 1999),intense continental arc magmatism (Ague and Brimhall 1987; Ducea 2001; Lee et al. 2006), and frequent inceptions of large igneous provinces (Courtillot and Renne 2003; Kerr 1998; Sinton et al. 1998).
On the other hand, the atmospheric pCO2level is also controlled by the carbon sinks, including carbonate precipitation and organic carbon burial. The ocean is the largest active carbon inventory on the surface Earth (Hayes and Waldbauer 2006). The marine carbon reservoir is dominated by dissolved inorganic carbon (DIC) with the present concentration of 2 mM, while dissolved organic carbon(DOC)content is only 1/50 of the DIC level(Kump and Arthur 1999). The continent is the second largest carbon reservoir,which did not build up until the evolution of land plants, and the dramatic expansion of this carbon pool might be triggered by the diversification of vascular land plants in late Paleozoic (Beerling et al. 1998; Knoll and James 1987; Xue et al. 2015). Among various subsinks in the terrestrial system, the most noticeable one is coal deposit, which derived from the burial of land plants(Sundquist and Ackerman 2014). However, less attention has been paid to the terrestrial inorganic carbon sink.Carbonate deposited in the terrestrial environments includes,lacustrine carbonate,i.e.carbonate precipitated in lakes, and soil carbonate. As compared with soil organic carbon (SOC), soil inorganic carbon (SIC) might have played a more important role in the long term carbon cycle,because SIC has much longer residence time [SIC:78,000 years (Schlesinger 1985) vs. SOC: few hours to centuries (Hsieh 1993; Qualls and Bridgham 2005)].
Preferentially forming in a water deficit environment(Jenny 1980),soil carbonate is mainly composed of CaCO3in the form of calcite (Doner and Lynn 1989). Soil carbonate has been divided into three types (Zamanian et al.2016): (1) geogenic carbonate (GC), which derives from the aggregation of carbonate particles from soil parent material; (2) biogenic carbonate (BC) that is precipitated within animals and plants as part of their skeletons;and(3)pedogenic carbonate (PC), which is generated in soil via dissolution of the soil inorganic carbon. In addition to calcareous host rocks, the potential carbon sources of soil carbonate also include remineralization of organic matter and dissolved inorganic carbon (DIC) in freshwater (including river water, groundwater, precipitation), both of which source from atmospheric CO2. Thus, soil carbonate precipitation tends to lower the atmosphere pCO2level.
In order to understand the terrestrial carbon cycle, it is necessary to differentiate the carbon sources of soil carbonate. Traditionally, carbon and oxygen isotopes of soil carbonate have been used to infer paleo-precipitation and paleovegetation (Lee and Hisada 1999). Element compositions, e.g., Mg/Ca and Sr/Ca ratios, of microcodium have been applied as proxies for paleo-precipitation (Li and Li 2014). In addition, the strontium–neodymium (Sr–Nd) isotope system has been used to constrain the origin of carbonate nodules in soil (Dietrich et al. 2017). In this study, we measured carbon and magnesium isotopes of calcite veins developed in a heavily weathered limestone outcrop of the early Paleogene Guanzhuang Group in North China. Then a numerical model is setup to quantify the carbon sources of calcite veins.There are three reasons to use Mg isotope:(1)Mg is a major element in continental crusts, and Mg2+readily replaces Ca2+in carbonate minerals (Machel 2004); (2)Mg isotopic composition differs greatly in different Mg sources on surface Earth, allowing the application of Mg isotope to trace the Mg source (Teng 2017); and (3) Mg isotope is not affected by organic matter, and thus it is independent of organic carbon.
2 Geological background and sample description
The Paleogene succession in the southwestern Shandong Province is represented by the Guanzhuang Group, which consists of, in ascending order, the Gucheng, Bianqiao,Changlu, Zhujiagou and Dawenkou formations (Chi et al.1994). The Guanzhuang Group is mainly composed of reddish gray siltstone and argillaceous limestone, representing the deposition in lacustrine-alluvial-fluvial environments.The Guanzhuang Group is widely outcropped in the Pingyi and Mengyin basins. The studied section (E 117°44′19′′,N 35°32′46′′)is located ~18 km northeast of the Pingyi county (Fig. 1).
Abundant calcite veins are developed at a highly weathered outcrop. The bedrock is composed of red limestone (Fig. 2). Six calcite veins were cataloged(Fig. 2). They are sub-parallel to each other, and are perpendicular to the bedding plane. Each vein has a constant width of about 1–2 cm.Totally 32 samples were collected,including 13 of the host rock and 19 of calcite veins. Thin section observations indicate that the host rock is mainly composed of micrite with some quartz grains (3–21 wt%)(Fig. 3b). Some host rock samples were partially dolomitized. The XRD analyses indicate that the host rock contains 4–15 wt% of dolomite (Table 1). Calcite veins are mainly composed of micrite (95 wt%) with rare occurrences of detrital quartz (3–5 wt%). No dolomite is detected in the calcite veins (Table 1).

Fig. 1 A simplified geological map of the Pingyi Basin,Shandong Province (modified from Li et al. 2016). The sampling locality is marked by the red star
3 Methods
3.1 Sample preparation
Samples were sliced to prepare a thin section for petrographic observation and a mirrored thick section for sampling. Sample powders (about 100 mg for each sample)were collected by using a hand-held micro-drill.Under the guidance of petrographic observation of thin sections, late diagenetic/hydrothermal veins or regions with recrystallization were avoided in the sampling procedure.
3.2 Mineralogical composition analysis
The mineralogical compositions of bulk samples were analyzed on a PANalytical X’Pert ProMPD X-ray Diffractometer (XRD) at Peking University. X-ray was generated from a Cu source with the working voltage of 40 kV and current of 40 mA. Mineral phases were identified from the peak position, while the mineralogical concentrations (in unit of wt% with respect to the sum of all identified minerals) were quantitatively determined by measuring the integrated areas within peaks.
3.3 Elemental composition analysis
Major and minor element compositions were analyzed at Peking University by using a Spectro Blue Sop inductively coupled plasma optical emission spectrometer (ICP-OES)fitted with a Water Cross-flow nebulizer. Approximately 10 mg of sample powder was dissolved in 10 mL 0.5 N Acetic acid. After complete dissolution in an ultrasonic bath,the solution was centrifuged for 10 min at 3000 rpm.The supernatant was collected for the element composition determination. All analyses were calibrated by a series of gravimetric standards with different concentrations (ranging from 0.1 to 10 ppm) that were run before and after every twenty sample measurements. The external reproducibility for the major and minor elements (Na, Mg, Al,K, Ca, Fe, Mn, Sr) is ± 5‰ (Peng et al. 2016).
3.4 Carbon and oxygen isotope analysis
δ13C and δ18O were measured at Oxy-Anion Stable Isotope Consortium (OASIC) at Louisiana State University. Sample powder(about 0.5–1 mg for each) was loaded in a vial and reacted with anhydrous H3PO4at 72 °C for about 10 min in a heating block of Gas Bench II on-line with Delta V advantage gas source mass spectrometer. All isotopic ratios are reported in the δ-notation as per mil (‰)deviation with respect to the Vienna-Pee Dee Formation belemnite (VPDB) standard. The analytical precision was better than 0.05% for δ13C and 0.1% for δ18O.
3.5 Mg isotope analysis
Magnesium isotopic composition (δ26Mg) were measured at the State Key Laboratory of Continental Dynamics,Northwest University, China. 100 mg powder sample was dissolved by 10 mL 0.5 N acetic acid in a centrifuge tube,which was placed in an ultrasonic bath for 30 min to extract the carbonate component. After centrifugation at 3000 rpm for 10 min,the supernatant was collected for Mg isotope analyses.
Mg was purified by cation exchange chromatography following the method reported in previous studies (Peng et al.2016;Shen et al.2009).Two column procedures were applied to separate Mg from other matrix metals. Column#1 loaded with 2 mL Bio-Rad 200–400 mesh AG50W-X12 resin was designated to separate Mg from Ca. After conditioning with 6 mL 10 N HCl, a sample solution containing 25–30 μg Mg was loaded into the Column #1 and was eluted by 5 mL 10 N HCl. The collected eluent was dried down in a hotplate.The residue was first dissolved in 0.5 mL 1 N HNO3+ 0.5 N HF, and then was loaded into Column #2, which was loaded with 0.5 mL Bio-Rad AG50 W-X12 resin. The column #2 was used to separate Mg from all other matrices(e.g.,Na,Al,Fe,K,Ti),and Mg was collected by 3 mL 6 N HCl. To guarantee complete removal of matrix elements,two passes of column#1 were followed by two processes of column#2.After a complete procedure of column chemistry, Na/Mg, Al/Mg, Ca/Mg,K/Mg and Ti/Mg of purified solutions are less than 0.05,and the Mg yield after the column chemistry was closed to 100%.

Fig. 2 Field photograph of the studied outcrop.Numbers 1–5 indicate the stratigraphy of host rock and white lines(A–F)remark the cataloged calcite veins. a Calcite vein; b Host rock

Fig. 3 Photomicrographs and XRD spectrums of calcite vein and host rock. a Calcite vein; b Host rock without dolomite; c Host rock with partial dolomitization
Mg isotopes were analyzed by using a Nu Plasma II MC-ICP-MS. Mg isotopic ratios are reported in the δ-notation as per mil (‰) deviation relative to the DSM-3 standard (Galy et al. 2003). The long-term external reproducibility is better than 0.06‰ (2 SD). The whole procedure blanks are typically less than 10-4V,negligible to the sample signals of 3–4 V.Data qualities were monitored by two international basalt standards (BHVO-2 and BCR-2)and two well-characterized in-house standards (GSB-Mg and Seawater) (Table 1). The measured δ26Mg values of standards are consistent with previously published data(Huang et al.2015;Opfergelt et al.2012;Peng et al.2016;von Strandmann et al. 2011; Teng et al. 2015).
4 Results
Carbon, oxygen and Mg isotope data as well as elemental compositions are tabulated in Table 1. The Mg three-isotope cross-plot and Mg/Ca–δ26Mg cross-plots are presented in Figs. 4 and 5, respectively. The calcite veins and host rock have different δ26Mg and Mg/Ca ratios.δ26Mg of the calcite veins ranges from - 2.97 to - 4.78‰(average = - 4.17‰, n = 19), while the Mg/Ca ratio varies between 0.006 and 0.019 (average = 0.009, n = 19). In comparison, the host rock samples have slightly higher δ26Mg values, ranging from - 2.19 to - 4.66‰ with an average value of - 3.67‰ and higher Mg/Ca ratio (ranging from 0.007 to 0.101, average = 0.03, n = 13). δ13C of the calcite veins varies between - 3.05‰ and - 5.80‰(average = - 4.17‰, n = 19), while δ18O ranges from- 5.77 to - 8.58‰ (average = - 6.98‰, n = 19). Mn contents of calcite veins and host rock samples range from 13 to 249 ppm(average = 47 ppm,n = 19)and from 27 to 795 ppm (average = 256 ppm, n = 13), respectively. Sr concentration varies between 18 and 58 ppm (average = 30 ppm,n = 19)for the calcite veins and between 25 and 197 ppm(average = 82 ppm,n = 13)for the host rock(Table 1).

Table 1 Isotope, elemental and mineral compositions of calcite veins and host rock in Guanzhuang group
5 Discussions
5.1 Constrain the carbon source of calcite veins
The pedogenic carbonate formation can be described in three steps, (1) dissolution of calcareous material of host rock, (2) migration of dissolved ions with/without mixing with exogenic ions, and (3) re-precipitation at supersaturation with/without the aid of microbial activities (Zamanian et al. 2016). Depending on the relative locations of host rock carbonate dissolution and pedogenic carbonate precipitation, two models have been proposed. The perdescendum model suggests that the dissolution of host rock carbonate occurs in the topsoil, followed by the downward leaching and re-precipitation of pedogenic carbonate in the subsoil (Gile 1966; Royer 1999). In contrast,the ‘perascensum’ model proposes that the dissolution occurs in subsoil, and the upward migration of ions is driven by the capillary effect or the fluctuations of the groundwater water table, resulting in the precipitation of pedogenic carbonate near or even at the soil surface(Curtis 2007). These two models demonstrate the different direction of ion migration as well as the locality of pedogenic carbonate formation.Nevertheless,dissolution of host rock calcareous content may not be the only source of pedogenic carbonate, instead some exogenic carbon sources might have been involved. At least part of exogenic carbonate was directly or indirectly derived from atmospheric CO2.Below, we develop a numerical model, by using carbonate C and Mg isotopes as two proxies, to quantify the carbon sources of calcite veins.

Fig. 4 δ26Mg versus δ25Mg cross-plot for samples and standards
5.1.1 Model description
Pedogenic carbonate might have three carbon sources:dissolution of carbonate in host rock, dissolved inorganic carbon(DIC)in groundwater/river water/precipitation,and oxidation of organic matter, while Mg in pedogenic carbonate could source from the host rock carbonate and groundwater/river water/precipitation (rainwater). Among the three possible external Mg sources, precipitation contains a negligible amount of Mg, while Mg isotopic composition of river water and groundwater is affected by the intensity of chemical weathering. Thus, the isotopic compositions (for both C and Mg) are determined by the mixing of different sources. The carbon isotopic composition of calcite veins (δ13Cvein) can be calculated by the following equation:

where h is the mass fraction of carbon sourced from organic matter, and the subscripts inorganic and organic denote the inorganic and organic carbon sources, respectively. The inorganic carbon source includes carbonate in host rock and dissolved inorganic carbon (DIC) from river water/groundwater/precipitation. δ13Cinorganicand δ26-Mginorganiccan be described by the following equation:

where Miis the mass of component i; mCi(wt%) and mMgi(wt%) are the C and Mg concentrations in component i;δ13Ciand δ26Mgiare the C and Mg isotopes of component i; Δcalis the Mg isotopic fractionation in calcite precipitation.
Both the concentration and isotopic composition of host rock dissolution are controlled by host carbonate rock.The elemental concentration and isotopic composition of groundwater and river water are determined by the intensity of chemical weathering, which controls the relative fraction of carbonate and silicate dissolution(or the degree of congruent dissolution), while precipitation (rain) only contains C that derives from atmospheric CO2.To quantify the composition of groundwater or river water, we use the following mass balance equations:

where subscript j indicates the carbonate or silicate dissolution in chemical weathering.To simplify the calculation,we further define the parameter k to indicate the mass ratio between the dissolved calcareous host rock and exogenic fluid,and the parameter f represents the mass ratio between dissolved silicate and carbonate in chemical weathering.
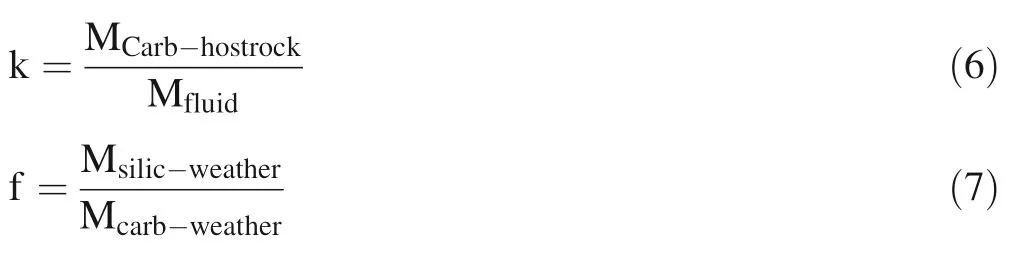

Fig. 5 Cross plots of elemental and isotope data for calcite vein and host rock samples.a δ13C versus δ26 Mg;b δ18O versus δ13C;c Sr content versus δ13C; d Mn content versus δ13C; e Mg/Ca versus δ26Mg; f Mn/Sr versus δ26Mg
5.1.2 Parameter setting
The default parameters are tabulated in Table 2. Here we used the average value of organic carbon isotope of the host rock to represent δ13Corganic(- 28‰), and organic matter oxidation would generate13C-depleted DIC. Experimental studies indicate that the Mg isotopic fractionation during Cacarbonate mineral precipitation depends on mineralogy (i.e.aragonite,high-Mg calcite,and low-Mg calcite),temperature,and precipitation rate.The estimated isotopic fractionation for inorganic low-Mg calcite precipitation (Δ26Mgcalcite–fluid)ranges from - 3.3 to - 1.6‰ (Immenhauser et al. 2010; Li et al. 2012; Mavromatis et al. 2013; Saulnier et al. 2012).Here, Δcalis set to - 2.0‰.

Table 2 Default parameters used in the simulation
For the host rock end member,we use that the measured elemental and isotopic compositions of host rock:mCcarb-hostrock(wt%) = 9.48%; δ13= - 4.11‰;m(wt%) = 0.79%; δ26=- 3.67‰.There is a wide range of variation of river water Mg concentration, varying between <1 ppm and 50 ppm with an average concentration of 4 ppm (Holland 1978;Livingstone 1963). Here, we assume that mis 4 ppm.
DIC concentrations of the Yangtze River and the Yellow River range from 0.3 to 2.5 (average = 1.9) mmol/L (Li et al. 2010a), and from 2.7 to 4.4 (average = 3.4) mmol/L(Su et al. 2006), respectively. Since the sample locality is in the Yellow River Drainage, here we use the average Yellow River DIC concentration as the default value, i.e.m= 3.4 ppm.
We further assume that C and Mg in the fluid is a mixture of weathered silicates and carbonates. δ26Mg for silicates weathering is closed to the mantle value of- 0.22‰ (Li et al. 2010b), but recent studies indicate that Mg isotopes can fractionate during secondary clay mineral formation that preferentially scavenges26Mg (von Strandmann et al. 2012; Tipper et al. 2006a; Wimpenny et al. 2010). Thus, the river water δ26Mg might be lower than the silicate values. However, we speculate that the effect of clay mineral formation might be small, given the limited difference (~0.3‰) between shale and silicate minerals (Young and Galy 2004).
The Mg isotopic composition of carbonates displays a wide range of variation,ranging from- 0.8 to- 2.8‰for dolostone and from - 2.5 to - 4.5‰ for limestone (Galy et al. 2002; Higgins and Schrag 2010; Tipper et al. 2006b;Wombacher et al. 2011). Because dolostone has orders of magnitude higher Mg content than limestone, we assign- 2.25‰ (the average values for dolostone) for carbonate dissolution in continental weathering (Higgins and Schrag 2015). In addition, we choose the upper continental crust composition, i.e. MgO = 2.48 wt% (Rudnick and Gao 2014), as the Mg content in silicate weathering,mwt%) = 1.49%.

Fig. 6 The modeling result based on the default parameters(see Table 3).The solid contour lines represent the mass ratio between silicate and carbonate weathering (f), the dash lines refer to mixing mass ratio between host rock dissolution and exogenic fluid (k). The modeling result shows that f ranges from 0.3 to 2, and k varies between 5 × 10⁻⁵ and 5 × 10⁻⁴

Fig. 7 Sensitivity tests of h(the mass fraction of carbon sourced from organic matter,the default value is 2%).a h = 0%;b h = 5%;c h = 7%
Based on the formula of silicate weathering,1 mol CO2would dissolve 1 mol Si in silicate weathering. The SiO2concentration of upper continental crust is 66.6% (wt%)(Rudnick and Gao 2014),thus we set(wt%)as 13.32%.Since bicarbonate produced in silicate weathering is exclusively derived from atmospheric CO2,δ13equals to the isotopic composition of atmospheric CO2of - 7‰ (Affek and Yakir 2014).

Fig. 8 Sensitivity tests of mMgfluid [Mg concentration in fluid, the default value is 4 ppm (range 1–50 ppm)] and mC fluid [C concentration in fluid, thedefault value is 40.8 ppm (range 32.4–52.8 ppm)]. a mMg fluid = 1 ppm; b mMg fluid = 10 ppm; c mC fluid = 32.4 ppm; d mC fluid = 52.8 ppm
We further use the weighted average concentration of global limestone and dolomites to refer to mCcarb-weatherand mMgcarb-weather.The volume of carbonates account for 34%of global sediments, more specifically, limestone and dolostone account for 22% and 12%, respectively (Given and Wilkinson 1987). We further assume that the limestone is composed of CaCO3with negligible Mg content and C content of 12 wt%, while dolostone contains 13 wt% of Mg and 13 wt%of C.Hence,the following parameters can be estimated as follows: mCcarb-weather= 12.35 wt% and mMgcarb-weather= 4.60 wt%. Moreover, the average δ13C value of carbonate sediments is around 0‰ (Affek and Yakir 2014), and there is no isotopic fractionation during carbonate dissolution(Liu et al.2014;Tipper et al.2006b).Thus, δ13Ccarb-weather= 0‰.
5.1.3 Modeling results
By using the default parameters listed in Table 2, the δ26-Mgvein–δ13Cveincross-plot illustrates the mixing between the host rock component and the fluid component,the latter of which is directly related to the intensity of chemical weathering (Fig. 6). The solid contour lines represent the weathering mass ratio between silicate and carbonate (f),while the dash lines refer to the mass ratio between host rock and fluid (k). By plotting the measured calcite vein data into the diagram, f ranges from 0.3 to 2, and k varies between 5 × 10⁻⁵and 5 × 10⁻⁴.Considering the possible addition of organic carbon derived DIC, to explain the calcite vein data, we tentatively assign h = 2%, i.e. 2% of carbon in calcite veins comes from organic matter degradation.
The mass ratios (f and k) can be translated to the elemental mass ratio of C and Mg. In the low weathering intensity scenario, i.e. k = 5 × 10⁻⁵, f = 0.3, the silicate weathering contributes 2.34% of C as compared with 7.23%from carbonate weathering,while 88.43%of carbon derived from host rock dissolution. On the other hand,0.33%, 3.43% and 96.24% of Mg come from silicate weathering, carbonate weathering and host rock dissolution, respectively (Table 3).
In the high weathering intensity scenario, i.e.k = 5 × 10⁻⁴, f = 2, the silicate weathering would have the maximum contribution. Silicate weathering, carbonate weathering and host rock dissolution would contribute 35.36%,16.39%and 46.25%of C,and 7.97%,12.31%and 79.72% of Mg, respectively (Table 3).
5.1.4 Sensitivity test
Since the modeling result could be affected by the selections of loosely constrained parameters, to constrain the parameter range under the premise that the model is applicable, we rerun the model by fixing all other parameters except for the tested one, the results are illustrated in Figs. 7, 8, 9 and 10 and Table 4.
We adjust the organic matter proportion to verify the rationality of the initial default value of 2% (Fig. 7). The modeling result indicates that there is an upper limit of 7%,that is to say,the range of organic matter proportion should be less than 7%.

Fig. 10 Sensitivity tests of Δcal (isotopic fractionation during calcite precipitation,the default value is-2‰(range- 3.5 to- 1.6‰),the lower limit under the model is - 2.2‰
Mg concentration in fluid ranges from <1 to 50 ppm(Holland 1978;Livingstone 1963),and the default value is 4 ppm. We rerun the model by varying(Fig. 8a, b).
When Mg concentration in fluid reached 10 ppm, themodel is not applicable,which means Mg concentration in fluid should range from 1 to 10 ppm.


Table 3 Simulation results

Table 4 Sensitivity test
C concentration in fluid(mCfluid)is reported between 32.4 and 52.8 ppm(Su et al.2006),and the default value is set to 40.8 ppm. When mCfluidvaried between the aforementioned range,the result is not significantly affected(Fig. 8c,d).
The δ26Mg value of weathered silicate(δ26is allowed to vary between - 0.52 and 0.92‰ (Li et al.2010b) and the default value is - 0.22‰. The modeling result is not sensitive to this parameter(Fig. 9a,b).
The δ26Mg value of the weathered carbonate(δ26ranges from - 0.8 and - 2.8‰ for dolomite and- 2.5 to- 4.5‰for limestone(Higgins and Schrag 2015)and the default value is- 2.25‰.Our model suggests that the upper limit of δ26is - 0.8‰ and the lower limit is - 2.5‰ (Fig. 9c, d). The model will be not applicable when δ26>-0.8‰or <-2.5‰.
The isotopic fractionation during calcite precipitation(Δcal) is allowed to fluctuate between - 3.5 and - 1.6‰(Immenhauser et al.2010;Li et al.2012;Mavromatis et al.2013; Saulnier et al. 2012) and the default value is - 2‰.The model is sensitive to Δcal, and it suggested the lower limit of Δcalis - 2.2‰ (Fig. 10).
5.2 Implication for the terrestrial carbon cycle
The modeling results indicate that the host calcareous rocks are the major carbon source of calcite veins, while the contribution from silicate weathering varies between 2.34 and 35.36% (Table 3). The long term effect of silicate weathering is to draw down atmospheric pCO2level,while carbonate weathering does not affect pCO2(Goudie and Viles 2012). In addition, plants absorb atmospheric CO2and generate organic matter through photosynthesis, and thus DIC derived from organic matter degradation is also sourced from (near) contemporaneous atmospheric CO2.
In the process of calcite vein formation, both decomposition of organic matter and silicate weathering draw down atmospheric CO2. That is to say, there is 4–37% of carbon coming from contemporaneous atmospheric CO2in total. Therefore, the formation of calcite veins may have a significant impact on the global C cycle in some cases.
Below we make a further estimation of the potential effect of soil carbonate formation on the atmospheric pCO2level. Since it’s difficult to distinguish between pedogenic carbonate and other types of carbonate in soil (Mermut et al. 2000), we use the stocks of SIC in the soil as the maximum estimate of pedogenic carbonate C,which is 160 Pg C in the top 30 cm (Nieder and Benbi 2008). Average rates of soil erosion under natural, non-cropped conditions have been documented to be less than 1.9 Mg ha-1year-1,which balanced with soil formation rate. In addition, we assume a soil bulk density of 1.25 Mg/m3(Nearing et al.2017). The atmosphere contains 800 Pg C (Hancock et al.2019) and the average concentration of atmospheric CO2reached 400 ppm since 2014.
As stated above,there is 4–37%of carbon coming from atmospheric CO2for pedogenic carbonate, it needs to generate 2 Pg C in pedogenic carbonate to draw down 1 ppm atmospheric CO2. According to our calculation,there is 0.027 Pg C sequestered in pedogenic carbonate at most per year globally, that is to say, it may only take 200–1850 years to lower 1 ppm atmospheric CO2depending on pedogenic carbonate formation.In the word,soil carbonate formation alone would consume all atmospheric CO2within 1 million years.
It should be noted that, since the calcite veins were generated in calcareous host rocks, which may provide abundant DIC via carbonate dissolution. However, for calcite veins developed in carbonate-free lithologies, such as sandstone and various igneous rocks,without the carbon supply from host rock dissolution, the atmospheric CO2might be a more important carbon source for pedogenic carbonate formation.
Finally, our study suggests that the carbon source of pedogenic carbonate could be better constrained by the combination of C and Mg isotopes. Thus, the C–Mg isotope system may be used to quantify the carbon source of the pedogenic carbonate.
6 Conclusions
In order to constrain the carbon source of calcite veins developed in host Paleogene limestone, here we measured Mg and C isotopes of calcite veins and host rocks.Then,a binary mixing model by using δ13C and δ26Mg as two independent proxies were developed. The modeling result indicates that about 4–37% of carbon comes from atmospheric CO2, while the dissolution of calcareous host rock contributes a majority fraction of C.We further speculated that it may only take 200–1850 years to lower 1 ppm atmospheric CO2through pedogenic carbonate formation.Thus, we recommend a combination of C and Mg isotope systems, which may provide a better constraint on the C source of the pedogenic carbonate.
AcknowledgementsWe thank Yiwu Wang and Yuhan Wang of Peking University, for their assistance in the field and sample collection. This study is funded by the National Key Technology Program during the 13th Five-Year Plan Period (Grant No.2016ZX05034001-007) and National Natural Science Foundation of China (Grant No. 41772359).
杂志排行
Acta Geochimica的其它文章
- Equilibrium thallium isotope fractionation and its constraint on Earth's late veneer
- Kyanite far from equilibrium dissolution rate at 0-22 °C and pH of 3.5-7.5
- First-principles investigation of the concentration effect on equilibrium fractionation of Ca isotopes in forsterite
- Geological cycling of potassium and the K isotopic response:insights from loess and shales
- Adsorption characteristics of copper ion on nanoporous silica
- Metallogenic controls on the granite-related W-Sn deposits in the Hunan-Jiangxi region, China: evidence from zircon trace element geochemistry