Growth arrest-specific gene 2 suppresses hepatocarcinogenesis by intervention of cell cycle and p53-dependent apoptosis
2019-09-05RanXuZhuAlfredSzeLokChengHenryLikYuenChanDongYeYangWaiKaySeto
Ran-Xu Zhu, Alfred Sze Lok Cheng, Henry Lik Yuen Chan, Dong-Ye Yang, Wai-Kay Seto
Abstract BACKGROUND Growth arrest-specific gene 2 (GAS2) plays a role in modulating in reversible growth arrest cell cycle, apoptosis, and cell survival. GAS2 protein is universally expressed in most normal tissues, particularly in the liver, but is depleted in some tumor tissues. However, the functional mechanisms of GAS2 in hepatocellular carcinoma (HCC) are not fully defined.AIM To investigate the function and mechanism of GAS2 in HCC.METHODS GAS2 expression in clinic liver and HCC specimens was analyzed by real-time PCR and western blotting. Cell proliferation was analyzed by counting, MTS, and colony formation assays. Cell cycle analysis was performed by flow cytometry.Cell apoptosis was investigated by Annexin V apoptosis assay and western blotting.RESULTS GAS2 protein expression was lower in HCC than in normal tissues.Overexpression of GAS2 inhibited the proliferation of HCC cells with wide-type p53, while knockdown of GAS2 promoted the proliferation of hepatocytes (P <0.05). Furthermore, GAS2 overexpression impeded the G1-to-S cell cycle transition and arrested more G1 cells, particularly the elevation of sub G1 (P <0.01). Apoptosis induced by GAS2 was dependent on p53, which was increased by etoposide addition. The expression of p53 and apoptosis markers was further enhanced when GAS2 was upregulated, but became diminished upon downregulation of GAS2. In the clinic specimen, GAS2 was downregulated in more than 60% of HCCs. The average fold changes of GAS2 expression in tumor tissues were significantly lower than those in paired non-tumor tissues (P < 0.05).CONCLUSION GAS2 plays a vital role in HCC cell proliferation and apoptosis, possibly by regulating the cell cycle and p53-dependent apoptosis pathway.
Key words: Growth arrest-specific gene 2; Cell cycle; Apoptosis; Hepatocellular carcinoma; p53-dependent signaling pathway
INTRODUCTION
Liver cancer is currently one of the most common causes of cancer-related deaths globally. Liver cancer has become a major health problem in developing countries,where the highest incidence and mortality rates are in Eastern and Southeastern Asia and parts of Africa[1,2]. Particularly, approximately 50% of liver cancer cases and deaths worldwide are in China. Among these, hepatocellular carcinoma (HCC)accounts for about 70% to 90% of liver cancers worldwide[3,4]. The prognosis of HCC is poor with high mortality because of limited effective treatment options[5].
Growth arrest-specific (GAS) genes encode proteins implicated directly in reversible growth arrest. This family contains seven genes (GAS1-GAS7) that encode proteins exhibiting distinct biochemical properties[6-8]. Among these genes, the protein encoded by GAS2 is a cell death substrate of caspase-3 that exerts some effects on modulating microfilament and cellular morphological variation during apoptosis[9,10].Through microfilament alterations regulated by GAS2, the actin cytoskeleton and cell shape are quickly reset to respond to growth arrest induced by environmental stimuli such as apoptosis, different proliferative stimuli with various growth factors.Therefore, GAS2 as a component of the microfilament system functions in mitogenesis, cell cycle, cell growth, apoptosis, and cell survival.
GAS2 protein is broadly expressed in many normal tissues, and is particularly highly expressed in the liver; however, it is not expressed in some tumor tissues such as prostate and breast[11,12]. Although it has a potentially important role in cell survival,the role of GAS2 in HCC is largely unexplored. We hypothesized that GAS2 possesses anti-oncogenic properties in HCC cells.
MATERIALS AND METHODS
Patients and clinical specimens
Clinical liver specimens were derived from 54 HCC patients with surgical treatment at The University of Hong Kong-Shenzhen Hospital (Guangdong Sheng, China).
HCC tissue samples were obtained from curative hepatic tumor resection except for necrotic and hemorrhagic areas. The paired adjacent non-tumor tissues were more than 5 cm away from the tumor edge, where was estimated to have no tumor invasion. All tissue samples were snap-frozen immediately after resection and stored in a -80°C nitrogen canister until use. This study was executed according to the ethical guidelines of the 1975 Declaration of Helsinki and was authorized by the Institutional Review Boards at The University of Hong Kong-Shenzhen Hospital [(2014)84]. All HCC patients provided signed informed consent giving approval for the use of clinical specimens for research purposes.
Human liver and HCC cell culture
Human normal liver cell lines (LO2 and MIHA) and HCC cell lines (SK-Hep1, PLC5,Huh 7, and Hep3B) were obtained from the American Type Culture Collection(Manassas, VA, United States). All cells were routinely maintained in high-glucose Dulbecco's Modified Eagle's medium (Gibco, Gaithersburg, MD, United States) with 100 mL/L fetal bovine serum (Thermo Scientific HyClone, Buffalo, NY, United States)and 10 mL/L MEM Non-Essential Amino Acids (Gibco) at 37°C in a humidified incubator containing 50 mL/L CO2.
Quantitative real-time polymerase chain reaction
A total of 1 μg RNA sample extracted from samples by TriZol reagent (Invitrogen,Carlsbad, CA, United States) was mixed with DNase I (Invitrogen) and then synthesized to cDNA by SuperScript II reverse transcriptase (Invitrogen).Quantitative real-time PCR (qPCR) was performed on the 7500 Real-Time PCR System apparatus (Applied Biosystems, Framingham, MA, United States) to detect gene transcripts in the cDNA template mixed with SYBR Green (Applied Biosystems).The relative mRNA level of GAS2 (F5'-TG CAAATGCCCAAACAAGTTC-3'; GAS2-R5'-TTCTCCCACTCGGTATCTTCC TT-3') was evaluated by relative quantification of an internal control gene expression based on a similar amplification efficiency.Statistical analyses were carried out by the two-tailed t-test.
Plasmid transfection
pDEST40-GAS2 and pDEST40-CTRL were given by Prof. Yutaka Kondo (Nagoya,Japan)[10]. A density of 1-3 × 10⁵cells per well were seeded in a 6-well plate overnight to achieve 60%-80% confluency. Plasmids were transfected into cells using FuGene 6 reagent (Roche, Basel, Switzerland) at a ratio of 1:3 as per the manufacturer's instructions. The transfected cells were incubated daily for 3 d. The optimal transfection efficiency was monitored in 2 d.
RNA interference and transfection
According to the manufacturer's (HiPerfect; QIAGEN, Hilden, Germany) protocols,50 nM small interfering RNAs (siRNAs) against GAS2, 100 nM siRNAs against p53(ON-TARGET plus SMART pool; Thermo Fisher Scientific Ltd., Waltham, MA, United States), and a control sequence (siCtrl: 5'-UUCUCCGAACGUGUCACGU-3') were transfected into the cell samples. These transfectants were added into a mixture of 100 μL serum-free culture medium with 12 μL transfection reagent (Hiper-Fect) and cultured daily for 3 d. The optimum interference efficiency was observed in 2 d.
Western blot analysis
Total protein lysates from tissue and cell samples were extracted by T-PER Tissue Protein Extraction Reagent (Thermo Fisher Scientific) and lysis buffer containing a protease inhibitor cocktail (Roche), respectively. The protein concentration was measured by the Bradford method (Bio-Rad Laboratories, Hercules, CA, United States). Protein lysates (50 μg) were separated on an SDS-PAGE gel, and then transferred onto polyvinylidene difluoride membranes for western blot analysis. The various antibodies used were mouse anti-GAS2, mouse anti-P53, mouse anti-β-actin(Santa Cruz Biotechnology, CA, United States), rabbit anti-poly (ADP-ribose)polymerase (PARP), and rabbit anti-caspase3 (Cell Signaling Technology, Danvers,MA, United States). Signals were quantified by scanning densitometry.
Cell proliferation assay
Cell proliferation was assessed by the cell counting and MTS assays (Promega Biotech Co., Ltd., Madison, WI, United States). In cell counting, the number of cells was measured by Trypan blue dye exclusion daily for 5 consecutive days. In the MTS experiment, the cells subject to different transfections were incubated in a 96-well plate sextuplicate for 5 consecutive days. In daily counting, the MTS mixture with 100 μL fresh culture medium and 20 μL MTS solution was added into the cultured cells.The absorbance of the colorimetric products formed was determined by the Quant
Microplate Spectrophotometer (BioTek Instruments, Inc., Winooski, VT, United States) at a 490 nm wavelength. All data were determined from three independent experiments.
Colony formation assay
The cells transfected with the labeled plasmids by FuGene 6 reagent was incubated in 6-well plates for 2 wk in G418-selective medium (Invitrogen Life Technologies,Carlsbad, CA, United States). The formative drug-resistant colonies stained by 2 mL/L crystal violet were counted under the microscope. All experiments were performed in three independent experiments.
Cell cycle analysis
Collected cell pellets fixed inice-cold 700 mL/L ethanol-phosphate-buffered saline were stained with propidium iodide solution (50 μg/mL, Sigma-Aldrich, St. Louis,MO, United Stated). Cellular DNA content was measured by a flow cytometer with fluorescence-activated cell sorting (FACS) caliber (BD Biosciences, San Jose, CA,United States). The cell cycle profiles were analyzed using WinMDI2.9 software(WinMDI Version 2.9-Windows 3.95/DOS 5.0) in three independent experiments.
Annexin V apoptosis assay
After treatment, cells collected were mixed with 5 μL Annexin V-APC and 5 μL 7-AAD according to the protocol of the APC Annexin V Apoptosis Detection Kit I (BD Pharmingen). Finally, the abovementioned mixture was added into 400 μL of 1×binding buffer and measured by flow cytometry in 1 h. These data were analyzed by WinMDI 2.9 software.
Statistical analysis
The data of cellular proliferation, cell cycle distribution, colony formation, apoptosis,and gene expression were determined by the independent Student's t-test. The clinical relevance of GAS2 expression in HCCs and the matched non-tumorous liver tissues was analyzed by the non-parametric Wilcoxon's matched pairs test. Scatterplot and related statistical analyses were performed using GraphPad Software (version 5.0). P values less than 0.05 were considered statistically significant.
RESULTS
Identification and analysis of GAS2 expression in HCC
To investigate the roles of GAS2 in HCC, we first examined GAS2 expression in the liver normal and tumor tissues and its related cell lines. We found that GAS2 was highly expressed in most normal liver tissues and MIHA hepatocytes, while GAS2 was depleted in most tumor tissues and some HCC cell lines such as Huh7, PLC5, and SK-hep1 cells, with the exception of Hep3B (Figure 1A).
Ectopic overexpression of GAS2 suppresses HCC cell proliferation
To further explore the functions of GAS2 in HCC development, we investigated the effect of ectopic expression of GAS2 on cell proliferation. We overexpressed GAS2 in HCC cells without endogenous GAS2, for example SK-hep1/Huh7/PLC5 (Figure 1B and Supplementary Figures 1A and Supplementary Figures 2A) and then analyzed cell viability by counting, MTS and colony formation assays. After a 48-h transfection,introduction of GAS2 suppressed cell growth rate in a time-dependent fashion compared with the empty vector control (P < 0.05; Figure 1C and D). Furthermore,GAS2 overexpression also notably reduced colony formation ability compared with the control (P < 0.01; Figure 1E). However, there were no significant differences in the proliferation of Huh7 and PLC5 cells (P > 0.05; Supplementary Figures 1B-D and Supplementary Figures 2B-D).
On the other hand, we used specific siRNA to knock down endogenous GAS2 expression in the MIHA and Hep3B cells, and then assessed the cell proliferation(Figure 2A and Supplementary Figures 3A). The results showed that the downregulation of GAS2 in MIHA cells caused a higher increase in cell viability (P <0.05; Figure 2B and C) and colony formation ability in a time-dependent fashion compared with the control cells (P < 0.01, Figure 2D). But Hep3B without GAS2 did not grow significantly faster than the control cells (P > 0.05; Supplementary Figure 3BD).
Ectopic overexpression of GAS2 alters cell cycle progression in HCC cells
The growth-suppressive effect of GAS2 may depend on its activity to cell cycle progression. FACS analysis of GAS2-transfected SK-hep1cells revealed a significant increase in the population of G0/G1phase cells compared to the control cells.Moreover, there was also a significant decrease in the population of S phase cells although the extent appears minimal (P < 0.01; Figure 3A). Therefore, this also implies GAS2 overexpression can impede G1-to-S cell cycle transition and arrest more G1 cells. More importantly, the significant elevation of subG1 cell population upon overexpression of GAS2-transfected SK-hep1 cells had a significantly more than 2-fold difference compared with the control SK-hep1 cells (P < 0.01; Figure 3B), suggesting that the growth inhibition caused by GAS2 was primarily related to apoptosis.
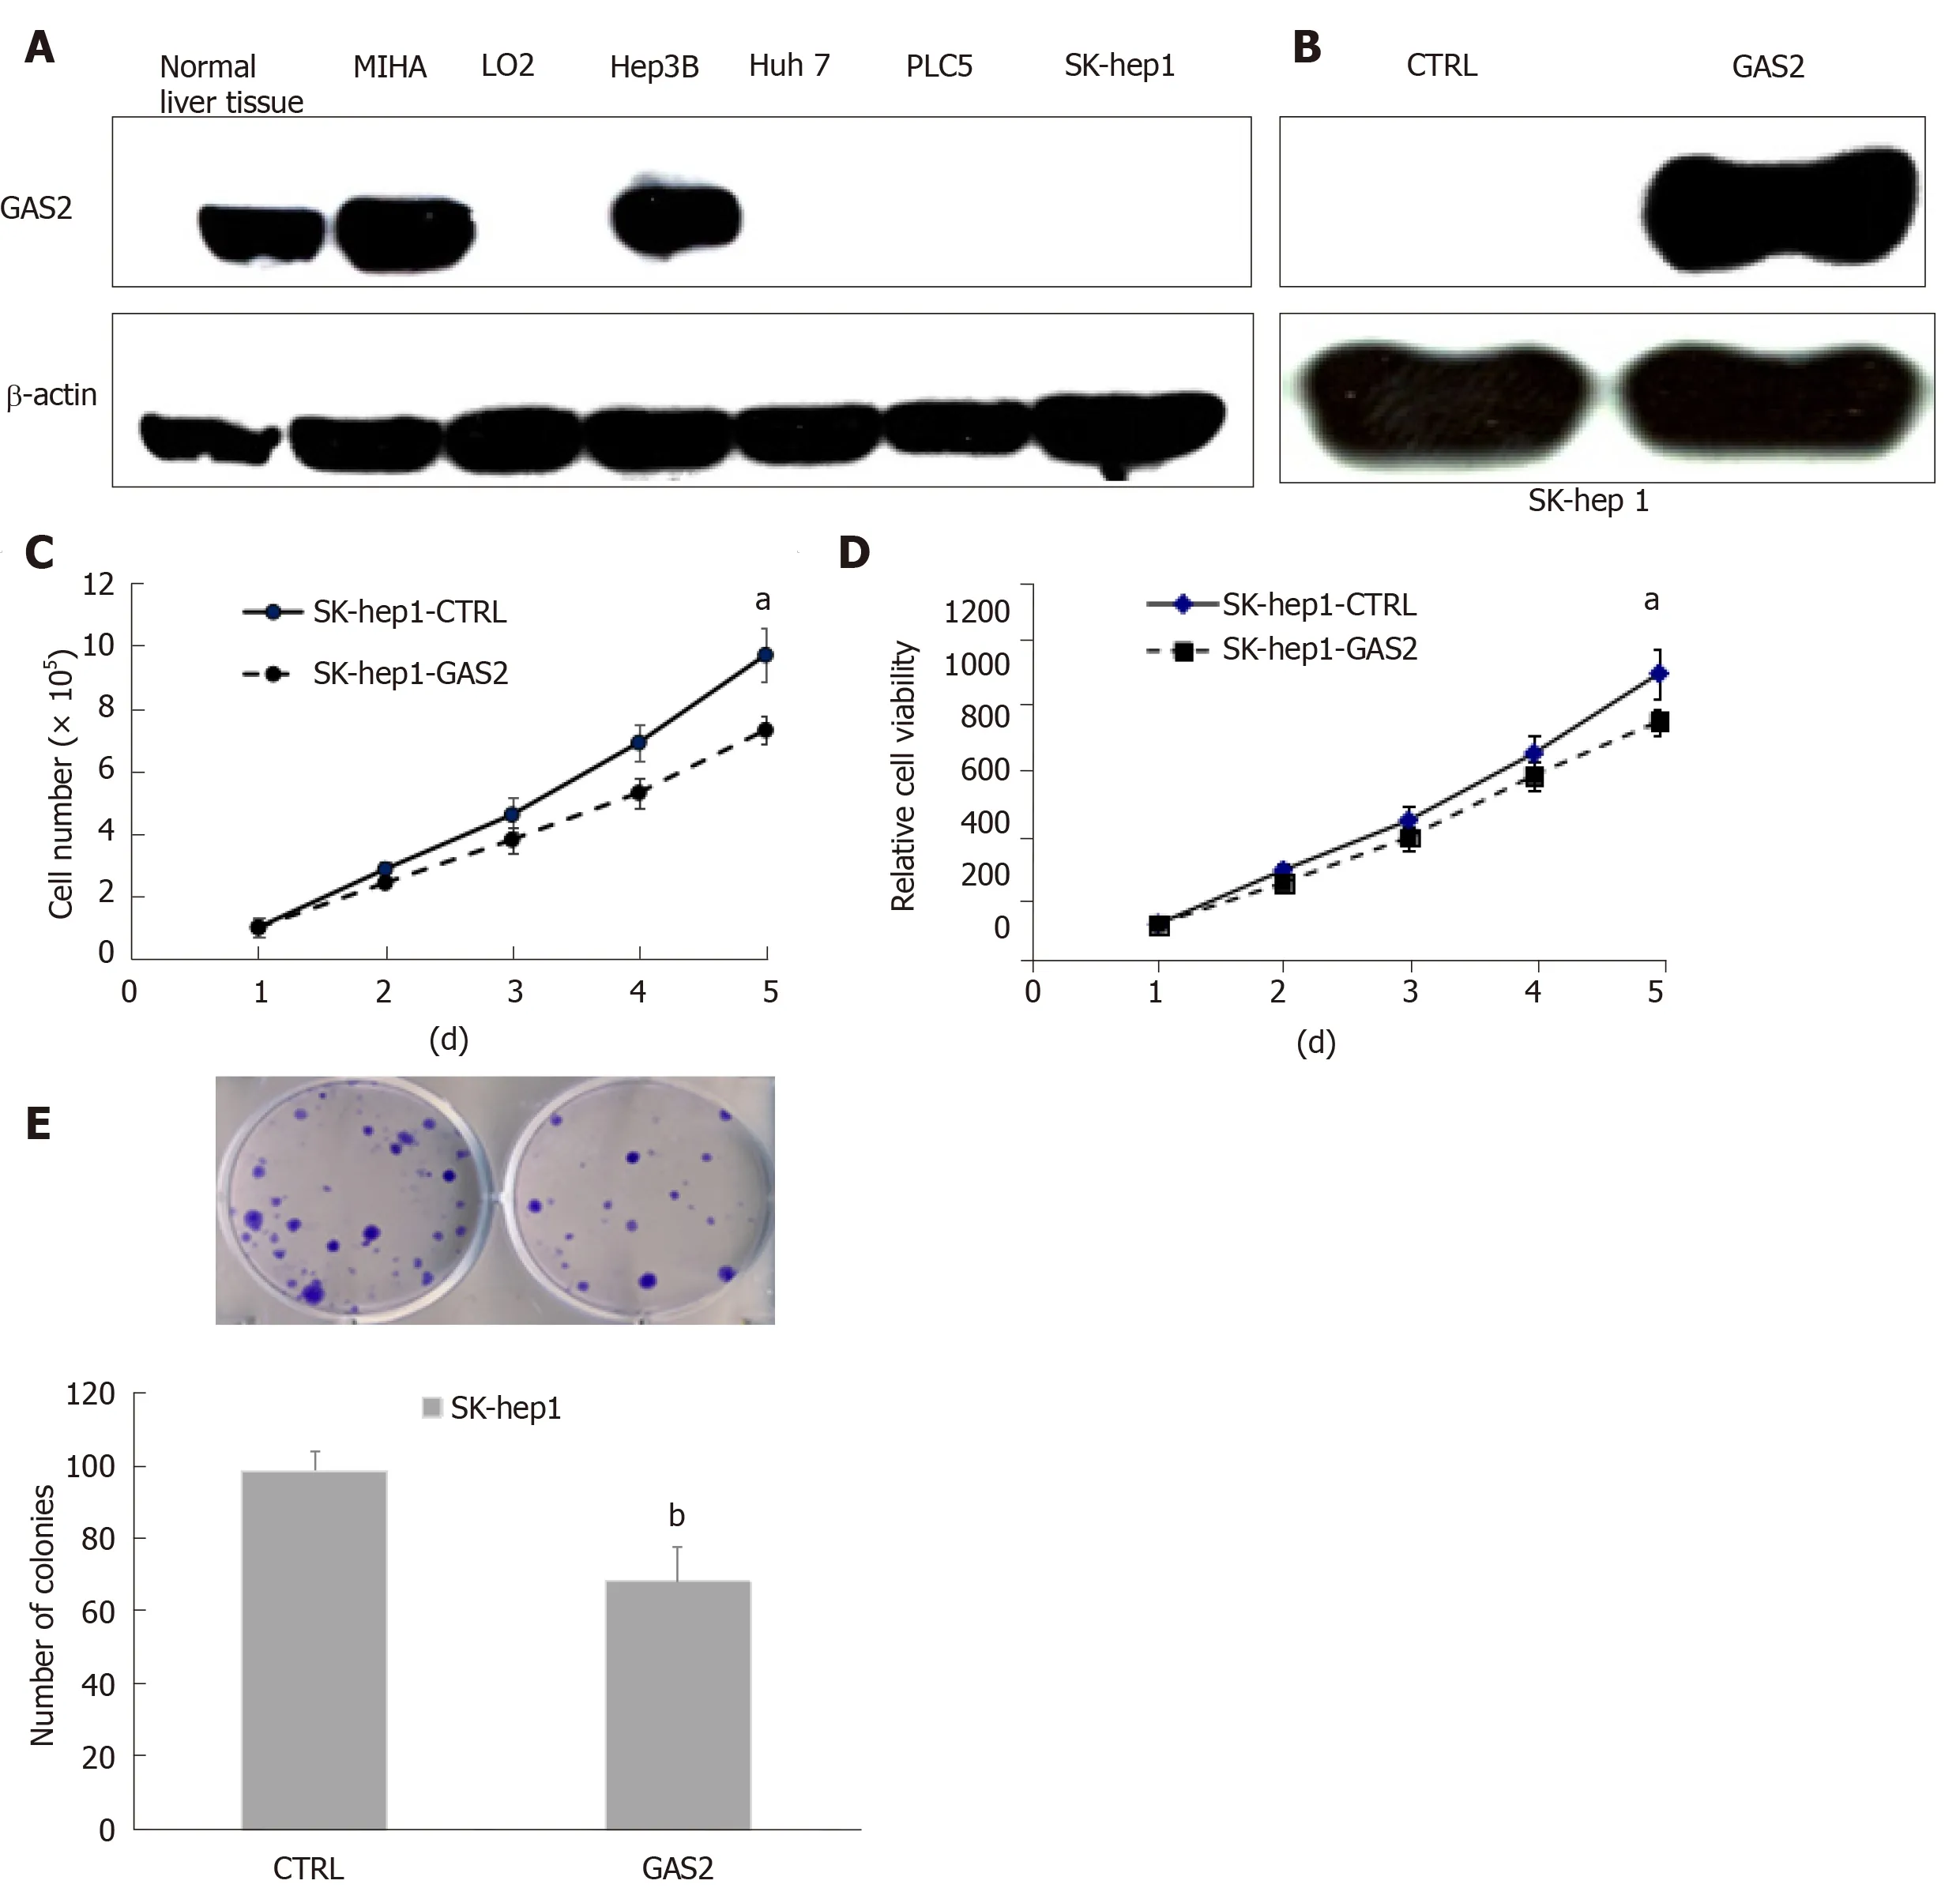
Figure 1 GAS2 exerts tumor-suppressive functions in HCC cells. A: Western blot analysis of GAS2 expression in liver and HCC cell lines. β-actin was used as the loading control; B: GAS2 transfected in SK-hep1 cells was identified by western blotting. β-actin was used as the loading control; C: Cell counting (aP < 0.05 vs control); D: Cell viability (aP < 0.05 vs control); E: Anchorage-dependent colony formation (bP < 0.01 vs control). GAS2: Growth arrest-specific gene 2.
However, on the other hand, FACS analysis of GAS2 downregulation in MIHA cells showed that there was a decrease in the population of G0/G1phase cells and an increase in the population of S phase cells compared to the control cells (P < 0.05;Figure 3C). There wasn't the significant difference between G0/G1phase and S phase,let alone subG1 phase (P > 0.05; Figure 3D).
GAS2 mediates growth arrest through the p53-dependent apoptotic pathway
To determine if GAS2-dependent growth inhibition was related to apoptosis,additional examinations were performed on the functionally characterized SK-hep1 and MIHA cells, without or with endogenous GAS2 expression. Annexin V apoptosis assay showed that ectopic overexpression of GAS2 significantly increased the population of early apoptotic cells, and such promotion was further enlarged by etoposide, an activator promoter of p53-mediated apoptosis[13](P < 0.05; Figure 4A).By contrast, downregulation of GAS2 in MIHA cells with specific siRNA to abolish endogenous GAS2 expression decreased early apoptosis (P < 0.05; Figure 4B). These findings showed that the anti-proliferative function of GAS2 was exerted through induction of apoptosis.
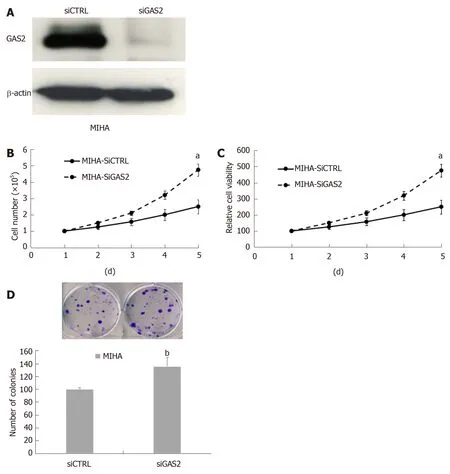
Figure 2 Effect of knockdown on endogenous GAS2 in MIHA cells. A: Western blot analysis of siGAS2, β-actin was used as the loading control; B: Cell counting(aP < 0.05 vs control); C: Cell viability (aP < 0.05 vs control); D: Anchorage-dependent colony formation (bP < 0.01 vs control). GAS2: Growth arrest-specific gene 2.
Because p53 plays an important role in apoptotic response, we next explored the possible function of p53 in GAS2-mediated apoptosis. Western blotting showed that p53 protein was expressed in normal hepatocyte cells (MIHA) and most HCC cell lines except Hep3B (Figure 4C). Treatment of siRNA against p53 (siP53) was significantly identified in SK-hep1-control and SK-hep1-GAS2 cells by western blotting. The levels of p53 and apoptosis markers, that is, cleaved caspase-3 and cleaved PARP were diminished after knockdown of p53 (Figure 4D). Annexin V apoptosis assay demonstrated that knockdown of p53 significantly inhibited early apoptosis in GAS2-SK-hep1 cells compared with control cells with abundant p53 expression (P < 0.05; Figure 4E). At the same time, in addition to p53, we also checked the apoptosis markers in the GAS2-overexpressed SK-Hep1 and GAS2-ablated MIHA cells with or without etoposide treatment. Overexpression of GAS2 and the treatment of etoposide can increase the levels of p53, cleaved caspase-3, and cleaved PARP. In addition, upregulation of GAS2 further enlarged the expression of p53 and apoptosis markers induced by etoposide treatment. Conversely, downregulation of GAS2 diminished the expression of p53 and apoptosis markers and the effect of etoposide treatment, relative to the corresponding controls (Figure 4F). Measurements of the resulting cells showed that the GAS2-dependent stimulation of apoptosis. These data indicate the existence of a p53-GAS2-caspase cascade and its function in cell growth retardation.
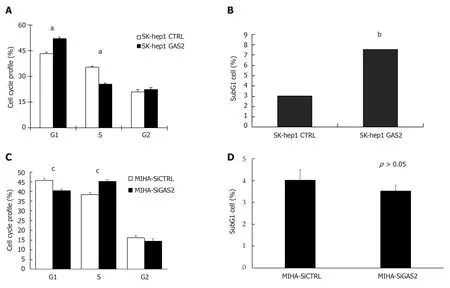
Figure 3 Effect of GAS2 on cell cycle progression. SK-hep1 cells were transfected with pDEST40-GAS2 and pDEST40-CTRL plasmids followed by FACS analysis(FITC/PI). A: Cell populations in different fractions of the cell cycle phase were plotted (aP < 0.05 vs control); B: The cell population in subG1 phase was determined by flow cytometry (bP < 0.01 vs control). MIHA cells were transfected with siGAS2 and siCTRL followed by FACS analysis (FITC/PI); C: Cell populations in different fractions of the cell cycle phase were plotted (cP < 0.05 vs control); D: Cell population in the subG1 phase was determined by flow cytometry. FACS: Fluorescenceactivated cell sorting.
Correlation of GAS2 expression in HCC tissues and their matched adjacent nontumor liver tissues
To further investigate the clinical relevance of GAS2 in human HCC tissues and their corresponding non-tumor liver tissues, we first examined the expression of GAS2 in 54 paired HCC and non-tumor liver samples by qPCR and western blot analysis.GAS2 expression was downregulated in 61.1% of HCC tissues (33 of 54) compared to the high basal levels in normal liver tissues. In contrast to the matched non-tumor tissues, marked downregulation (defined as greater than 1.5-fold change) of GAS2 was detected in 27of 54 samples (50%) (P < 0.05; Figure 5A). Regarding the relative GAS2 protein expression levels, the average fold changes of GAS2 expression in tumor tissues were significantly lower than those in the matched non-tumor tissues (P< 0.05; Figure 5B).
DISCUSSION
GAS2 is a member of the GAS gene family, which plays a role in modulating reversible growth arrest, mitogenesis, cell cycle, apoptosis, and cell survival. In 1988,Schneider et al[14]and Brancolini et al[15]found that GAS2 protein was highly expressed in serum-starved 3T3 fibroblasts and was phosphorylated by cysteine proteases during growth arrest. Its hyperphosphorylation is specifically relocalized to the appearance of membrane ruffles formed at the edges of the cells during G0-G1 transition[16]. In the course of apoptosis, the carboxyl-terminal domain of GAS2 polypeptide is phosphorylated by caspase enzymes. This proteolytical process is triggered by caspase-3 but not by caspase-2[9,17]. These aspartic-specific cysteine proteases are fundamental effectors of the apoptotic program, resulting in apoptosis by cleaving specific cellular targets or death substrates[18,19]. Removal of the carboxyl terminal domain of GAS2 dramatically performs the potential cell shape changes of the affected cells through reorganizing the microfilaments system in order to response to the growth arrest induced by environmental stimuli such as apoptosis[20]. As a consequence, some study thought that the processing of GAS2 throughout apoptosis by caspase enzymes could exert some critical effects on cell death.
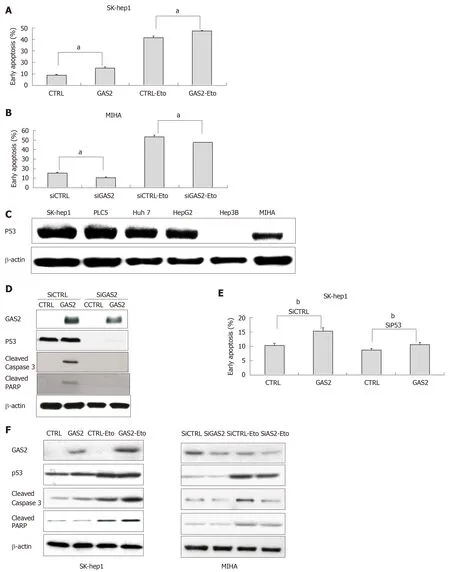
Figure 4 GAS2 inhibits HCC cell growth by increasing p53-mediated apoptosis. A: Effect of GAS2 overexpression on apoptosis was determined by FACS using the Annexin V-APC apoptosis assay. A: The effect of 100 μM etoposide (Eto) in SK-Hep1 cells transfected with pDEST40-CTRL or pDEST40-GAS2 (aP < 0.05 vs control); (B) Effect of knocking down GAS2 in MIHA on apoptosis was determined by FACS using the Annexin V-APC apoptosis assay. The effect of 100 μM etoposide (Eto) in MIHA cells transfected with siCTRL or siGAS2 (aP < 0.05 vs control); C: Expression of p53 in hepatocytes and HCC cell lines was identified by western blotting, β-actin was used as loading control; D: siRNA-mediated knockdown of p53 (sip53) and overexpression of GAS2 in SK-Hep1 cells as well as the apoptosis markers such as cleaved caspase-3 and cleaved PARP were confirmed by western blotting; E: Effect of knocking down p53 (siP53) and overexpression of GAS2 in SK-Hep1 cells on apoptosis was determined by FACS using the Annexin V-APC apoptosis assay (bP < 0.01 vs control; mean values and SD from three replicate experiments); F: Cell apoptosis markers in the absence or presence of etoposide (Eto) in GAS2-overexpressing SK-Hep1 cells (left panel) or GAS2-ablated MIHA cells (right panel). FACS: Fluorescence-activated cell sorting; GAS2: growth arrest-specific gene 2.
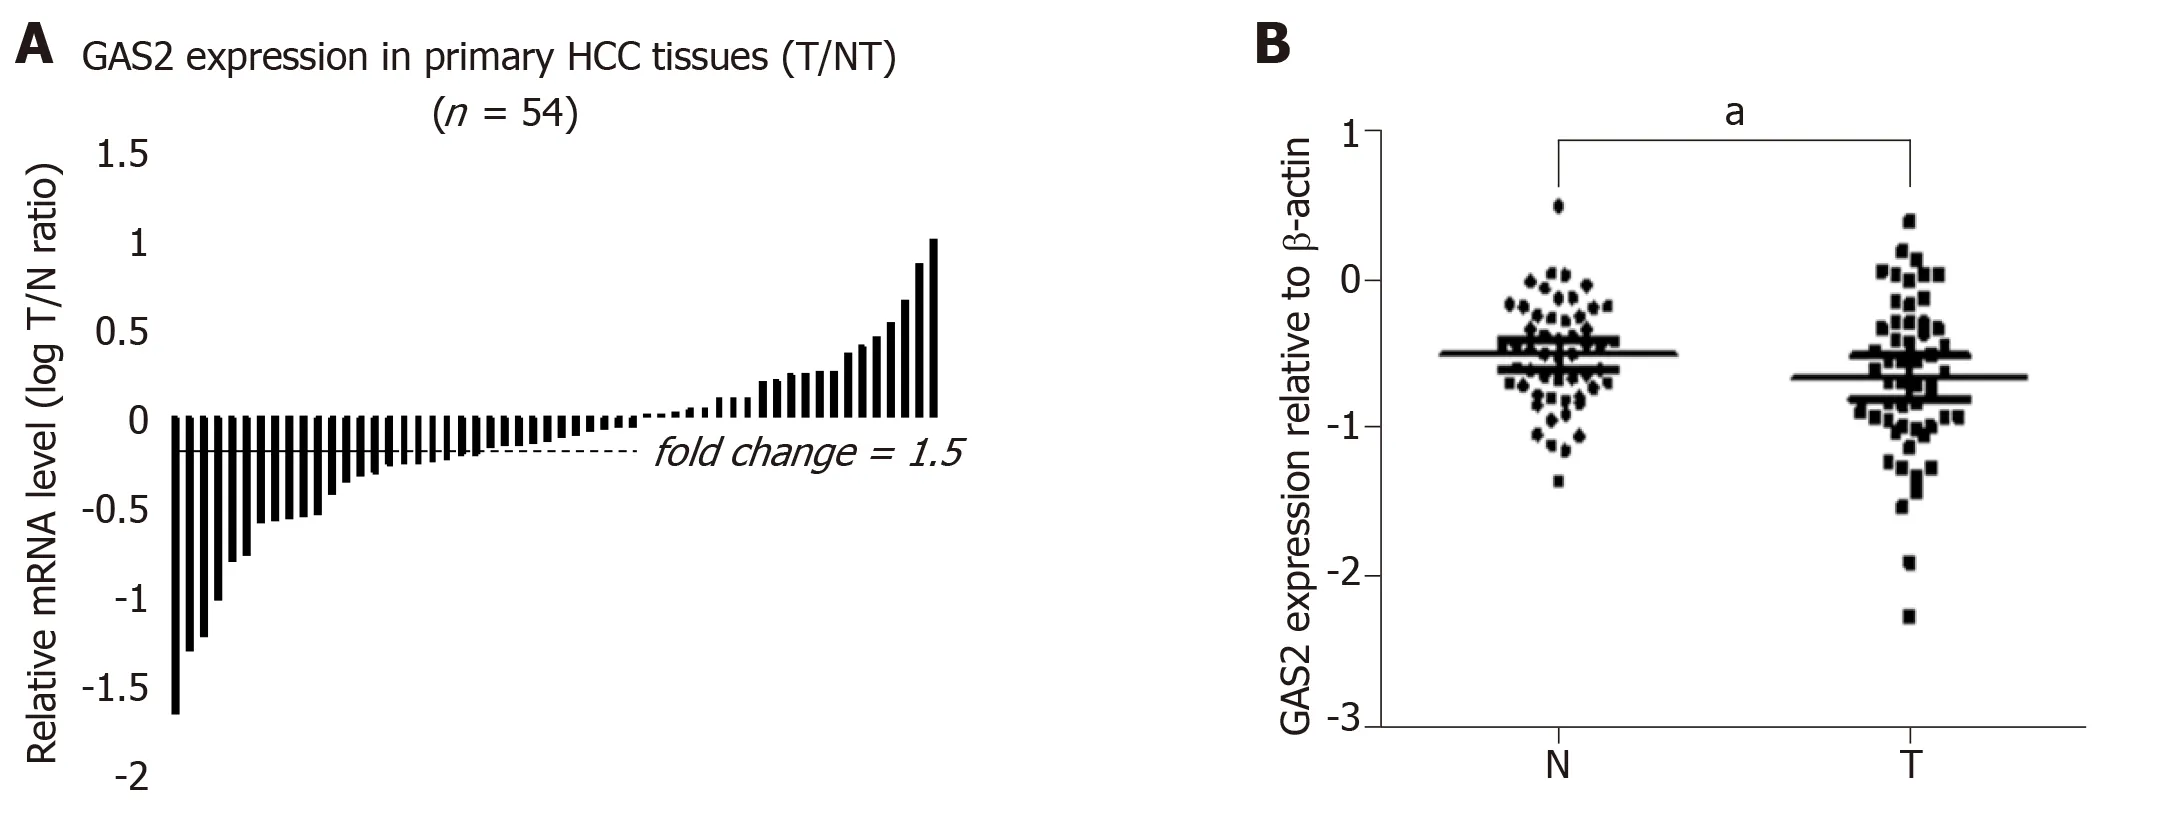
Figure 5 Expression of GAS2 in HCC specimens as determined by qPCR and western blotting. A: Comparison of GAS2 mRNA expression in 54 paired tumor(T) and non-tumorous (N) tissues using PNN as an internal control. The bars (shown in log scale) illustrate the relative GAS2 mRNA level (T/N) in individual tissue pairs, of which negative and positive values respectively indicate downregulation and upregulation of GAS2 in HCC tumors. The differences of the T and N groups were statistically significant (P < 0.05 vs non-tumorous); B: Relative protein expression levels of GAS2 in 54 paired tumor (T) and non-tumorous (N) tissues using βactin as an internal control. The average fold changes of GAS2 expression in tumor tissues were significantly lower than those in the paired non-tumor tissues (aP <0.05 vs non-tumorous). GAS2: growth arrest-specific gene 2; HCC: Hepatocellular carcinoma.
The GAS2 gene maps to the human chromosome 11p15.2-p14.3, coding for a protein of 314 amino acids with a molecular weight of approximately 36 kDa[21]. It is expressed in many normal tissues, mostly in the liver, while it is absent in several cancer cell lines such as prostate cancer cells and breast cancer cells (MCF7,HCC1954)[11,12]. Although recent findings have revealed the functional links of GAS2 in cell survival, the mechanisms of GAS2 in HCC remain incompletely defined.
In our study, we found that GAS2 protein was expressed in most normal liver tissues and liver cell lines, while it was depleted in some HCC cell lines, for example,Huh7, PLC5 and Sk-hep1. In order to better define the effect of GAS2 in HCC development, we examined the functional consequences of GAS2 overexpression in a null-GAS2 expressing HCC cell line, SK-hep1, which carries wild-type functional p53.Although the lack of GAS2 and the presence of p53 were also found in the PLC5 and Huh7 cells, p53 mutation was reported in these two cell lines. PLC5 displayed Arg249Ser mutations in p53[22-24], while Tyr220Cys mutation of p53 was observed in Huh7[25-28]. Our subsequent functional analyses, by way of overexpression and knockdown approaches, illustrated that GAS2 inhibited the proliferation of HCC cells with wild-type functional p53. Furthermore, FACS analysis revealed overexpression of GAS2 induced more cell arrest in the G0/G1 phase and less cell population in the S phase, particularly the elevation of subG1, which may be primarily related to apoptosis.
The imbalance between cellular proliferation and apoptosis may contribute to carcinogenesis[29-31]. The interruption of apoptosis is likely one of the key mechanisms for promoting the transition from benign cells to cancer cells. The induction of apoptosis in SK-hep1 cells by GAS2 was also accompanied by the inhibition of cellular proliferation. It had been reported that GAS2 was a death substrate cleaved by caspase-3 and can efficiently increase cell susceptibility to apoptosis following UV irradiation, etoposide, and MMS treatments, which are dependent on increased p53 stability and transcription activity[32]. Our study showed that the combined GAS2 overexpression and etoposide treatment had an additive effect in promoting apoptosis in SK-hep1 cells with wild-type functional p53 compared with cells treated with etoposide alone. The presence of etoposide might accelerate the proteolysis of GAS2. The molecular basis of p53-dependent apoptotic pathway in HCC cells was also analyzed by the expression of apoptosis markers, that is, cleaved caspase-3 and cleaved PARP functioned in the execution of the intrinsic mitochondrial apoptotic pathway. The proteolytic cleavage of PARP facilitated cellular disassembly and undergone apoptosis[33,34]. According to our data, with the presence of p53,overexpression of GAS2 could increase the level of cleaved caspase-3 and cleaved PARP induced by etoposide. Without p53, overexpression of GAS2 was invalid in the level of cleaved caspase-3 and cleaved PARP induced by etoposide. Likewise, without GAS2 overexpression, these apoptosis markers were attenuated. This implies that p53-dependent apoptotic pathway induced by GAS2 triggers a p53-GAS2-caspase cascade effect that initiates the cell death program.
Furthermore, further validation of GAS2 in a clinic 54 pairs of HCC and their matched adjacent non-tumor liver tissues subset is warranted. We found that GAS2 was downregulated in more than 60% of HCCs. Their average fold changes of GAS2 expression in tumor tissues were significantly lower than those in the matched nontumor tissues. Of note, HCC is an extremely heterogenous disease, displaying extensive histologic, transcriptomic and genetic diversity. On the genetic level, the most common mutant genes are TP53 (encoding p53 protein) and CTNNB1(encoding-catenin protein), both mutated in 20%-40% of HCCs. Particularly, the frequency of TP53 mutation in HCC ranges from 22% to 33%[35-38]. The p53 protein manipulates various molecular functions in cell such as DNA synthesis and repair,cell cycle arrest, senescence, and apoptosis[39]. Since the role of GAS2 in cell proliferation, cell cycle, and apoptosis was dependent on wild-type p53, together with our clinical data, we speculated that the signal pathway of p53-GAS2 molecular axis might be a primary tumorigenic mechanism in HCCs with wild-type p53. Of course,there other silencing GAS2-targeted signal pathways in HCC development need to be considered.
Together, our multiple functional experiments reveal that the anti-proliferative nature of GAS2 may be one of the major hepatocarcinogenesis mechanisms. We further characterized that GAS2 inhibited HCC cell proliferation possibly via enhancing susceptibility to p53-dependent apoptosis. Accordingly, our findings not only enhance our understanding of the mechanisms of liver carcinogenesis, but also provide potential therapeutic targets for this aggressive malignancy.
ARTICLE HIGHLIGHTS
Research background
Hepatocellular carcinoma (HCC) is the most common primary liver cancer, and is a leading cause of cancer-related mortality in China. The prognosis of HCC is poor with high mortality because of limited options of effective treatment. Thus, new therapeutic targets that may confer survival benefit are urgently needed in HCC.
Research motivation
Growth arrest-specific gene 2 (GAS2) is a member of the GAS gene family, which is universally expressed in most normal tissues, particularly in the liver, but is depleted in some tumor tissues.However, the functional mechanisms of GAS2 in HCC are not fully defined.
Research objectives
The aim of this study was to investigate the role of GAS2 in the liver and HCC and its underlying mechanism.
Research methods
GAS2 expression was examined by real-time PCR and western blotting in tissues and cells. The proliferation of GAS2 expression was analyzed by counting, MTS, and colony formation assays.Cell cycle analysis was performed by flow cytometry. Cell apoptosis was investigated by the Annexin V apoptosis assay.
Research results
GAS2 protein expression was more downregulated in HCC than in normal tissues.Overexpression of GAS2 inhibited the proliferation of HCC cells with wild-type p53 and knockdown of GAS2 showed the opposite effects. The more arrested G1 cells in the cell cycle and p53-GAS2 caspase cascade might be involved in the oncogenic function of GAS2 in HCC.
Research conclusions
The study showed that GAS2 suppressed the proliferation and apoptosis of HCC cells, and the possible mechanism was by regulating the cell cycle and p53-dependent apoptosis pathway.Thus, GAS2 is expected to be an important anti-oncogene and potential therapeutic target in HCC.
Research perspectives
The function and mechanism of GAS2 in HCC development has been confirmed, and the significance of GAS2 as a promising therapeutic target for HCC with wild-type p53 is highlighted.
杂志排行
World Journal of Gastroenterology的其它文章
- New Era: Endoscopic treatment options in obesity-a paradigm shift
- Chronic hepatitis delta: A state-of-the-art review and new therapies
- Eosinophilic esophagitis: Current concepts in diagnosis and treatment
- Locoregional treatments for hepatocellular carcinoma: Current evidence and future directions
- Review of current diagnostic methods and advances in Helicobacter pylori diagnostics in the era of next generation sequencing
- Exploring the hepatitis C virus genome using single molecule realtime sequencing
