春节前后华北平原农村地区黑碳浓度及来源
2019-08-28孔少飞郑淑睿吴方琪牛真真祁士华
刘 玺,孔少飞*,郑淑睿,郑 煌,严 沁,吴 剑,程 溢,吴方琪,牛真真,曾 昕,陈 楠,许 可,祁士华,3
春节前后华北平原农村地区黑碳浓度及来源
刘 玺1,孔少飞1*,郑淑睿1,郑 煌1,严 沁1,吴 剑1,程 溢1,吴方琪1,牛真真1,曾 昕1,陈 楠2,许 可2,祁士华1,3
(1.中国地质大学(武汉)环境学院,湖北 武汉 430074;2.湖北省环境监测中心站,湖北 武汉 430072;3.中国地质大学(武汉)生物地质与环境地质国家重点实验室,湖北 武汉 430074)
在河南某农村站点利用黑碳仪(AE33)对春节前后(2018年2月12日~3月12日)黑碳气溶胶(eBC)进行在线连续监测,获得其质量浓度、昼夜变化及来源.结果表明:春节期间的eBC浓度最高,(8.22±4.17)μg/m3,该时期人为活动对eBC影响最为明显.春节前,生物质燃烧产生的eBC占其总浓度百分比最大,为(41.1±5.3)%,并随时间推移逐渐减小,降至(26.8±12.0)%.AAE(1.40±0.16)说明,该地区春节前后eBC的化石燃料排放和生物质燃烧贡献程度接近.与城市点位相比,本研究的AAE值较高.春节前后,观测地区的eBC昼夜变化存在2个明显高值时段,分别在7:00~9:00和20:00左右.春节期间的eBC昼夜变化无明显波动.根据浓度权重轨迹分析显示,春节期间eBC的潜在源区有山西、陕西、安徽和江苏等省份,其他时期集中在河南、湖北境内.本研究对于识别冬季农村燃烧源排放黑碳演化特征及其对区域重霾形成和发展的影响具有重要意义,也可为黑碳气溶胶气候、环境和健康模拟提供基础数据.
黑碳气溶胶;春节;来源;农村地区;华北平原
黑碳(BC)是一种大气环境中具有强吸光性的物质,通过含碳物质的燃烧过程产生[1-4].黑碳通过对不同波长光线进行吸收和散射,改变局部大气稳定性和垂直结构,进而影响区域天气和全球大气循环[5-6].黑碳的大气直接辐射强迫达0.64W/m2,对温室效应的贡献率仅次于CO2[7].此外, BC还会引起多种呼吸道和心血管疾病[8],与PM10和PM2.5相比,其对人体造成的健康影响更为明显,可将其作为空气质量好坏的指示物[9].
华北地区近年来经济发展迅速,已成为中国大气污染最严重的地区之一[10].当前对该区域冬季大气重污染的研究主要集中在城市地区[11-14],但有研究指出农村地区污染物排放对区域空气质量的影响同样不容忽视[15-16].Wang等[17]通过一维模型计算,发现BC在农村地区的穹顶效应更为明显,但当前农村地区黑碳观测数据仍很缺乏,制约着模型模拟结果的验证和改进.此外,周边城市及远距离的传输作用也会影响农村地区的空气质量[18-19].
春节是中国最重要的节日,由于春节期间大量燃放烟花爆竹,大气中相关的颗粒物浓度显著上升[20-23].Kong等[24]指出南京春节期间,烟花的燃放对大气中PM2.5的贡献率接近50%.同时,由于“假期效应”的存在和大规模人口迁移,此期间大气污染源排放会出现显著变化[25],大中型城市中与燃煤、机动车相关的污染物排放量显著减少[24].根据2001~ 2012年春节期间数据发现,华东地区的PM10在春节期间下降9.24%[26].然而,目前对春节期间大气污染物浓度及源变化的研究主要集中在城市区域,针对农村地区的研究极为有限,相关数据集的缺乏也制约着模型模拟研究.
鉴于此,本研究在华北平原某农村布点,以燃烧源排放的标识组分BC为研究对象,利用春节期间的在线监测数据和浓度权重轨迹分析法探讨典型农村点位BC浓度变化和区域传输对其产生的影响,对于识别春节期间华北平原地区BC的浓度、变化及来源,为识别区域重污染过程农村点位污染物变化特征具有重要意义,也可为相应模型模拟研究提供基础数据.
1 研究方法
1.1 观测点位和时段
观测地点位于河南省平顶山市某农村地区(33.94°N, 113.10°E)的一户村民房顶,采样高度距地5m.距观测点的西南和东北方向分别约9km、11km的位置,各有一座城镇.在距观测点约4km的西南、东南和东北方向,分别有一条高速公路(G36)和2条省道(S238和S231)穿过,在其他方向还有乡镇公路穿过.观测点周围是大面积农田,无工业污染源.具体采样点位情况如图1所示.
采样时间为2018年2月12日~2018年3月12日.由于2月15日~2月21日为法定春节假期,故将整个观测时间划分为春节前(2月12日~2月14日)、春节期间(2月15日~2月21日)和春节后(2月22日~3月12日)3个时期.
1.2 实验方法
1.2.1 仪器和数据 本研究利用美国Magee公司生产的AE-33型黑碳仪(Aethalometer Model 33, Magee Scientific)测量大气环境中BC的质量浓度.该仪器共有7个测量通道,测量波长分别为370、470、520、590、660、880及950nm,经自动校准后设定采样流量为5.0L/min并连接PM2.5切割头.由于在波长880nm下,BC的吸收效果占主要地位而其它气溶胶体的吸收效率可被忽略[27],故本研究以在880nm下测得的eBC浓度值代表实时大气环境中的BC质量浓度值.
AE-33型黑碳仪的工作原理与AE-31型类似[28-29],此外还增用了“双点位”采样技术[30]和Virkkula提出的算法[31],来修正由“负载效应”造成的测量误差. Virkkula算法可通过(1)式表示:
eBCcorrected= eBCuncorrected×(1+×ATN) (1)
式中: eBCcorrected和eBCuncorrected分别为修正前和修正后的eBC浓度值;为负载补偿系数; ATN为由AE-33测得的光衰减量.
AE33原始数据的分辨率为1min,分析数据时将其全部处理成1h平均值,并进一步计算得到日平均值和时期均值.在数据预处理过程中,先将负值删除,然后将异常值(与该小时平均值之差的绝对值大于3倍标准差)及人工换膜时标记的值进行剔除,最终得到的数据有效率为95.3%.
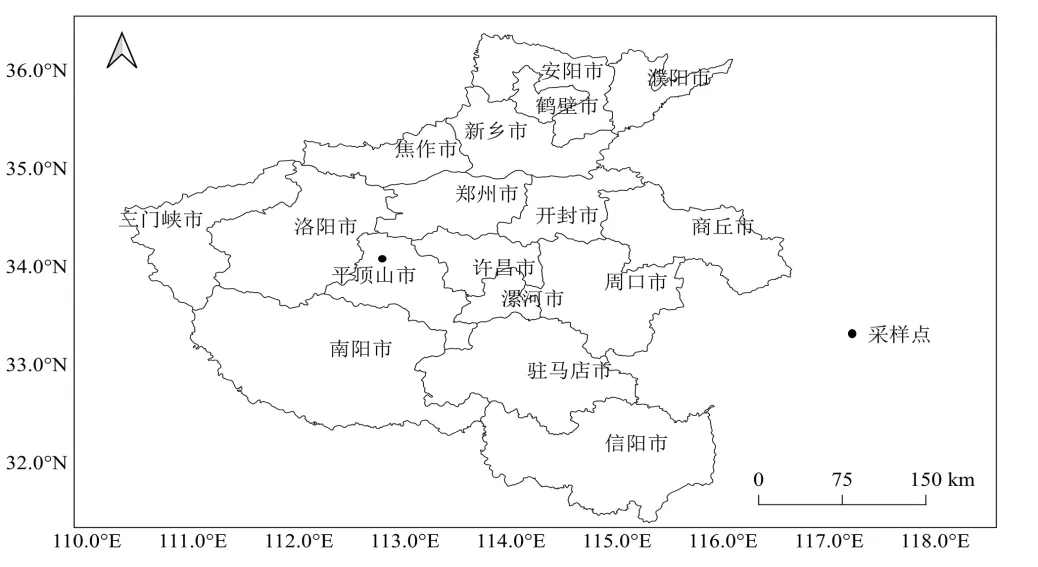
图1 采样点位置示意
1.2.2 eBC源解析模型 气溶胶对光吸收特性与波长之间的关系可用公式(2)表示,具体如下:
abs() =-AAE(2)
式中:abs是吸收系数;为常数;AAE是Ångström指数[33];是波长.
本研究中定义BB为生物质燃料燃烧产生的eBC占其总浓度的百分比,它由Sandradwei等[34]提出的模型计算得出.模型中假设eBC气溶胶来源于生物质(bb)燃烧和化石燃料(ff)燃烧,则eBC气溶胶的吸收系数babs()可由这两项主要来源表示:
abs() =abs()bb+abs()ff(3)
式中:abs()bb和abs()ff分别代表生物质燃烧和化石燃料排放产生eBC所对应的吸收系数.同时,给出化石燃料和生物质燃烧对应的关系式:


式中:假设AAEff= 1,AAEbb= 2[34-35],并结合公式(3)~(5)最终可推算出BB.
1.2.3 浓度权重轨迹分析法 浓度权重轨迹分析法(CWT)是一种计算大气污染物的潜在污染源区及其轨迹污染程度的方法.在该方法中,通过流经网格的轨迹及各轨迹对应的eBC浓度计算得出每个网格上存在的权重浓度.

式中:C是网格(,)上的平均权重浓度;是网格(,)中的总轨迹数;C是经过该网格第条轨迹对应的eBC质量浓度;是经过该网格第条轨迹的停留时间.
气温、相对湿度、风速风向和能见度等气象参数来自当地气象观测站,时间分辨率为1h.边界层高度数据下载自NOAA’s READY Archived Meteorology website,时间分辨率为3h.
2 结果与讨论
2.1 气象条件和eBC浓度基本特征
如图2所示,观测期间温度较低(-4.4~22.6℃),相对湿度变化范围较大(32.5%~86.0%).风速也处于较小水平,在1.4~3.3m/s范围内波动.能见度较好(>10km)的天数为8日,边界层高度波动较大(50~2324m),日均降水量约0.22mm.
如图3所示,研究期间AAE值整体在1.5上下波动.在春节前、春节期间和春节后3个时期eBC均有峰值出现,浓度在10μg/m3左右;eBCbb与eBCff浓度变化趋势相似.
低温、低风速会导致形成稳定的大气温度层结,不利于污染物扩散[36].研究期间,eBC与风速呈显著负相关(=-0.12,=0.003).表1是春节前、春节期间和春节后3个时期气象参数的对比.其中,春节前和春节后风速无明显区别(=0.58),但春节前的eBC浓度较高.这与春节前务工人员回乡,春节后农村人口减少有关.研究期间,人为活动是影响eBC浓度的重要因素.

图2 观测期间各气象要素的时间序列
2.2 eBC质量浓度、生物质燃烧贡献和波长吸收指数的不同时期变化特征
表2是不同时期各参数的比较.研究期间, 观测点位及周边的eBC质量浓度平均值为6.78± 6.34μg/m3.图4a是3个时期eBC浓度平均值的箱线图.由该图可知, eBC浓度值在春节前后差异显著(=0.0001):春节前和春节期间,eBC浓度平均值均较春节后的eBC浓度平均值高,且春节期间的平均值最大.这可能是由于春节期间较活跃的人为活动(如燃放烟花爆竹和生物质燃烧等),使得该时期大气中的eBC污染物浓度在3个时期中最高.
表3所示为本次观测eBC浓度和我国部分观测站点的比较结果.与深圳[37]、南京[38]、广州[39]等城市相比,该农村站点eBC浓度明显较高.与重污染时期的北京[40]和同为农村站点的河北香河县[28]的观测结果接近,说明春节期间该区域的eBC污染情况严重.
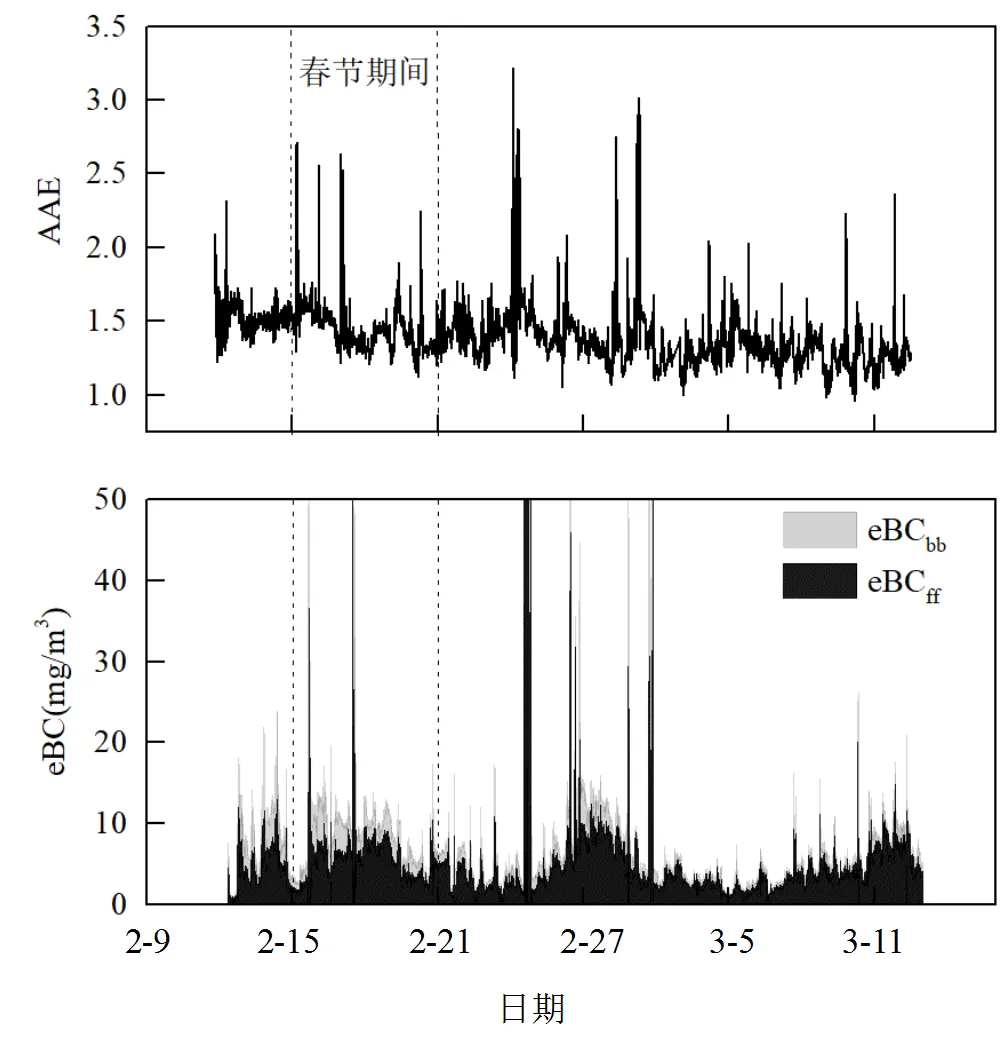
图3 AAE和eBC浓度的时间序列

表1 不同时期气象参数比较

表2 不同时期各污染物浓度与AAE比较
图4b是不同时期eBCbb的平均值.春节前eBCbb浓度(3.1±1.6)μg/m3最高,说明该段时期生物质燃烧对eBC有较大影响.图4e展示了3个时期生物质燃烧对eBC质量浓度的贡献程度(BB), 3个时期BB的平均值分别为(41.1±5.3)%、(34.9±10.2)%和(26.8± 12.0)%. BB值在春节前最大表明,春节前的生物质燃烧现象在整个研究期间最为明显.可能是因为在该时期内,农村居民进行各种年货制备,消耗较多的生物质燃料.
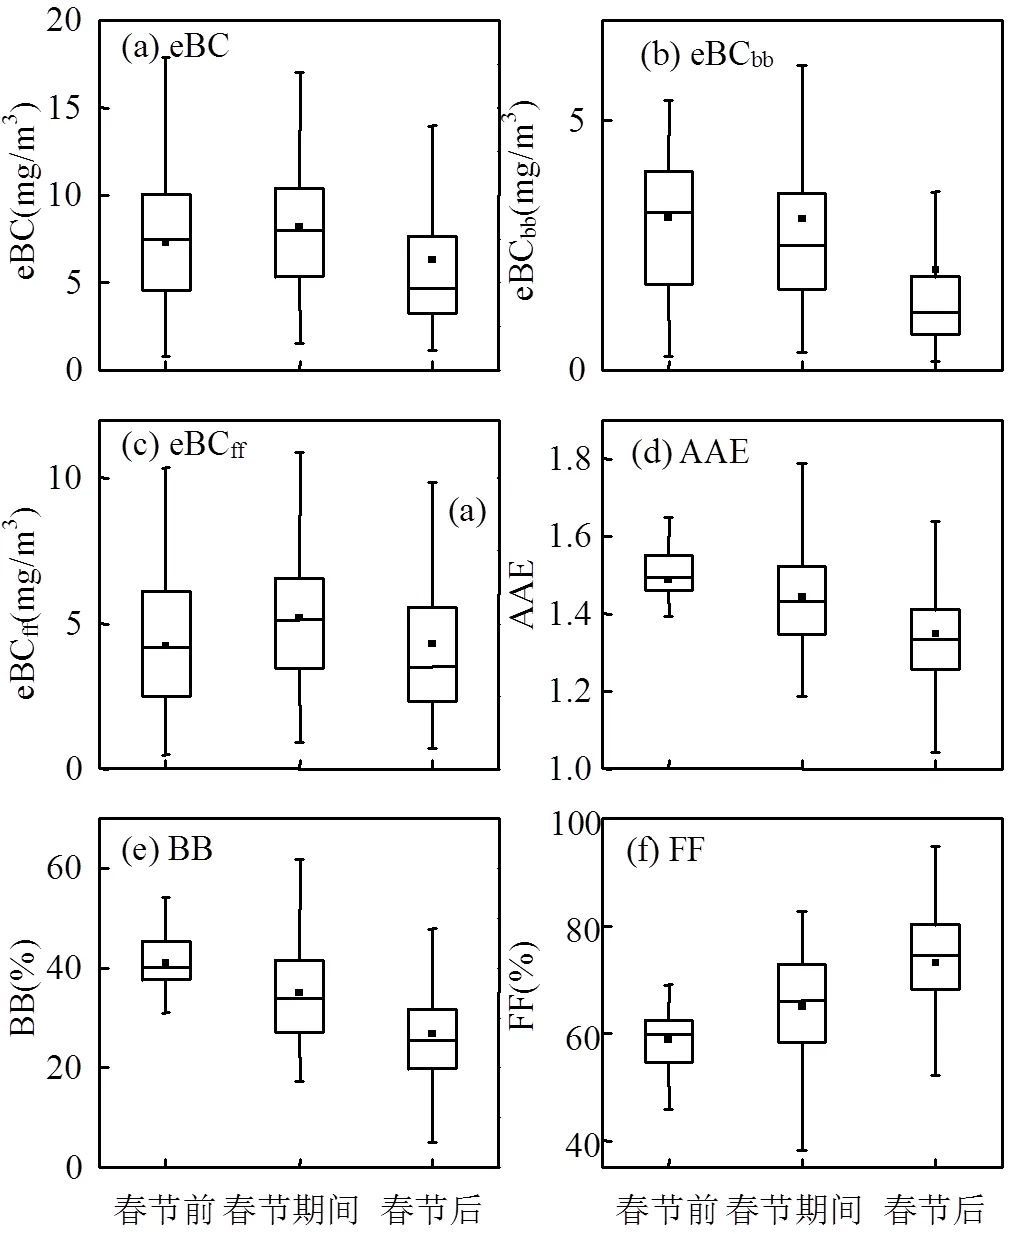
图4 不同时期各参数的平均值
图4c和4f分别是不同时期eBCff和其对eBC的贡献程度(FF).不同时期的eBCff和FF分别为(4.2±2.3)μg/m3,(5.2±2.3)μg/m3,(4.3±2.7)μg/m3和(58.9± 5.3)%,(65.1±10.2)%和(73.2±12.0)%.春节后恢复工作生产,可能是造成该时期FF值最高的原因.
图4d是3个时期的AAE平均值.其趋势与BB类似,在春节前有最大值,在春节后AAE平均值最小.研究期间,该农村地区春节前、春节期间和春节后3个时期的AAE的平均值分别为(1.51±0.07)、(1.50±0.13)和(1.35±0.17),总平均值为(1.40±0.16).表4是本研究AAE值和国内外其他站点的比较结果.与深圳[37]、南京[38]及广州[39]等城市相比,本研究地区的AAE值偏高;但与秸秆焚烧时期的河北香河县[28]及印度Vijayawada[41]等农村地区相比,本研究地区的AAE值则偏低.环境和能源结构及老化时间长短的不同会造成不同地区AAE值出现差异[39,42].当AAE值接近1时,eBC以化石燃料排放为主;当AAE值接近2时,eBC以生物质燃烧为主[43].根据计算结果,可知该农村地区eBC的化石燃料排放和生物质燃烧贡献程度接近,并且随着时间推移,生物质燃烧贡献程度逐渐减小.
2.3 eBC质量浓度、生物质燃烧贡献和AAE的昼夜变化特征
通常而言,eBC质量浓度的昼夜变化特征与当地人类活动、近地层气象条件以及大气边界层的动力状况密切相关[41,51].有研究指出在通风系数(边界层高度和水平风速的乘积, VC)大的时段,黑碳浓度较小[52-53].图5a展示了不同时期的eBC浓度昼夜变化曲线.在春节前和春节后,eBC昼夜变化均有两个明显高值时段.日出前后(7:00~9:00左右),eBC的峰值与清晨生物质燃烧量和机动车辆增加有关(图5b、5c);同时,图5d显示该时段VC值较小(1000m2/s左右),不利的气象条件促使污染物积聚;日间时段(11:00~17:00),由于VC值增大以及人为源排放减少,eBC浓度呈下降趋势,并在15:00左右出现谷值(春节前和春节后分别为5和4 μg/m3);夜间时刻(19:00~20:00左右),VC值降低使得黑碳污染物重新在近地面堆积出现峰值(10μg/m3左右),同时晚间做饭的生物质燃烧增加(图5b),促进了这一过程.图5e展示了不同时期BB的昼夜变化特征.由图知,BB与eBC浓度值的昼夜变化特征基本一致.春节前和春节后均在8:00和19:00左右出现BB峰值,这2个时间点正好是早饭和晚饭时间,生物质燃料使用量较多.
与这2个时期不同的是,春节期间的eBC浓度和BB值昼夜变化波动均较小,在早中晚饭期间略微上升(eBC由7.5μg/m3上升到9μg/m3左右,BB由31%上升到38%左右).出现这种现象可能是因为春节期间较活跃的人为活动和不利的气象条件(该时期VC 均值为(864.6±864.7) m2/s)使得全天的eBC浓度和BB均较高;此外,早中晚饭期间的生物质燃烧较多,造成这些时间段内的eBC浓度和BB均有增加.
图5f是不同时期的AAE昼夜变化曲线.通过对比可知,AAE的昼夜变化趋势与BB的昼夜变化特征曲线一致,在春节前和春节后于早晚期间各存在2个明显高值时段,在春节期间昼夜变化波动不大.
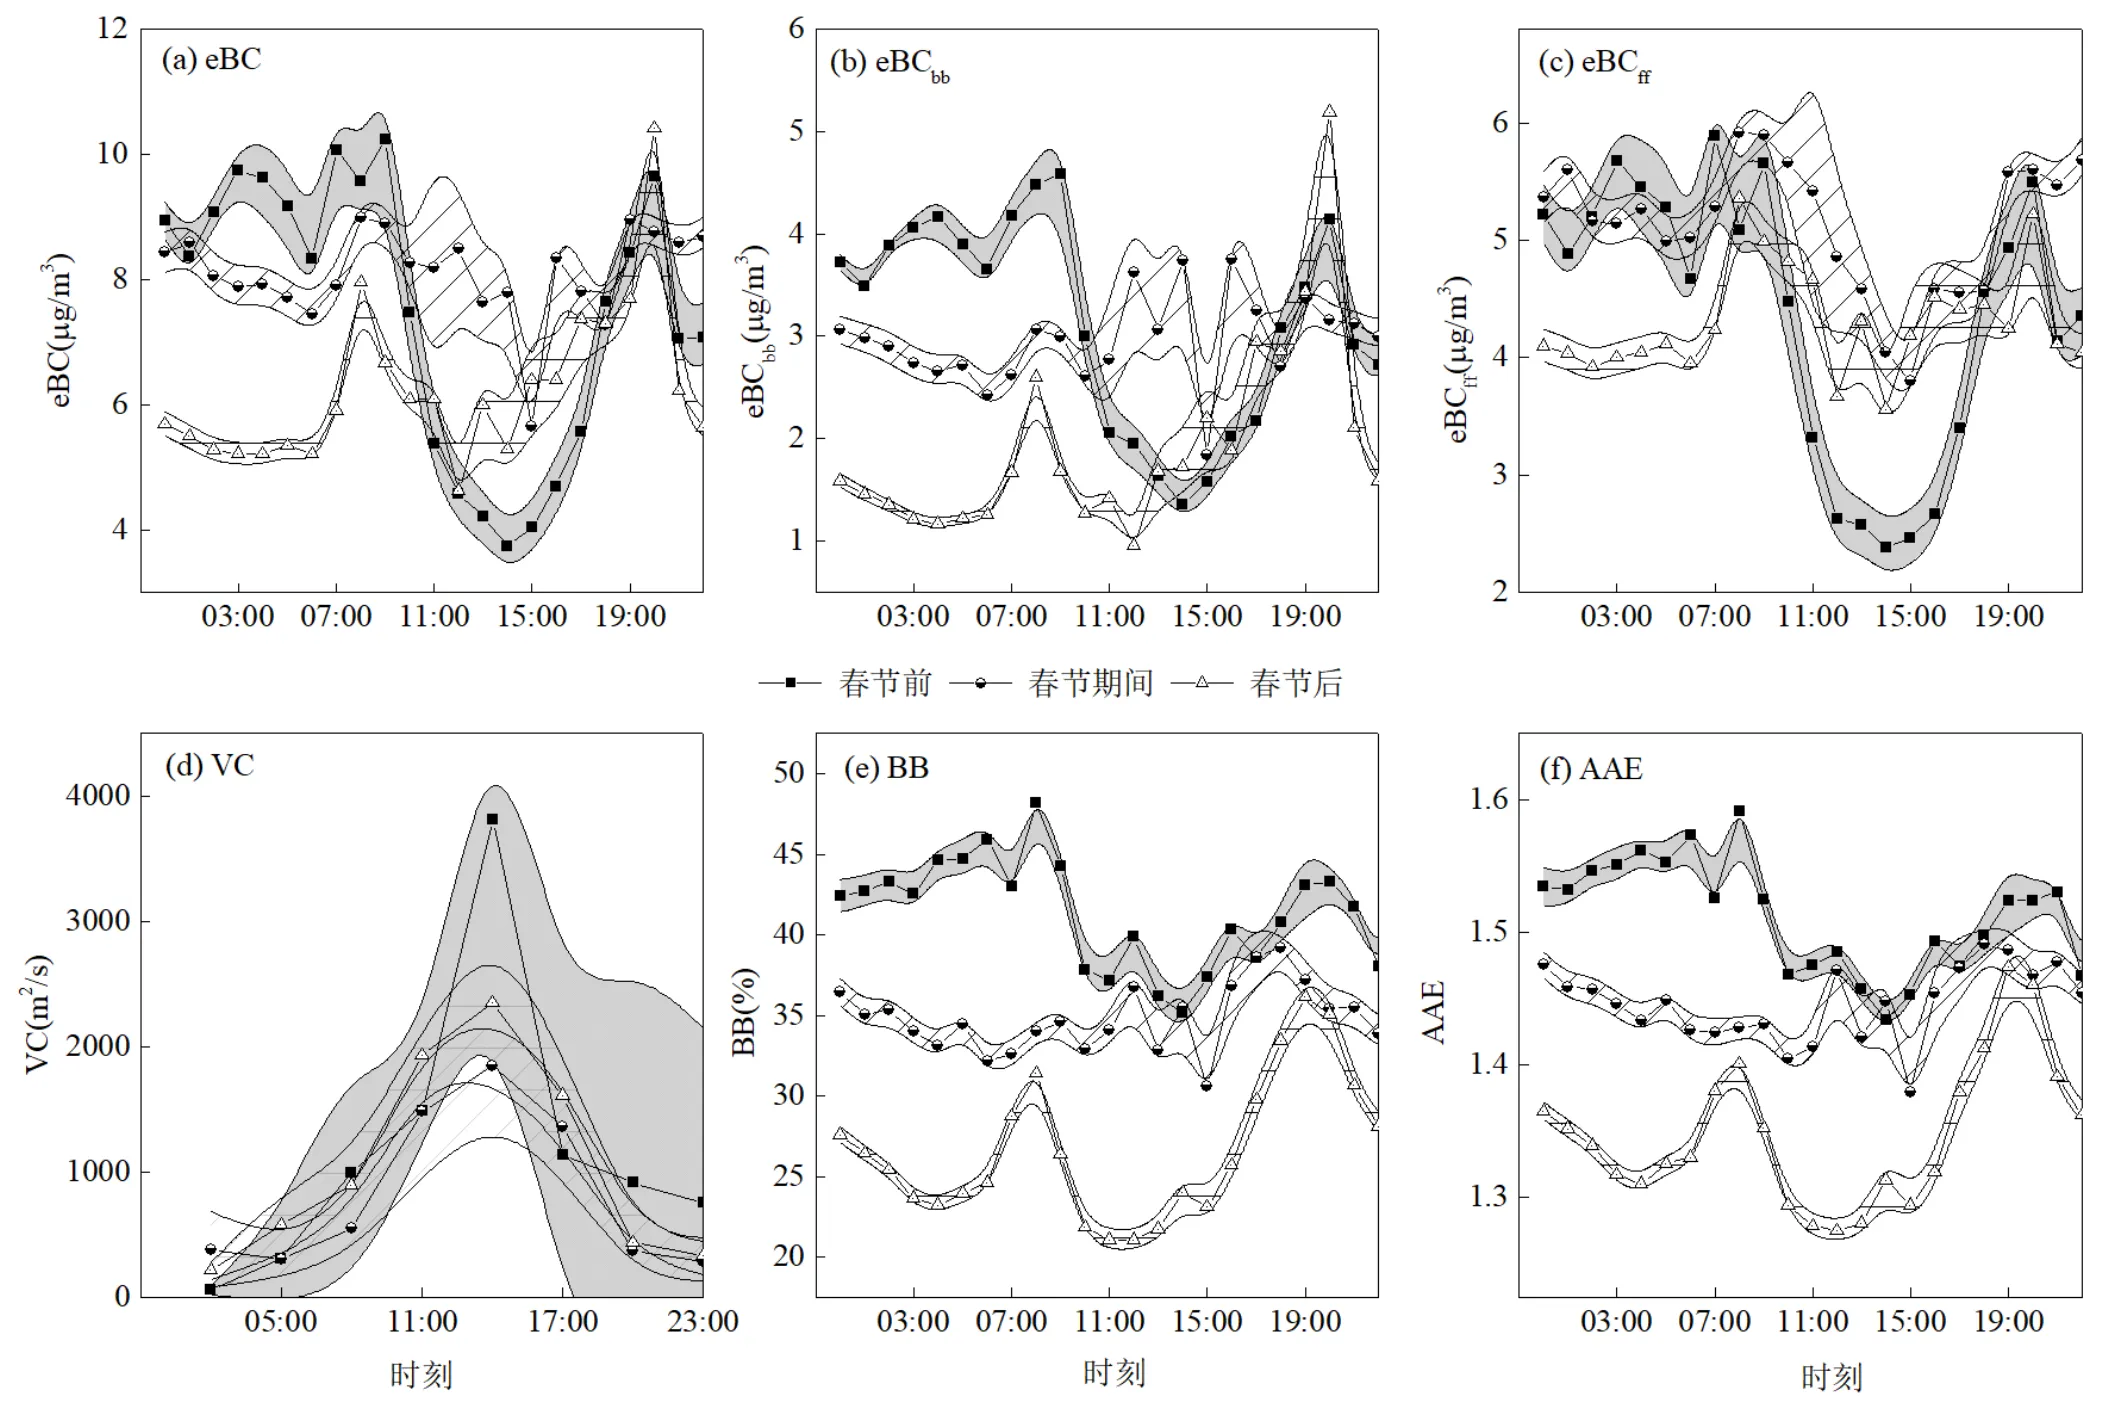
图5 不同时期各参数的昼夜变化特征Fig.5 The diurnal variation of each parameter

表3 我国部分站点eBC浓度对比
2.4 eBC的潜在源区分析
气团的移动可以将远距离污染物输送至研究区域,造成当地eBC浓度变化[54].为得到影响观测站点eBC的潜在源区及其相应贡献程度,本文采用了浓度权重轨迹分析法(CWT).计算过程中,以500m为研究地区大气边界层的平均流场高度,以不同研究时期24个时次(00:00~23:00)的eBC质量浓度为研究对象,得到了每日气团72h后向轨迹来反映观测区域周围的气流和污染物运动特征.
图6(a)~(c)是研究期间研究区域eBC的CWT计算结果.可知,春节前后气流轨迹变化和潜在源区及贡献均存在差异.春节前eBC主要潜在源区位于观测点周边区域,包括河南境内及河南与湖北交界处,贡献值达11μg/m3左右,此外,来自湖北境内的污染气团也有较大贡献,贡献值达9μg/m3左右;春节期间,eBC污染潜在源分布区域较广,除河南省内污染气团贡献值达9μg/m3左右之外,来自山西、陕西、安徽及江苏的污染气团贡献值达10μg/m3以上.这可能是由于春节期间上述范围内,较多的烟花燃放和生物质燃烧等人为活动排放的污染物随气团扩散,造成研究区域eBC浓度较高.此外,该时期来自海上的污染气团贡献值达12μg/m3以上.春节后由于假期结束,以上人为活动排放减少,该时期来自当地及其他区域的污染气团贡献值基本在5~8μg/m3间.研究期间,来自西伯利亚的气团也携带少量eBC (0.2~ 3μg/m3).

表4 农村、城市和背景点位黑碳气溶胶的波长吸收指数(AAE)对比
图6(d)~(f)和6(g)~(i)分别是eBCbb和eBCff的CWT结果.在春节前和春节期间,其与eBC的CWT结果类似,外来污染气团对研究区域的eBCbb和eBCff贡献值(分别为3~5μg/m3和6~7μg/m3)较本地的高,且主要潜在源区与eBC的源区分布范围基本相同;但在春节期间,河南境内的eBCbb贡献值(3~5μg/m3)较外来污染气团的高,说明该期间河南及周边区域存在较多的生物质燃烧现象;春节后,来自东北及西伯利亚方向的污染气团携带较多eBCbb(3~5μg/m3)进入研究区域.该期间对eBCff贡献较多的区域主要为湖北、湖南及江西三省交界处(7~8μg/m3).

图6 不同时期eBC、eBCbb和eBCff浓度权重轨迹分布
3 结论
3.1 研究期间,eBC平均浓度为(6.78±6.34)μg/m3.春节前和春节期间的eBC浓度较春节后高,且在春节期间有最大值,(8.22±4.17)μg/m3,这与春节期间较活跃的人为活动(如燃放烟花爆竹和生物质燃烧等)有关.
3.2 生物质燃料燃烧产生的eBC占其总浓度百分比(BB)在春节前有最高值(41.1±5.3)%,并随时间推移逐渐减小,表明在春节前,生物质燃烧贡献程度最大.AAE变化趋势与BB保持一致,整体在1.5上下波动.说明该地区春节前后eBC污染物的化石燃料排放和生物质燃烧贡献程度接近.与城市点位相比,本研究的AAE值(1.40±0.16)偏高,eBC受生物质燃烧影响较大.
3.3 在春节前和春节后,观测地区的eBC昼夜变化存在2个明显高值时段,分别在7:00~9:00和20:00左右,这2个时段较小的通风系数和较多的生物质燃烧是主要影响因素.由于频繁的人为活动,使得春节期间全天的eBC质量浓度较大,无明显波动.
3.4 根据浓度权重轨迹分析(CWT)的结果显示,春节期间eBC的潜在源区有山西、陕西、安徽和江苏等省份,其他时期集中在河南、湖北境内.
[1] Crippa M, Decarlo P F, Slowik J G, et al. Wintertime aerosol chemical composition and source apportionment of the organic fraction in the metropolitan area of Paris [J]. Atmospheric Chemistry and Physics, 2013,13(2):961-981.
[2] Cooke W F, Liousse C, Cachier H, et al. Construction of a 1° × 1° fossil fuel emission data set for carbonaceous aerosol and implementation and radiative impact in the ECHAM4model [J]. Journal of Geophysical Research, 1999,104:22137-22162.
[3] Zhang Y, Yuan Q, Huang D, et al. Direct Observations of Fine Primary Particles From Residential Coal Burning: Insights Into Their Morphology, Composition, and Hygroscopicity [J]. Journal of Geophysical Research: Atmospheres, 2018,123(22):12,912-964,979.
[4] Liu L, Kong S, Zhang Y, et al. Morphology, composition, and mixing state of primary particles from combustion sources - crop residue, wood, and solid waste [J]. Scientific reports, 2017,7(1):5047.
[5] Huang R, Yang L, Cao J, et al. Brown Carbon Aerosol in Urban Xi’an, Northwest China: The Composition and Light Absorption Properties [J]. Environmental Science and Technology, 2018,52(12):6825-6833.
[6] Menon S, Hansen J E, Nazarenko L, et al. Climate effects of black carbon aerosols in China and India [J]. Science, 2002,297(5590): 2250-2253.
[7] Ipcc. Climate change 2013: the physical science basis. In: Contribution of Working Group I to the Fifth Assessment Report of the Intergovernmental Panel Climate change 2013: the physical science basis. In: Contribution of Working Group I to the Fifth Assessment Report of the Intergovernmental Panel on Climate Change [M]. Cambridge, United Kingdom and New York, NY, USA: Cambridge University Press, 2013.
[8] Koelmans A A, Jonker M T O, Cornelissen G, et al. Black carbon: The reverse of its dark side [J]. Chemosphere, 2006,63(3):365-377.
[9] Janssen N A H, Hoek G, Simic-Lawson M, et al. Black Carbon as an Additional Indicator of the Adverse Health Effects of Airborne Particles Compared with PM10and PM2.5[J]. Environmental Health Perspectives, 2011,119(12):1691-1699.
[10] Xu Z, Huang X, Nie W, et al. Influence of synoptic condition and holiday effects on VOCs and ozone production in the Yangtze River Delta region, China [J]. Atmospheric Environment, 2017,168:112- 124.
[11] Ru-Jin H, Yanlin Z, Carlo B, et al. High secondary aerosol contribution to particulate pollution during haze events in China [J]. Nature, 2014,514(7521):218-222.
[12] Chang X, Wang S, Zhao B, et al. Assessment of inter-city transport of particulate matter in the Beijing-Tianjin-Hebei region [J]. Atmospheric Chemistry and Physics, 2017:1-28.
[13] Wu S, Deng F, Wei H, et al. Association of cardiopulmonary health effects with source-appointed ambient fine particulate in Beijing, China: a combined analysis from the Healthy Volunteer Natural Relocation (HVNR) study [J]. Environmental Science and Technology, 2014,48(6):3438-3448.
[14] 李珊珊,程念亮,徐 峻,等.2014年京津冀地区PM2.5浓度时空分布及来源模拟 [J]. 中国环境科学, 2015,35(10):2908-2916. Li S S, Cheng N L, XU J.Spatial and temporal distrubions and source simulation of PM2.5in Beijing-Tianjin-Hebei region in 2014 [J]. China Environmental Science, 2015,35(10):2908-2916.
[15] Chen H, Wang H. Haze Days in North China and the Associated Atmospheric Circulations Based on Daily Visibility Data from 1960 to 2012 [J]. Journal of Geophysical Research Atomosphere, 2015,120 (12):5895-5909.
[16] Wang W, Simonich S, Giri B, et al. Atmospheric concentrations and air–soil gas exchange of polycyclic aromatic hydrocarbons (PAHs) in remote, rural village and urban areas of Beijing–Tianjin region, North China [J]. Science of The Total Environment, 2011,409(15):2942- 2950.
[17] Wang Z, Xin H, Ding A. Dome effect of black carbon and its key influencing factors: A one-dimensional modelling study [J]. Atmospheric Chemistry and Physics, 2018,18(4):1-29.
[18] Chen D, Liu X, Lang J, et al. Estimating the contribution of regional transport to PM2.5air pollution in a rural area on the North China Plain [J]. Science of The Total Environment, 2017,583:280-291.
[19] 杨 浩,白永清,刘 琳,等.基于轨迹聚类河南地区大气污染过程空气输送通道研究 [J]. 气象与环境学报, 2017,33(4):29-39. Yang H, Bai Y Q, Liu L, et al. Analysis of air transport channels during pollution process in He'nan province based on trajector clustering [J]. Journal of Meteorology and Environment, 2017,33(4): 29-39.
[20] Feng J, Yu H, Su X, et al. Chemical composition and source apportionment of PM2.5during Chinese Spring Festival at Xinxiang, a heavily polluted city in North China: Fireworks and health risks [J]. Atmospheric Research, 2016,182:176-188.
[21] Ji D, Cui Y, Li L, et al. Characterization and source identification of fine particulate matter in urban Beijing during the 2015 Spring Festival [J]. Science of the Total Environment, 2018,s628–629:430- 440.
[22] Zhao S, Chen L, Yan J, et al. Characterization of lead-containing aerosol particles in Xiamen during and after Spring Festival by single-particle aerosol mass spectrometry [J]. Science of the Total Environment, 2017,580:1257-1267.
[23] Tian Y Z, Wang J, Peng X, et al. Estimation of the direct and indirect impacts of fireworks on the physicochemical characteristics of atmospheric PM10and PM2.5[J]. Atmospheric Chemistry and Physics, 2014,14(18):9469-9479.
[24] Kong S F, Li L, Li X X, et al. The impacts of firework burning at the Chinese Spring Festival on air quality: insights of tracers, source evolution and aging processes [J]. Atmospheric Chemistry and Physics, 2015,15(4):2167-2184.
[25] Huang K, Zhuang G, Lin Y, et al. Impact of anthropogenic emission on air quality over a megacity – revealed from an intensive atmospheric campaign during the Chinese Spring Festival [J]. Atmospheric Chemistry and Physics, 2012,12(23):11631-11645.
[26] Jiang Q, Sun Y L, Wang Z, et al. Aerosol composition and sources during the Chinese Spring Festival: fireworks, secondary aerosol, and holiday effects [J]. Atmospheric Chemistry and Physics Discussions, 2014,14(14):20617-20646.
[27] Ramachandran S, Kedia S. Black carbon aerosols over an urban region: Radiative forcing and climate impact [J]. Journal of Geophysical Research, 2010,115(D10):1-11.
[28] Ran L, Deng Z Z, Wang P C, et al. Black carbon and wavelength- dependent aerosol absorption in the North China Plain based on two-year aethalometer measurements [J]. Atmospheric Environment, 2016,142:132-144.
[29] 吴 兑,毛节泰,邓雪娇,等.珠江三角洲黑碳气溶胶及其辐射特性的观测研究 [J]. 中国科学(D辑:地球科学), 2009,39(11):1542-1553. Wu D, Mao J T, Deng X J, et al. Black carbon aerosols and their radiative properties in the Pearl River Delta region [J]. Sci China Ser D-Earth Sci, 2009,39(11):1542-1553.
[30] Drinovec L, Močnik G, Zotter P, et al. The "dual-spot" Aethalometer: an improved measurement of aerosol black carbon with real-time loading compensation [J]. Atmospheric Measurement Techniques Discussions, 2014,7(9):10179-10220.
[31] Aki V, Timo M K, Risto H, et al. A simple procedure for correcting loading effects of aethalometer data [J]. Journal of the Air and Waste Management Association (1995), 2007,57(10):1214-1222.
[32] Lin C Q, Liu G, Lau A K H, et al. High-resolution satellite remote sensing of provincial PM2.5trends in China from 2001 to 2015 [J]. Atmospheric Environment, 2018,180:110-116.
[33] Kirchstetter T W, Novakov T, Hobbs P V. Evidence that the spectral dependence of light absorption by aerosols is affected by organic carbon [J]. Journal of Geophysical Research: Atmospheres, 2004,109 (D21):1-12.
[34] Sandradewi J, Prévôt A S H, Szidat S, et al. Using Aerosol Light Absorption Measurements for the Quantitative Determination of Wood Burning and Traffic Emission Contributions to Particulate Matter [J]. Environmental Science and Technology, 2008,42(9):3316-3323.
[35] Zotter P, Herich H, Gysel M, et al. Evaluation of the absorption Ångström exponents for traffic and wood burning in the Aethalometer based source apportionment using radio carbon measurements of ambient aerosol [J]. Atmospheric Chemistry and Physics Discussions, 2016,17(6):1-29.
[36] 孙欢欢,倪长健,崔 蕾.成都市黑碳气溶胶污染特征及与气象因子的关系 [J]. 环境工程, 2016,34(6):119-124. Sun H H, Li C J, Cui L. Characteristics of black carbon aerosol pollution in Chengdu and the relationship between meteorological factors [J]. Environmental Engineering, 2016,34(6):119-124.
[37] 程 丁,吴 晟,吴 兑,等.深圳市城区和郊区黑碳气溶胶对比研究 [J]. 中国环境科学, 2018,38(5):1653-1662. Cheng D, Wu S, Wu D, et al. Comparative study on the characristics of black carbon aerosols in urban and suburban area of Shenzhen [J]. China Environmental Science, 2018,38(5):1653-1662.
[38] 肖思晗,于兴娜,朱 彬,等.南京北郊黑碳气溶胶的来源解析 [J]. 环境科学, 2018,37(9):3280-3289. Xiao S H, Yu X N, Zhu B, et al. Source apportionment of black carbon aerosols in the North suburb of Nanjing [J]. Environmental Science, 2018,37(9):3280-3289.
[39] 程 丁,吴 晟,吴 兑,等.广州市城区干湿季黑碳气溶胶污染特征及来源分析 [J]. 环境科学学报, 2018,38(5):2223-2232. Cheng D, Wu S, Wu D, et al. Characteristics of black carbon aerosols in urban Guangzhou: influencing factors in dry and rainy seasons [J]. Acta Scientiae Circumstantiae, 2018,38(5):2223-2232.
[40] 张宸赫,程兴宏,赵天良,等.不同季节气象条件对北京城区高黑碳浓度变化的影响 [J]. 环境科学学报, 2017,37(6):227-236. Zhang Z H, Cheng X H, Zhao T L, et al. Impact of meteorological conditions on high black carbon concentrations in urban area of Beijing in different seasons [J]. Acta Scientiae Circumstantiae, 2017, 37(6):227-236.
[41] Prasad P, Roja Raman M, Venkat Ratnam M, et al. Characterization of atmospheric Black Carbon over a semi-urban site of Southeast India: Local sources and long-range transport [J]. Atmospheric Research, 2018,213:411-421.
[42] 钟玉婷,刘新春,何 清,等.乌鲁木齐冬季黑碳气溶胶污染特征及来源的初步研究 [J]. 沙漠与绿洲气象, 2014,8(6):36-40. Zhong Y T, Liu X C, et al. Pollution Characteristics and Source of Black Carbon Aerosols in Urumqi in Winter [J].Desert and Oasis Meteorology, 2014,8(6):36-40.
[43] Martinsson J, Abdul Azeem H, Sporre M K, et al. Carbonaceous aerosol source apportionment using the Aethalometer model – evaluation by radiocarbon and levoglucosan analysis at a rural background site in southern Sweden [J]. Atmospheric Chemistry and Physics, 2017,17(6):4265-4281.
[44] 夏芸洁,武云飞,郭振海,等.华东乡村站点气溶胶吸收特性的观测研究 [J]. 中国粉体技术, 2017,23(6):17-23. Xia Y J, Wu Y F, Guo Z H, et al. Observational study on aerosol absorption at a rural site in Northern China [J]. China Powder Science and Technology, 2017,23(6):17-23.
[45] Wu D, Wu C, Liao B, et al. Seasonal variation of black carbon over the South China Sea and in various continental locations in South China [J]. Atmospheric Chemistry and Physics, 2013,13(7):17375- 17405.
[46] 汤 洁,温玉璞,周凌晞,等.中国西部大气清洁地区黑碳气溶胶的观测研究 [J]. 应用气象学报, 1999,10(2):160-170. Tang J, Wen Y P, Zhou L X, et al. Observational study of black carbon in clean air area of Western China [J]. Quarterly Journal of Applied Meteorology, 1999,10(2):160-170.
[47] Dumka U C. Scattering and absorption properties of near-surface aerosol over Gangetic–Himalayan region: the role of boundary-layer dynamics and long-range transport [J]. Atmospheric Chemistry and Physics, 2015,15(15):1555-1572.
[48] Segura S, Estellés V, Esteve A R, et al. Multiyear in-situ measurements of atmospheric aerosol absorption properties at an urban coastal site in western Mediterranean [J]. Atmospheric Environment, 2016,129:18-26.
[49] Wang P, Che H, Zhang X, et al. Aerosol optical properties of regional background atmosphere in Northeast China [J]. Atmospheric Environment, 2010,44(35):4404-4412.
[50] Devi J J, Bergin M H, Mckenzie M, et al. Contribution of particulate brown carbon to light absorption in the rural and urban Southeast US [J]. Atmospheric Environment, 2016,136:95-104.
[51] Begam G R, Vachaspati C V, Ahammed Y N, et al. Measurement and analysis of black carbon aerosols over a tropical semi-arid station in Kadapa, India [J]. Atmospheric Research, 2016,171:77-91.
[52] Goyal P, Anand S, Gera B S. Assimilative capacity and pollutant dispersion studies for Gangtok city [J]. Atmospheric Environment, 2006,40(9):1671-1682.
[53] Sujatha P, Mahalakshmi D V, Ramiz A, et al. Ventilation coefficient and boundary layer height impact on urban air quality [J]. Cogent Environmental Science, 2016,2(1):1125284.
[54] Rajesh T A, Ramachandran S. Black carbon aerosols over urban and high altitude remote regions: Characteristics and radiative implications [J]. Atmospheric Environment, 2018,194:110-122.
Levels and sources of black carbon around the spring festival at a rural site of the North China Plain.
LIU Xi1, KONG Shao-fei1*, ZHENG Shu-rui1, ZHENG Huang1, YAN Qin1, WU Jian1, CHENG Yi1, WU Fang-qi1, NIU Zhen-zhen1, ZENG Xin1,CHEN Nan2, XU Ke2, QI Shi-hua1,3
(1.School of Environmental Studies, China University of Geosciences, Wuhan 430074, China;2.Hubei Environmental Monitoring Center, Wuhan 430072, China;3.State Key Laboratory of Biogeology and Environmental Geology, China University of Geosciences, Wuhan 430074, China)., 2019,39(8):3169~3177
To obtain the mass concentrations, diurnal variations and sources of black carbon (eBC) aerosol around the Chinese spring festival (SF) in rural regions of the North China Plain, one-month (2018-2-12~2018-3-12) online continuous measurement of black carbon was conducted at a rural site in Henan province. During the SF, the eBC concentration was highest, (8.22±4.17)μg/m3, suggesting intensive emissions from anthropogenic activities. Before the SF, the contribution of biomass burning was the largest (41.1±5.3)%, and then gradually decreased down to (26.8±12.0)%. During the study period, the calculated AAE value (1.40±0.16) indicated that the contribution of biomass burning to eBC was close to that of fossil fuel in this area. Compared with some urban sites, the AAE value in this study was higher. Before and after the SF, the eBC mass concentrations show significant diurnal variations, with 2 peak values occurring at 07:00~09:00 and around 20:00 (local time). During the SF, the diurnal variation of eBC mass concentration did not fluctuate obviously. According to the concentration-weighted trajectories analysis, the main potential source regions of eBC were Shanxi, Shaanxi, Anhui, and Jiangsu provinces during the SF. In other two periods, Henan and Hubei provinces could be the main impact regions. This study is meaningful to identify the impact of BC emitted from rural combustion sources on regional haze formation and evolution, and it can also supply the dataset for corresponding modeling of BC’s impacts on climate, air quality and human health.
black carbon aerosol;the spring festival;sources;rural region;North China Plain
X513
A
1000-6923(2019)08-3169-09
刘 玺(1995-),男,湖南郴州人,硕士研究生,主要从事大气污染源排放清单研究.
2019-01-22
科技部国家重点研发计划课题(2016YFA0602002; 2017YFC0212602);湖北省科技厅技术创新专项重大项目(2017ACA089);国家自然科学基金资助重点项目(41830965);湖北省环保厅环保科研项目(2017HB11);中国地质大学(武汉)高层次人才科研启动经费资助项目(201616;201802);中央高校基本科研业务费专项资金资助项目-腾飞计划(162301182756)
* 责任作者, 教授, kongshaofei@cug.edu.cn
