Analysis on nasal airway by using scale-adaptive simulation combined with standard model and 3D printing modeling physical experiment
2019-08-17JieminZhanYangyangXiKayLinWeiguangYuWenqingHu
Jiemin Zhan, Yangyang Xi, Kay Lin, Weiguang Yu, Wenqing Hu
Department of Applied Mechanics, Sun Yat-sen University, Guangzhou 510275, China
Keywords:3D printer Scale-adaptive simulation Upper respiratory tract Physical experiment
A B S T R A C T The physiological structure of the upper respiratory tract is complex and varies with each individual, and the circulating air has turbulent performance. In this paper, based on computed tomography (CT) medical images published online and the three-dimensional (3D) printing technology, a 3D model of the human upper respiratory tract was reconstructed and an experimental device of the upper respiratory tract was made. We implemented the respiratory experiment and measured the flow rate, and a scale-adaptivemodel is applied for numerical simulation, the results are in good agreement. The flow field during respiratory was analyzed by coronal velocity cross section, vortex line and particle tracks. We found that the relatively strong shear effect happens at the areas of nasal valve and nasopharynx. In the middle and upper nasal tract, vortex line separation occurs and there is significant passage effect. The results indicate that SAS method is effective in studying upper respiratory airflow.
Nasal airway researching had drawn great attention for a long time to the experts of not only the fluid mechanics but also the medical due to its great potentiality in contribution to academic and practicability in medical science [1]. The better understanding of nasal airway could not only help us to comprehend the mechanism of the basic functions of nasal breathing(smelling, air-conditioning and filtering), also lead to the quick diagnose and medical treatment measure decision for various kind of diseases related to nasal cavity. It's well known that the characteristic of unsteady flow of nasal airway and the complexity of nasal cavity geometry were creating the greatest barriers for deep analysis and good accuracy [2, 3]. For fully understanding of the physics of the turbulent flow through the nasal airway,we employed scale-adaptive simulation (SAS) model techniques to capture the unsteady phenomena.
In order to avoid the weakness of large eddy simulation (LES)(too expensive) and unphysical single mode and unsteady behavior (unsteady Reynolds average Navier-Stokes (URANS)), we decided to utilize the SAS model which provides URANS with LES content in unsteady regions.The core of SAS was the blending in of von Karman length-scale to the turbulence scale equation, by means of modification of Rotta's equation to integral length-scale. The von Karman length-scale empowered the SAS model in both the advantages of standard capabilities in stable flow regions (Reynolds average Navier-Stokes (RANS)) and LES(unsteady regions in the flow field) [4]. The equations below was showing the mathematical formulation of SAS model [5]
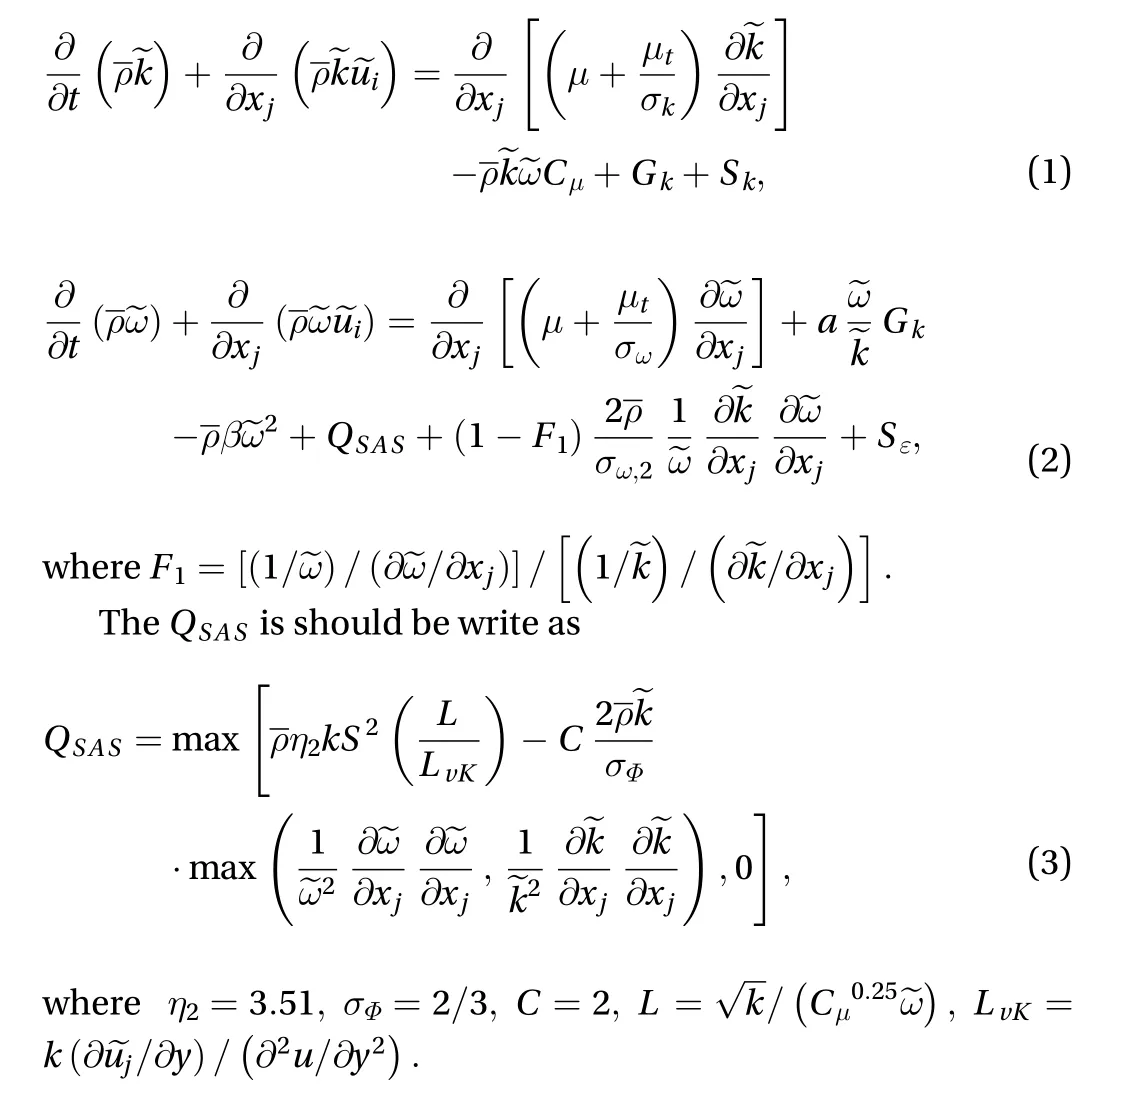
Many recent research was showing that the capability of SAS model to resolve the turbulent flow structures, and to predict the major unsteady phenomena with a remarkable advantage than the RANS models. The computational costing required by this model compared to that the LES required made it a good tool for simulating three-dimensional (3D) unsteady complex flows [6].Due to the complexity of the nasal cavity geometrical structure,it's very difficult for the structured grid for the entire cavity, that's why we implemented the hybrid grid. In the vicinity of the wall we generated the unstructured grid, and the growth rate of the grid was 1.1. Then we put the structured hexahedron grid in the middle of the airway (see Fig. 1). By this, for the model, the total number of grid was about 0.56 million.
We utilized the model via the data downloaded from internet [7], which is public and easy for the follow-up researcher for continuing the work. To get accurate geometry of nasal cavity,also to avoid missing of characteristic of the nasal cavity, we reconstructed the 3D model of nasal cavity by using computed tomography (CT) scan data from a volunteer. This 3D model was using for both the numerical simulation also for the breathing experiment we designed for validating the result of numerical simulation. Figure 2 is the assembly diagram of the experimental device. The three openings of the model are connected to the flowmeter. The experimental model was produced by photosensitive resin 3D printer (FormLabs), with x/y positioning accuracy of 25 μm and printing accuracy of 0.05 mm. A high-resolution air flow meter was installed to measure the respiration process.
A good agreement was found by comparison of experiment data and computational fluid dynamics (CFD) simulation under SAS model. The upper airway model used in this study had mild septal deviation, which was considered to be one of the reasons of uneven nostril flow. It is worth mentioning that the flow ratio of numerical simulation has a slight oscillation phenomenon,but the experimental results have not observed this phenomenon, which may be due to the low sampling frequency of the flowmeter [8].
From the velocity on coronal velocity cross section (Fig. 3),we could tell that there was a big difference in the velocity distribution between inspiration and expiration. In terms of nasopharyngeal area, the high-speed area of inspiration was concentrated in the upper nasopharynx, while that of expiration was concentrated in the middle and lower nasopharynx. During the inspiration, the middle and upper nasal tract showed obvious high velocity area, while during the expiration, the middle and lower nasal tract exhibited higher velocity compared to the upper part.
Vortex lines in the Fig. 3 mostly indicated the shear degree of airflow to the wall surface, the vortex lines are mostly close to the wall, and the airflow where the vortex lines are concentrated has a great influence on the wall surface of the upper respiratory tract, such as the nasopharyngeal area. In addition, the vortex lines also indicated the distribution of the vortex structures of upper airway cavity, and the region that the airflow could reach.For example, the range of vortex line in the nasal valve area during the inspiration phase was small, while that in the exhalation phase was large. It could be seen from the dynamic vortex diagram that there were three separate vortex lines in the middle and upper nasal tract region, and they temporarily stayed in the olfactory cleft region after separation. During the respiratory transition, the separated vortex lines rejoined at the middle superior nasal tract. In this regard, vortex line could clearly reflect the passage effect of airflow in the respiratory process [9, 10].
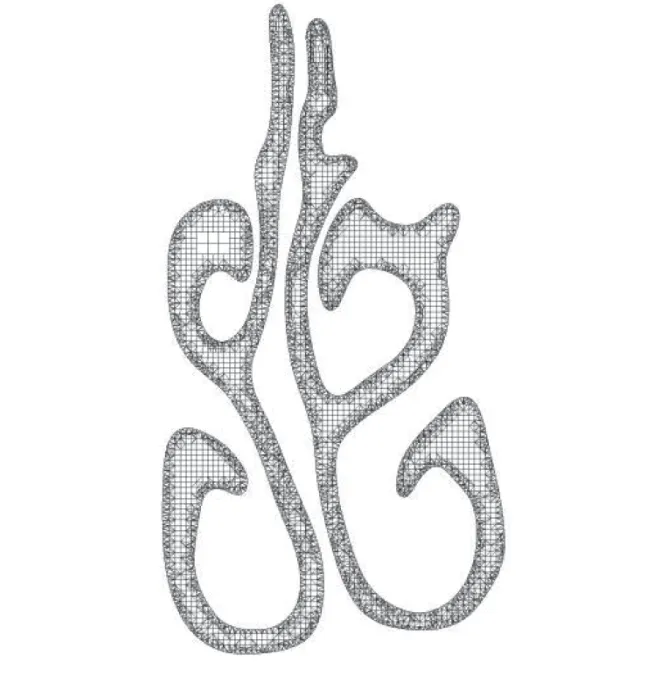
Fig. 1. Hybrid meshes
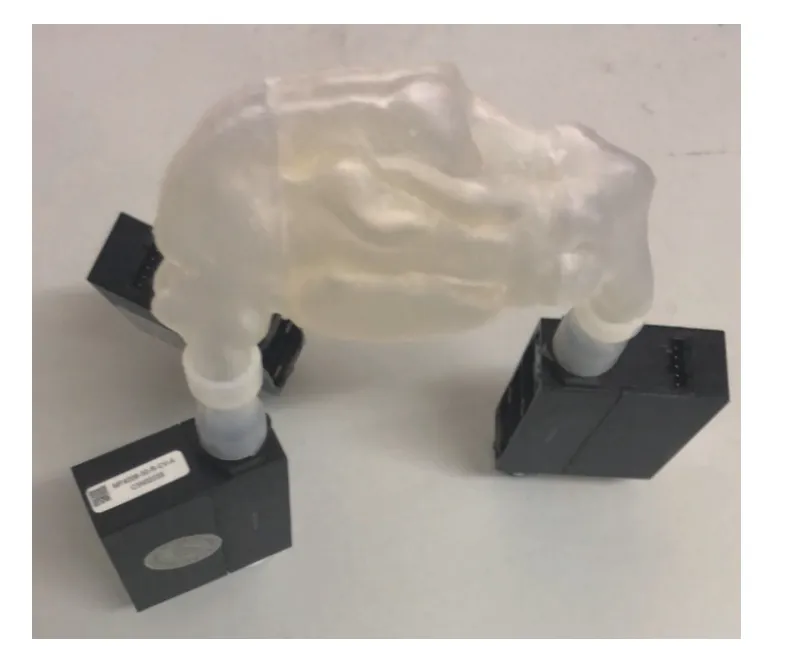
Fig. 2. 3D-printing model attached with flow meters
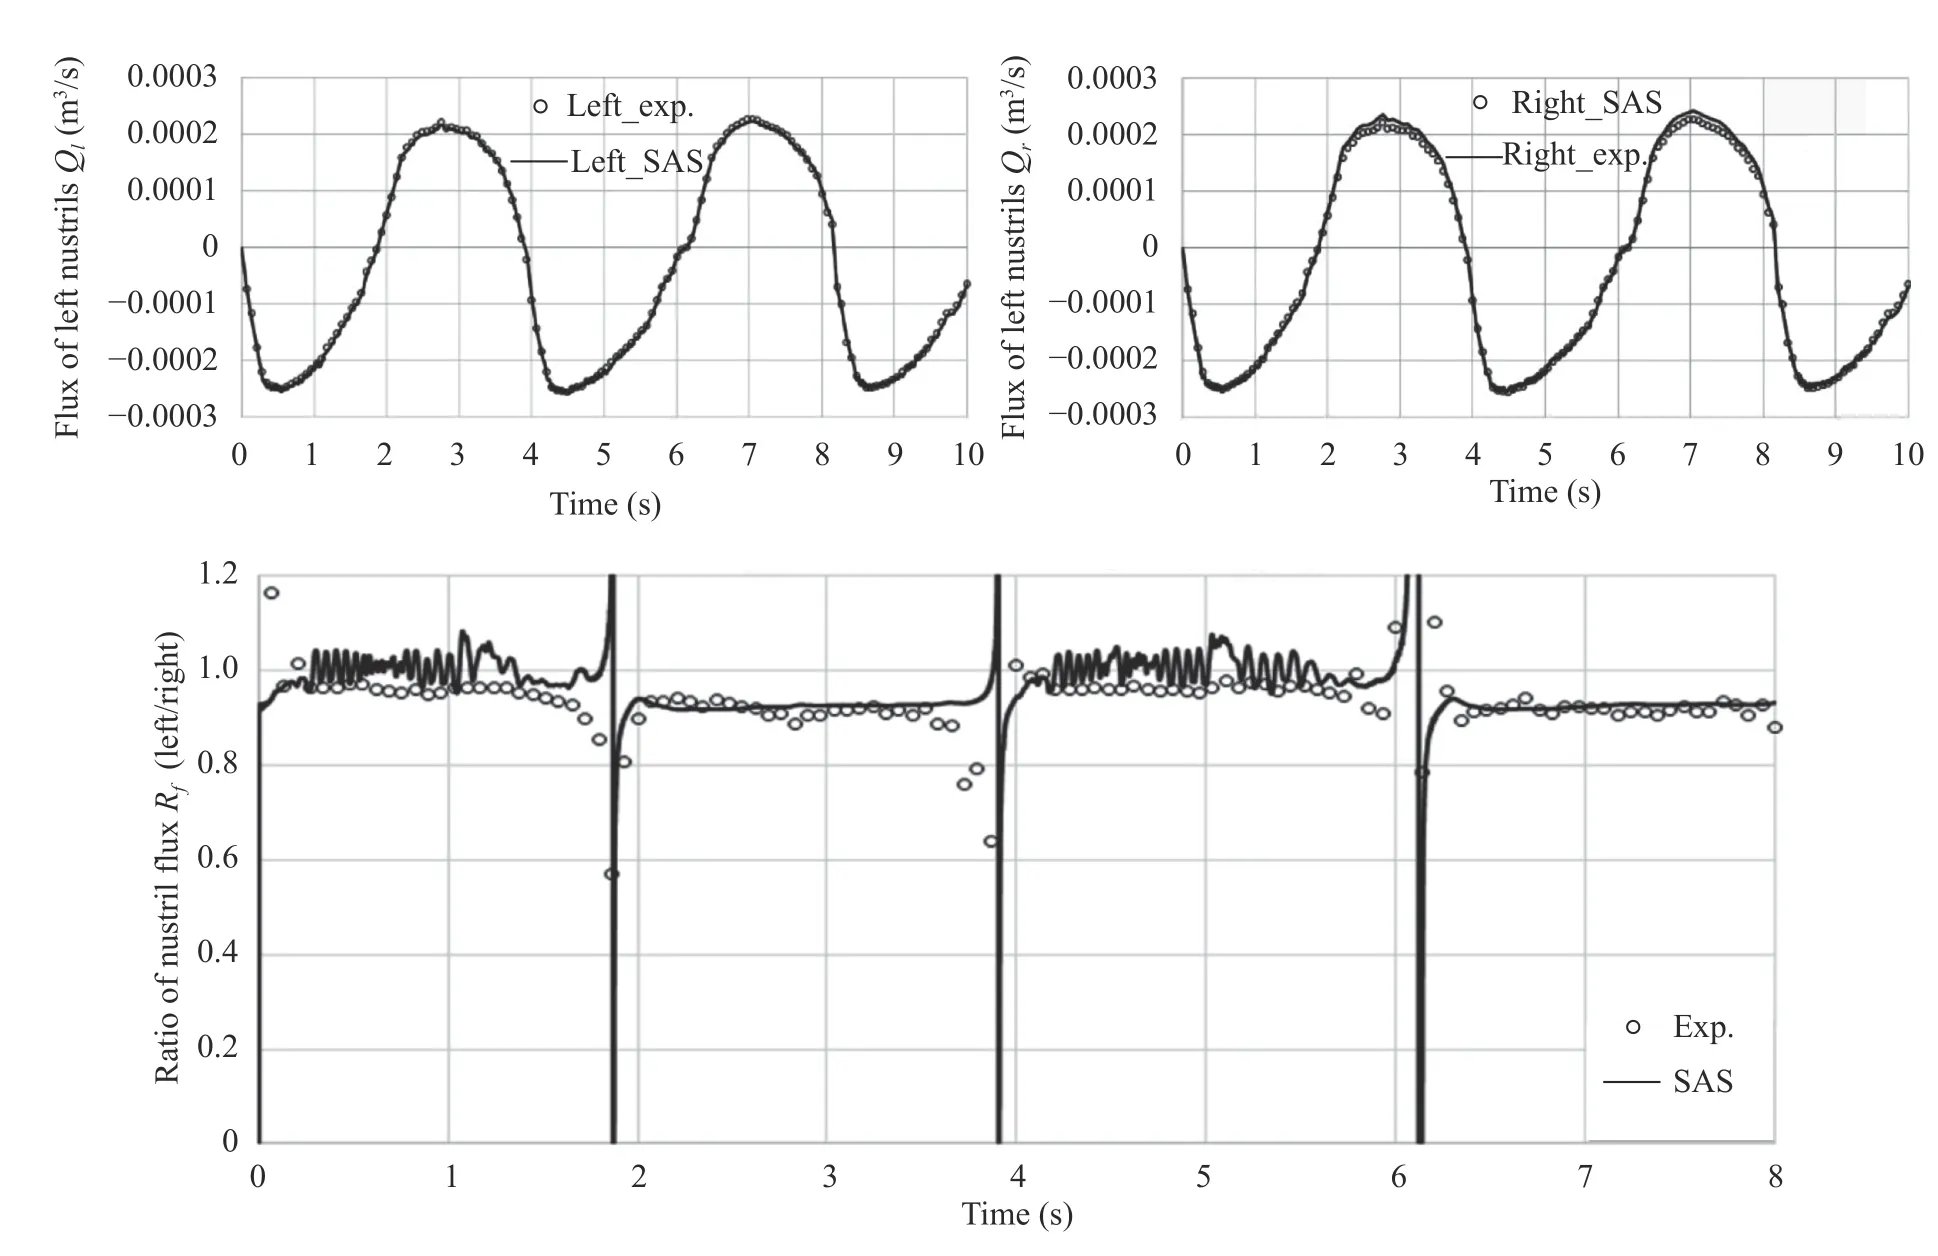
Fig. 3. Flux of nostrils and ratio of left/right nostril flux.
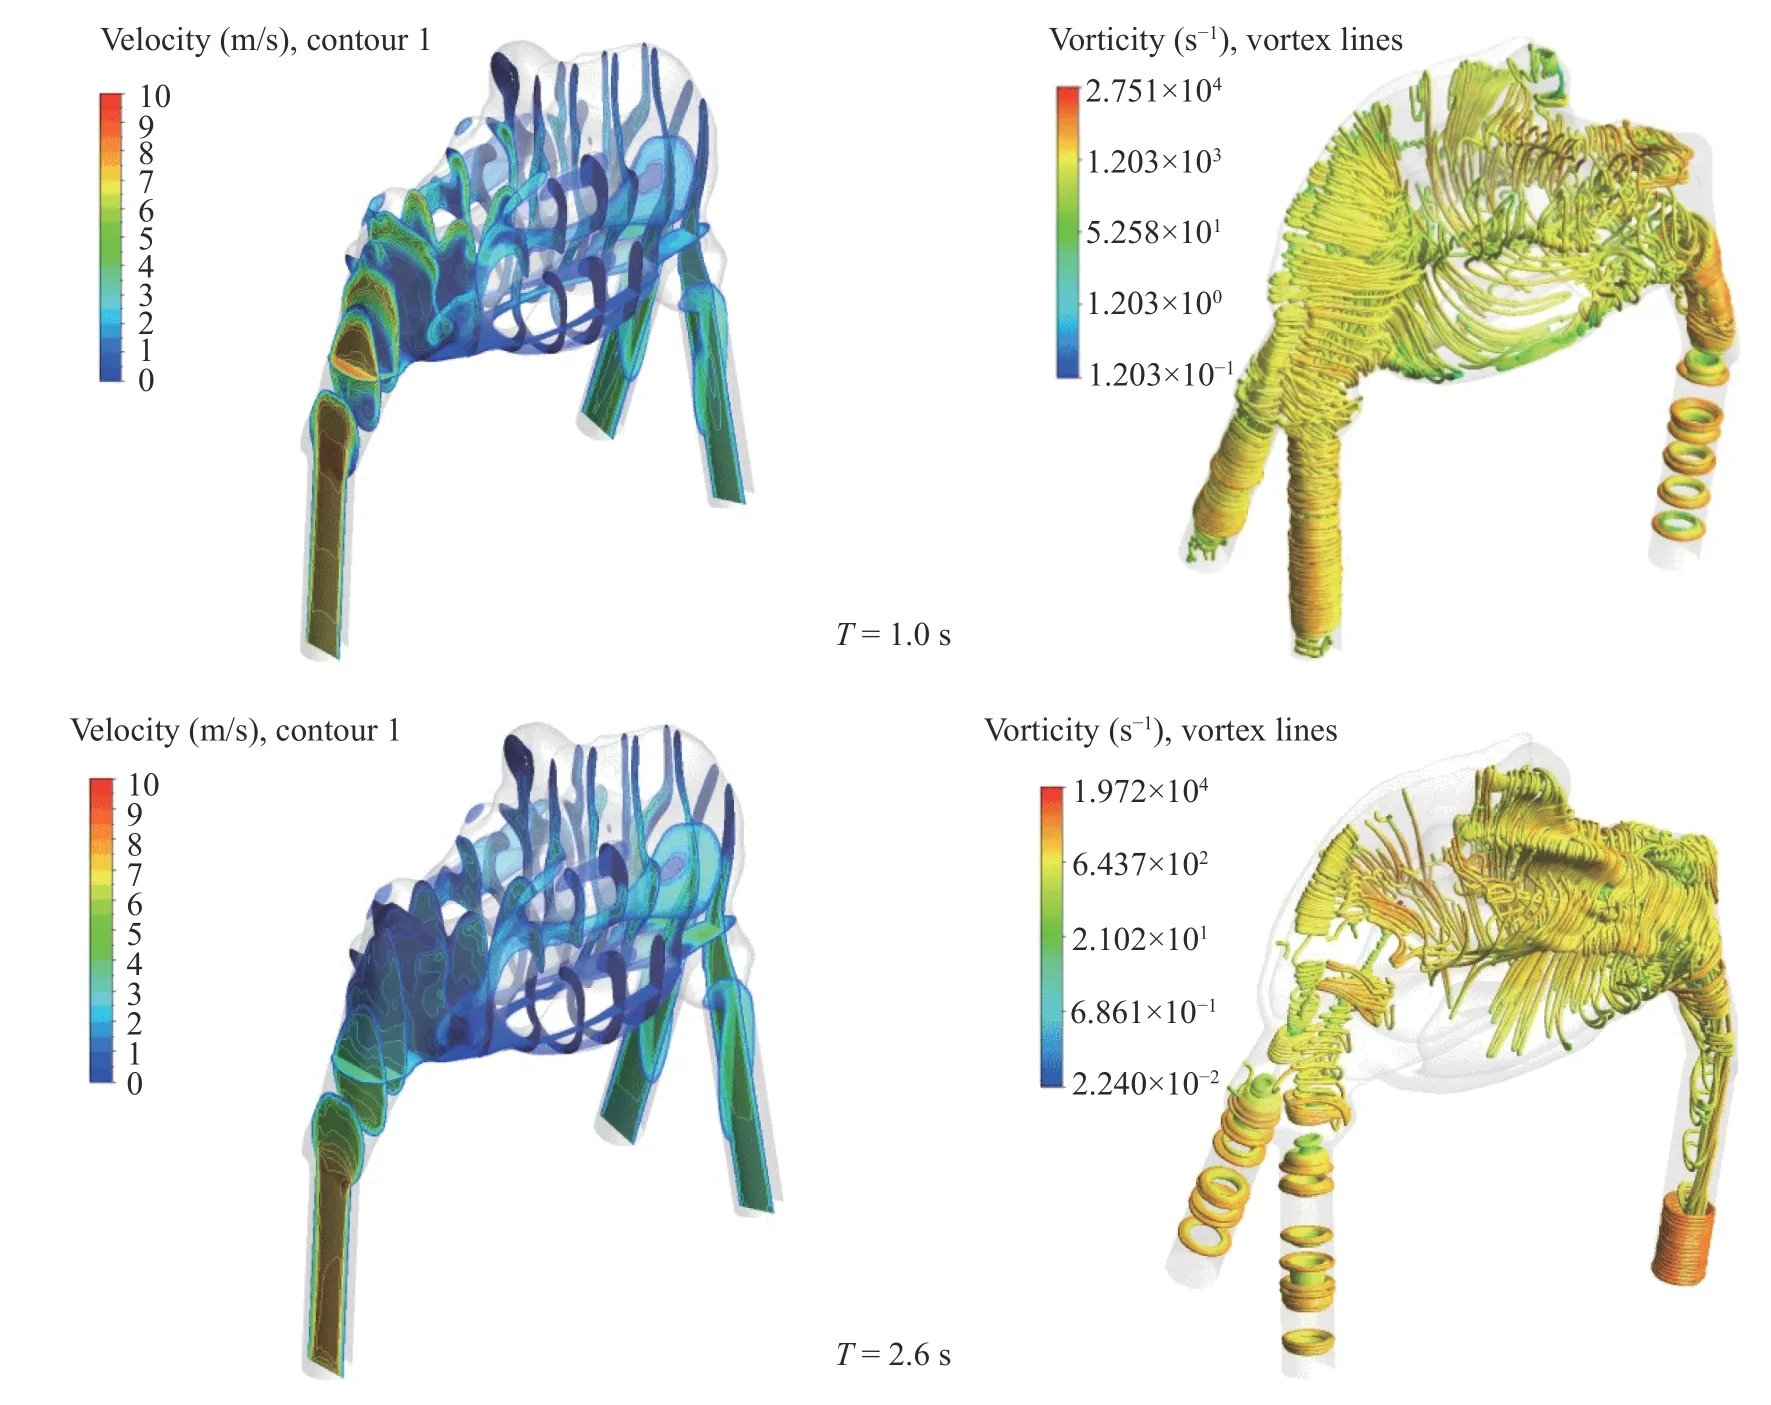
Fig. 4. Velocity on different sections vs. the vortex line in different times
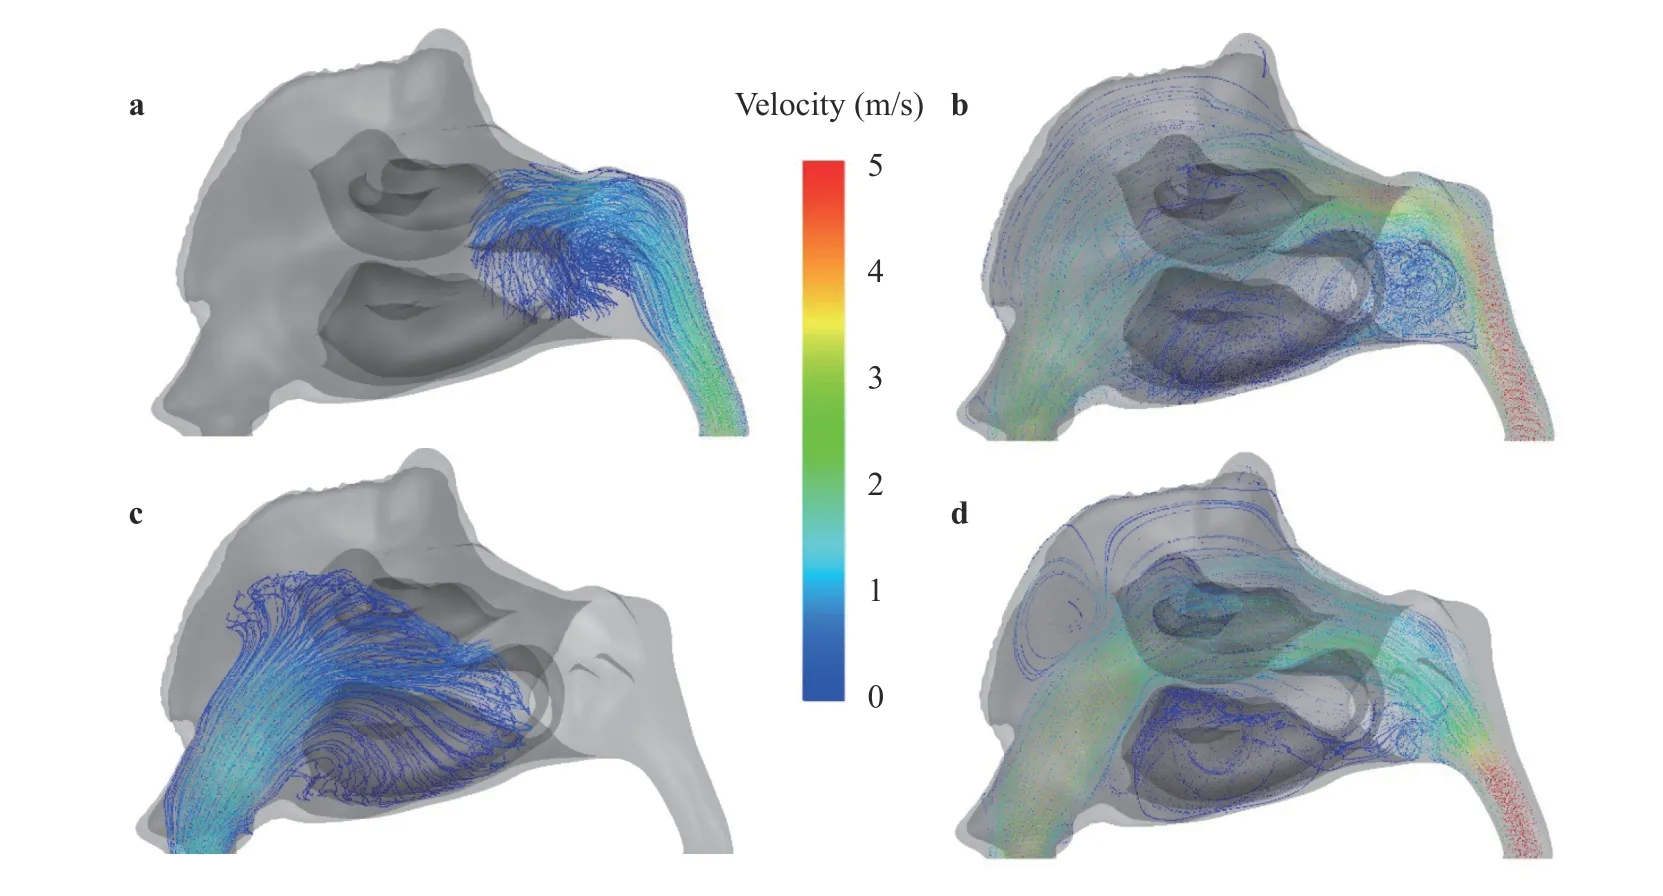
Fig. 5. Streak line at different moment. a Initiating of expiration, b peak moment of expiration, c initiating of inspiration, d peak moment of inspiration.
Furthermore, it could be seen in Fig. 4 that in the process of respiratory, the distribution of vortex lines around the middle nasal tract was chaotic, indicating that the vortex here was relatively complex, especially in the nasopharynx and left nasal valve area, where vortex tubes could be seen. According to the vortex lines figures, the vortex happened mainly at the zones of nasopharynx and nostril, which aligned with findings of other research that the strong vortex happened at that areas for improving respiration [2, 11].
By analyzing the streak lines in Fig. 5 during respiration, the difference of contacting between air and nasal areas was detected between these two phases. During the respiratory transition phase, there was a difference in the way air entering and exiting the upper respiratory tract: when the expiration turned to the inspiration, the air reached the front area of the middle nasal tract at a higher speed, from which the upper nasal tract and the lower nasal tract were dispersed. As you inhaling and exhaling,the air was directed by the physiological structure of the nasopharyngeal region, and was dispersed down to the middle nasal tract. The air distributed all over the nasal cavity during expiration while it mainly passed through middle meatus during inspiration, which were aligned were of other findings [12].
In this paper, physical model experiment and SAS numerical simulation were combined, and the results proved that the method was effective. By means of vortex line analysis, it was found that the airflow shear effect between the nasopharynx and the nasal valve was large, and vortex line separation occurred in the middle and upper nasal tract during the respiratory process.In addition, there is a significant difference in the pattern and distribution of air entry between inspiration and expiration phase, which was closely related to the physiological structure of the upper respiratory tract.
Acknowledgements
This work was supported by the Fundamental Research Funds for the Central Universities of China (Grant 17LGJC41).
杂志排行

Theoretical & Applied Mechanics Letters的其它文章
- Response to (Comment on the paper "Theoretical & Applied Mechanics Letters 7 (2017) 235-242”)
- Comment on the paper “Theoretical & Applied Mechanics Letters 7 (2017)235-242”
- Analytical modeling for rapid design of bistable buckled beams
- Comparative numerical study on the child head injury under different child safety seat angles
- Direct method for a Cauchy problem with application to a Tokamak
- Thermal explosion and irreversibility of hydromagnetic reactive couple stress fluid with viscous dissipation and Navier slips