Optimization of resistance spot brazing process parameters in AHSS and AISI 304 stainless steel joint using filler metal
2019-07-16NiwatMookam
Niwat Mookam
Department of Industrial Engineering Technology, Rajamangala University of Technology Rattanakosin
Wang Klai Kangwon Campus, Huahin,Prachuapkhirikhan, 77110, Thailand
Keywords:Resistance spot brazing Filler metal AHSS Stainless steel Intermetallic phases
A B S T R A C T The aim of this research study was to determine optimal resistance spot brazing parameters for joining between AHSS and AISI 304 stainless steel by using filler metal. The key parameters investigated in this study consist of the brazing current, electrode pressure and brazing time. The Taguchi method was applied to the design of experiments. Signal-to-Noise ratio was introduced in the study to identify optimal levels from the process where input parameters yield increased shear strength.Brazing was thus implemented with 5,000A brazing current, 0.70 MPa electrode pressure, and 1.50s brazing time. The maximum shear strength obtained was 54.31 N⋅mm-2 in accordance with input parameter settings. In addition, Cu-rich phase and Ag0.4Fe0.6 intermetallic phases were found at the interface zone.
1. Introduction
In the automotive industry,resistance spot welding(RSW)is an important process in joining sheet metal, due to the worthwhile procedure-high capacity in productivity and low cost.The method consolidates the joints stably [1-4]. According to the sheet metal for the automobile is highly significant,the technologies of weight reduction in automobiles using sheet metal are effective to save energy and reduce pollution from decreasing fuel combustion.However, new materials have been introduced that have replaced traditional steel to reduce overall construction weight. Thus,advanced high strength steel (AHSS) is now used for automotive parts to improve the fuel efficiency of automobiles by reducing their weight, while ensuring safety and strength. The two most frequently used AHSS in the automotive industry are dual phase(DP) steel and transformation induced plasticity (TRIP) steel [5,6].Both steels are excellent combinations of strength and formability.In addition, DP steel has a fused microstructure of soft ferrite and hard martensite leads to enhance ductility and work hardening[7,8]. As with stainless steel (SS), it is widely used in many industries as well as in car components. It has a strong resistance to corrosion and high strength. However, the process of welding SS can reduce the corrosion resistance and therefore the strength of joints [9].
Generally, RSW failure occurs in interfacial failure (IF) and pullout failure(PF)mode[10].The RSW of austenitic stainless steel(ASS)results in a greater hardness value of the fusion zone(FZ)than that of the base material(BM),similarly with the AHSS spot welds[11].This is due to the FZ microstructure predominately consisting of martensite phase,and can be the formed with voids and crack at the interface zone[12,13].However,dissimilar RSW of AHSS and SS by RSW has been studied by some research. In a dissimilar joint consisting of DP steel and ASS the weld nugget is composed of austenitic-martensitic structure, and presented the PF type of fracture which started from the softer BM(i.e.ASS)due to the weld nuggets martensitic structure providing a relatively high strength and hardness[14,15].Furthermore,the dissimilar joint of AHSS and ASS by conventional RSW have several problems such as different electrical conductivity,the Zn layer on DP steel had to be removed during RSW, and SS is more sensitive to contact pressure, which causes a too deep indentation in respect to DP steel,decreasing the aesthetic appearance of the weld[15].
The brand-new techniques in improving material joining in the welding industry become principal in the automobile productions[16].The brazing method is a technique known for its ability to join dissimilar metals, especially materials with different melting points.Therefore,the development of resistance spot brazing, as a technique used to solve the problem of joining dissimilar sheet metals,will ensure the quality and reliability of joints in automotive parts.The technique used filler metal and can improve the strength of the brazing joint [17,18]. However, the strength of the brazing joint is subject to a variety of variables, e.g. current, pressure, and time, and have a significant effect on the microstructure and mechanical properties of the brazed joints[4,19].A review of literature also revealed various influence of the variables when joined via RSW. The strength of the bonding at interface was subject to the joining variables.Manladan et at[20].found that current variable in RSW process effects the nugget size, peak load and energy absorption. With increased current, both the peak load and energy absorption decrease because of increased nugget size. This high nugget size was attributed to the occurrence of the failure mode transformed in to substrate [20,21]. Thus, the increased current variable has a negative effect on strength [14,20,21]. On the contrary, with the welding time and electrodes force, the strength of joint increased when the variable value increased[14].Despite the numerous research studies on variables and optimization in dissimilar metal joint process,there is no indication of the use of metal fillers,especially with the AHSS and ASS in spot brazing processes.
This paper aimed to study the optimal resistance for spot brazing conditions of dissimilar materials, AHSS and ASS, using a filler metal at the overlapped area of the joints. The brazing variables examined were brazing current, electrode pressure, and brazing time. The Taguchi approach was used in the statistical design of the experiment technique to optimize the selected brazing parameters, in terms of the maximized shear strength.
2. Experiments
2.1. Materials and methods
AHSS(DP 590 grade)and ASS(AISI 304 grade)are the materials employed in this research, as 100 mm×30 mm×1.2 mm threedimensional rectangular plates. The filler metal (Sil CD 1050-5 M grade)is 30 mm×30 mm in dimension with a thickness of 1.0 mm to be applied for spot brazing in the interface zone of the joint.The chemical composition of substrate steels and filler metal are displayed in Table 1.In the brazing processes,the FAN model PROTON E+ spot welding machine was employed to experiment brazing,with electrodes composed of copper alloys. Fig. 1 illustrates the schematic resistance spot brazing with filler metal application.
The Zwick model Z020 universal testing machine was employed to evaluate shear strength of each brazed specimen, with the test speed of shear strength at 0.50 mm·min-1. After identifying optimal brazing conditions, the failure and specimen microstructure was further analyzed. To examine the joint of spot brazed surface and failure, optical images at low magnification were acquired on a JENCO model V203410 optical microscope.
Specimens were mounted and polished to determine microstructure.The specimens were polished using SiC paper of 400,600,800, 1,000 and 1,200 respectively, and Al2O3with size of 0.3 and 0.1 μm,respectively.The ion beam milling(HITACHI model IM 4000 PLUS)technique was then employed to replace traditional chemical etching process.After ion milling, the microstructure and intermetallic phases were examined by scanning electron microscopy(SEM)from 300x SEM images using backscattering electron composition(BEC)modes.The SEM used in this experiment was HITACHI model TM3030 Plus coupled with energy dispersive X-ray spectroscopy(EDS) to determine chemical composition of microstructure and intermetallic phases presented in the specimens.The EDS employed was OXFORD model AztecOne.In addition,the elements distribution within the interface zone were analyzed using the EDS line scanning and mapping techniques. The phase of brazing specimens was confirmed using X-Ray Diffraction (XRD) to characterize the lattice structure of phase and intermetallic compounds at the interface of the specimen. The XRD used in experiment was Bruker model D8-Discover. The measurement conditions were; voltage 40 kV, current 40 mA,scanning speed 0.5°/s,scanning angle(2θ)25-80°.
2.2. Experimental designs
The experimental design in this study applies the Taguchi approach L27 orthogonal array.Three key investigated parameters being the brazing current, electrode pressure and brazing time,with three levels in each parameter. Levels in the brazing parameters are available on the machine controller as displayed in Table 2.Brazing condition selection is based on typical spot welding machine operating ranges recommended and previous research studies for steels [14,22]. With an objective of attaining optimized shear strength,the relative quality of a particular parameter design is evaluated utilizing a signal-to-noise(S/N)ratio.S/N ratio thus was identified as the Better approach, whether Smaller is better approach, or Larger is better approach is determined by Equations(1)-(3),respectively.Larger is the better was used in analysis of the experiment.

Table 2Resistance spot brazing parameter and levels in experimental.

Table 1Chemical compositions of the steel and filler metal.
Better approach

Smaller is better approach Larger is better approach


where S/N is the signal-to-noise ratio,yiis output characteristic and n is number of trials.
3. Results and discussion
3.1. Selection of optimization parameter
To ascertain optimum brazing performance,the first step was to calculate S/N ratio for the shear strength. Table 3 illustrates shear strength levels obtained and the corresponding S/N ratio applied that led to the outcome. The S/N ratio and mean procedure were performed by using the Minitab software.The total mean S/N ratio of twenty seven experiments was calculated as 31.74 dB. Shear strength was obtained by means of brazing current, electrode pressure, and brazing time settings specified in Fig. 2. It was clear that the most effective S/N ratio with regards to obtaining optimum shear strength from spot brazing was carried out with the following settings: 5,000A brazing current (Level 3), 0.70 MPa electrode pressure(Level 3),and 1.50s brazing time(Level 2).However,from plot of main effects, when brazing current and electrode pressure are increased,strength of brazed joint is increased.This because the heat input to the sheet becomes more intense with increasing brazing current and electrode pressure leading to larger diameter of the weld nugget, consistent with the results obtained by Anijdan et al. [14]. On the contrary, with the longer brazing time, the strength of specimen was decreased when brazing time increased,because the heat input becomes more intense with increasing brazing time and attributed to longer diffusion time during increased post weld time. The increase of total thickness of the intermetallic layer, which resulted in drastically reducing the joint strength[18].Table 4 illustrates levels ranking in each of the three variables,i.e.,brazing current,electrode pressure and brazing time,that significantly influence shear strength. The Delta and Rank value to identify the factors that have the largest effect on response characteristic. The brazing current has more significant effect on shear strength because of the high value of the Delta as compared to electrode pressure and brazing time.
As demonstrated in Table 5,an analysis of variance(ANOVA)was applied to determine the effect of each key attribute in accordance with applied S/N ratio.The ANOVA table containing the degrees of freedom (DF), sequential sums of squares (ss), adjusted sums of squares (SS), adjusted mean squares (MS) and probability of significance (P-value). The sequential sums of squares and adjusted sums of squares is measure of the deviation of the experimental data. Adjusted mean squares also called variance measures the distribution of the data. MS and F-value can be calculated by according to Equations (4) and (5), respectively.

The larger the F variant,the larger the effect of factor.The ANOVA procedure revealed the largest F value was in the brazing current.That means,the brazing current bears more effect on the accuracy of measurement and outcome than that of the two other key variables.Thus,optimization was calculated using the Minitab with predicted shear strength in optimal cutting condition of 60.40 N⋅mm-2.a moderate ductile fracture.No PF mode was observed in this study.Fig. 4 presents a stress-strain plot of a confirmed specimen.Confirmation experiments of the responses compared with the Taguchi method resulted in shear strength difference of 10.55%. In addition, shear strength of brazed joints increased by 23.07%compared with non-filler metal brazed joints.The stress-strain plot of confirmed specimen brazed without a filler metal is displayed in Fig. 5. This indicates that shear strength of the spot brazed joints sample is determined by the same brazing parameters of brazing current, electrode pressure and brazing time of the optimized values. Identical experimental conditions were used for the nonfiller brazed joints, which may not be optimal conditions.
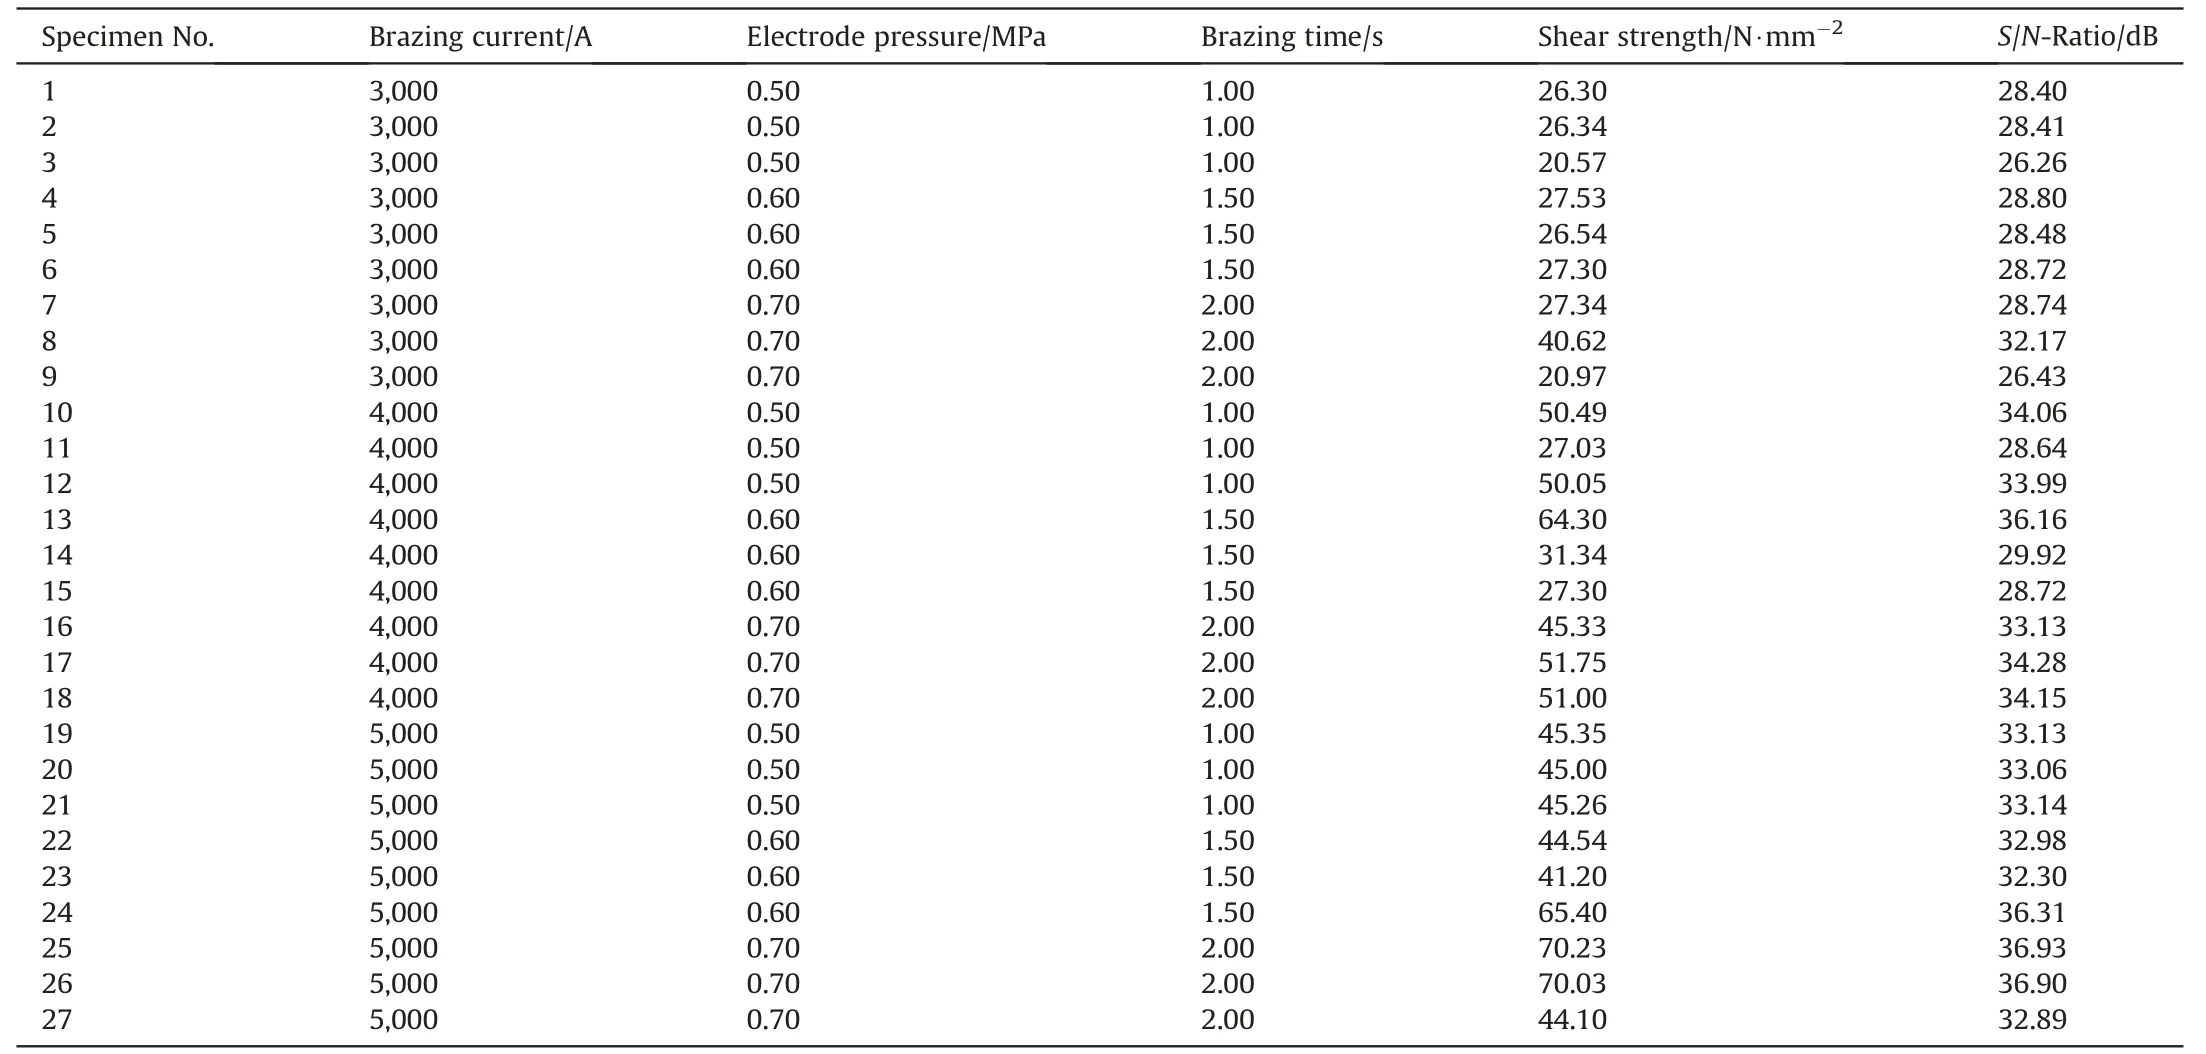
Table 3Results for shear strength with S/N ratio.
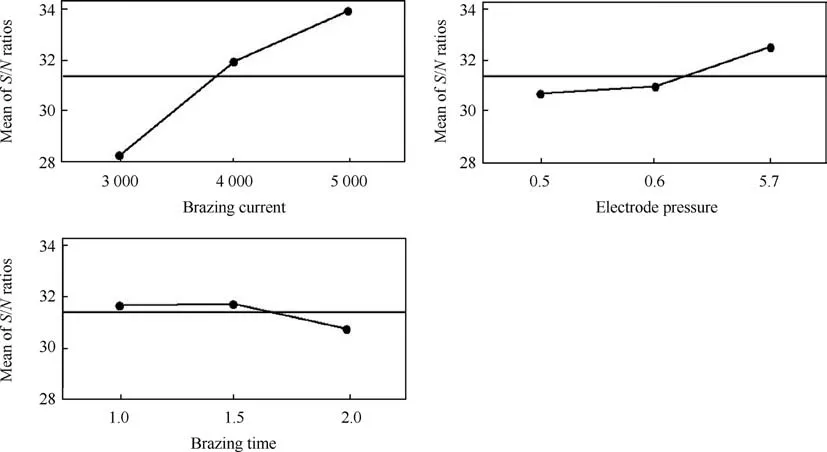
Fig. 2. Main effects plot for S/N ratio.

Table 4Significant factor ranking.

Table 5Analysis of variance for the shear strength.
3.2. Verification experiment
After setting parameters to optimized values,the next step was verifying that controlled conditions are optimum for experimental purposes. As such, confirmed specimens are brazed in 54.31 N⋅mm-2experimental conditions. The joint characteristic of a spot brazed surface and failure of a confirmed specimen is shown in Fig.3.Good surface and uniformly expands the nugget as seen in Fig. 3 (a). The failure mode of the spot brazed surface is shown in Fig.3(b)where the joint fractured by IF mode,the fracture showed
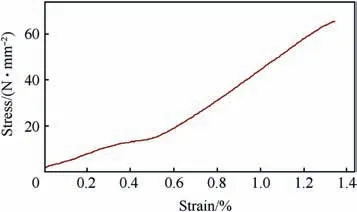
Fig. 4. Plot of the stress and strain of confirmation specimen.

Fig. 3. Joint characteristic of confirmation specimen.
Fig. 6 and Fig. 7 presents the interface microstructure and element line scanning of the brazed joint. The interface of the optimal brazed joint specimen consisted of Ag and Cu content from the filler in the joints. In the case of not adding filler metal, the presence of Cr and Fe elements at the interface zone suggesting some diffusion of the atoms from the base metals.Thus,the existing elements and the formation of the intermetallic phase in the brazed joint promote high strength compared with non-filler joint. These differences in interface microstructure clearly explain why the joints produced with adding filler metal are significantly stronger than those produced without adding filler metal. The filler results in an Ag and Cu rich solid solution layer which attributes to the strength.
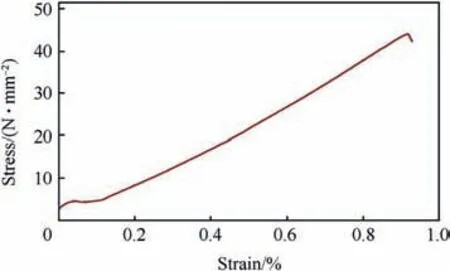
Fig. 5. Plot of the stress and strain of specimen with no adding filler metal.
The EDS joint composition maps obtained via SEM presented in Fig. 8 clearly demonstrates element distribution in brazed joint.From SEM and EDS examinations, three layers (A, B, and C layers)are identified at the brazed interface. The phase composition of region A was Ag0.4Fe0.6phase. Due to Fe atoms diffusion into the filler metal from the steel side, consistent with, resulting in a combination between Ag and Fe to form a thin Ag0.4Fe0.6phase.In addition,no Zn element was found,because of zinc diffusion away from the filler metal during brazing [18].
Region B is a Cu-rich phase, the phase region was produced by complete isothermal solidification of the alloy filler [19]. Zhang et al. [23] document that the Cu interlayer was introduced in the brazing procedure, the joint strength increased and hinder the formation of intermetallic compound. Region C, could be seen in the layer that the matrix of Cu-rich phase is surrounded by fine grain boundaries of Ag0.4Fe0.6.However,the coarser grains and the formation of intermetallic compounds led to the reduction of strength of the brazed joints [24]. Additionally, the ascertained thickness mean of each layer was 3.82,42.41 and 67.89 μm,for layer A,B,and C,respectively.Fig.9 illustrates XRD patterns in the brazed joint.From XRD analysis,Ag0.4Fe0.6and Cu-rich phase identified in this study was a FCC lattice structure.The finding indicates that the quality of brazed joint of optimization result is great enough and acceptable. In other words, filler metal enhance the joint strength and could be applied to improving the ability of brazed joints.
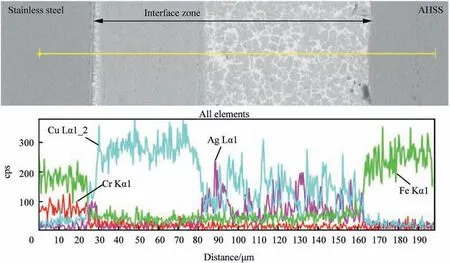
Fig. 6. Microstructure and element line scanning results of the optimal brazed joint specimen.
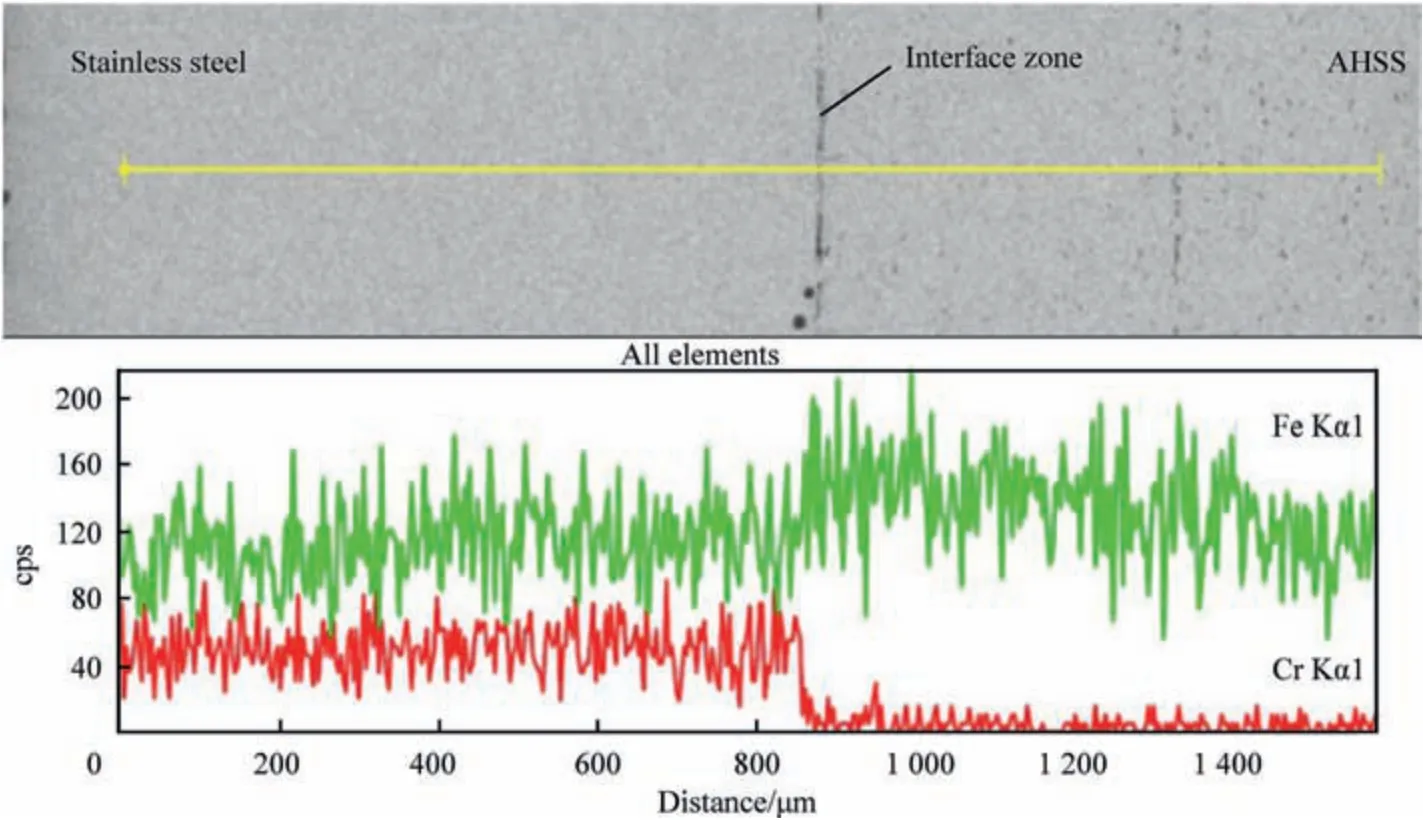
Fig. 7. Microstructure and element line scanning results with no addition of filler metal.
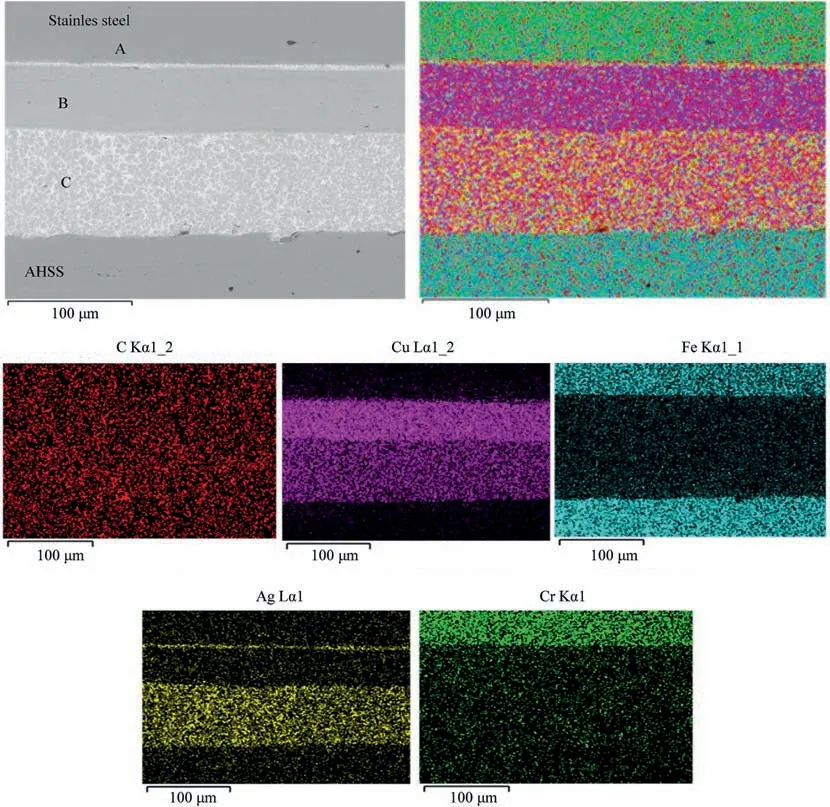
Fig. 8. SEM images and EDS elemental mappings of the joint.
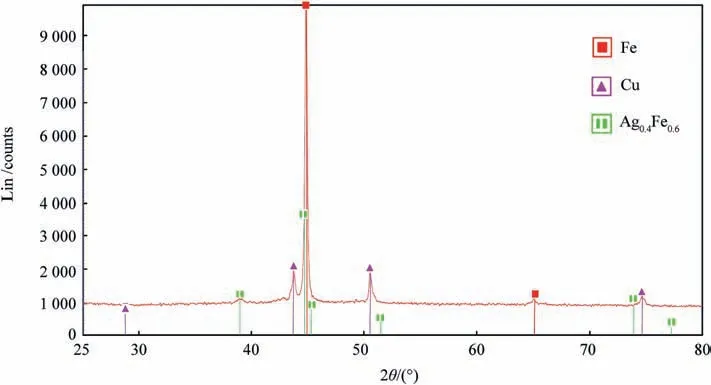
Fig. 9. XRD pattern of brazed joint.
4. Conclusions
The study has ascertained resistance parameter optimization for AHSS-AISI 304 stainless steel joints spot brazed accordingly to the established main aim. In applying filler metal to the interface area of brazed joints, the effect of each variable was identified using an ANOVA. The rank of variables in descending order are brazing current greater than electrode pressure and brazing time. The optimal brazing conditions were acquired from Taguchi method,it is concluded that for maximum shear strength, factors of brazing current and electrode pressure has to be at a high level, while brazing time has to be kept at a medium level.In the resistance spot brazed joint phase formation,failure occurs through fusion zone at the interface.In addition,the Ag0.4Fe0.6intermetallic phase,Cu-rich phase and matrix phase are identifiable. The matrix phase with mixed microstructure from the Cu-rich phase will be surrounded by Ag0.4Fe0.6grain boundaries. All phase and intermetallic compounds found in this study have FCC structure.
Acknowledgments
The authors would like to express deep gratitude and sincere appreciation to the National Research Council of Thailand (NRCT)under contract number A104/2017 for the financial support of this research. The indebtedness is also extended to the Rajamangala University of Technology Rattanakosin for the financial contributions.
杂志排行
Defence Technology的其它文章
- Body armour - New materials, new systems Ian G. Crouch*
- Special materials in pyrotechnics VII: Pyrotechnics used in thermal batteries☆
- Real-time calculation of fragment velocity for cylindrical warheads
- Heavy metal free primers: Polymorphism of gadolinium and titanium in the context of GSR glass phase Felice Nunziata
- Mitigation of EDFA transient effects in variable duty cycle pulsed signals
- Ballistic impact properties of woven bamboo- woven E-glassunsaturated polyester hybrid composites
