A Multiple Validation Based Methodology of Confidence Level Assessment for Virtual Test of Ship Hydrodynamics
2019-07-08WUChengshengZHAOFengSHENHongcui
WU Cheng-sheng,ZHAO Feng,SHEN Hong-cui
(China Ship Scientific Research Center,Wuxi 214082,China)
Abstract:A multiple validation based methodology of confidence level assessment for virtual test of ship model hydrodynamics is presented.The methodology is based on the procedure of uncertainty analysis,validation of optimal solution,validation by big sample data,in which the uncertainty analysis is based on orthogonal design and variance analysis methods and statistic inference theory,the validation of optimal solution is based on effect analysis in orthogonal design and principle of minimum deviation;the virtual test method is validated by statistical analysis of comparison with a large numbers of experimental data.The procedure is applied to practice with virtual test of ship model resistance,and the result shows that the methodology of confidence level assessment is reasonable and effective.
Key words:confidence level assessment;multiple validation;virtual test;ship hydrodynamics
0 Introduction
CFD application is one of the most impressive progresses in the research on ship hydrodynamics.It is now becoming a powerful tool and involved intensively in the procedure of ship design.With the rapid development of CFD application and correlative technologies,‘numerical tank'is now a hotspot in the research field of ship hydrodynamics again.
The research team of CSSRC has made many efforts on the development of numerical tank.Based on our research and practice,the technical content,characteristic and definition of numerical tank were given and the route map towards it is also presented(Zhao and Wu,2014)[1].The differences between numerical tank and CFD in several aspects are analyzed,the two families of key issues in research and development of CFD and numerical tank are presented and discussed in detail(Zhao and Wu,2015)[2].
According to our previous work,the basic essence of numerical tank is virtual test and service of application.Here,virtual test of ship hydrodynamics based on‘attribute subdivision'and‘knowledge encapsulation'of CFD is a revolutionary development of CFD application.
User's confidence to the computational results is one of the crucial issues in CFD application.As the method of confidence level assessment,CFD uncertainty analysis has been investigated for more than 30 years.AIAA and ITTC have put forward their recommended proce-dures for CFD uncertainty.From then on,a lot of research work has been carried out based on the recommended procedures(Simonsen and Stern,2003[3];Van et al,2003[4];Campana et al,2004[5];Zhu et al,2007[6]and Zhang et al,2008[7]).
Likewise,user's confidence to the result of virtual test is also one of key factors that affect the practical application of it.The CFD uncertainty analysis method used at present needs to be analyzed case by case when dealing with different objects,and the procedure of validation depends on the results of benchmark model tests,meanwhile,the result or conclusion drawn by the analysis is not generally applicable to the problems of the same type.So it is not suitable for the confidence level assessment for virtual test of ship hydrodynamics obviously.Then,a new methodology should be set up to ensure that when dealing with one type of problem after‘attribute subdivision',the results of virtual test will be reliable and have practical precision.
A multiple validation based methodology of confidence level assessment for virtual test of ship model hydrodynamics is proposed in this paper.The methodology is based on the procedure of‘uncertainty analysis,validation of optimal solution,validation by big sample data',in which the uncertainty analysis is based on orthogonal design and variance analysis methods and statistic inference theory,the validation of optimal solution is based on effect analysis in orthogonal design and principle of minimum deviation;the virtual test method is validated by statistical analysis of comparison with a large number of model test data.The procedure is applied to practice with virtual test of ship model resistance,and the result shows that the methodology of confidence level assessment is reasonable and effective.
Part I Methodology of confidence level assessment
1 Method for uncertainty analysis
The detailed description of the method for CFD uncertainty analysis can be found in Ref.[8].A brief introduction of the key points in uncertainty analysis,i.e.,the procedures of verification and validation,will be presented in this paper.
1.1 Procedure of verification
The method and procedure of verification based on orthogonal design and variance analysis methods can be summarized as below:
(1)Analyze the uncertainty or error sources for a given type of virtual test and select the important sources as the test factors.Then design reasonable variation levels for them.
(2)Select suitable orthogonal table and design scheme of virtual test.Then carry out virtual test according to the scheme.Carry out variance analysis for the results of virtual test and check whether some major factors(including the interaction between the factors)are omitted.
(3)Evaluation of type A uncertainty.Uncertainty of type A mainly comes from the effects of major factors and the interaction between them.It can be calculated by the following formula:

where xiis the i-th independent test result,is the mean value of xi,s)is the standard deviation of)and is also the standard uncertainty u(x).
(4)Evaluation of type B standard uncertainty.The component of uncertainty of type B is evaluated by non-statistical manner,it can be calculated as follows:

where a is the probable interval of test result,k is the coverage factor which is estimated by the confidence level of presumed probability distribution of test result.
The component of type B uncertainty in virtual test of ship hydrodynamics mainly comes from the possible error existing in the numerical method.Only the uncertainty caused by truncation error and iteration error can be evaluated presently.The uncertainty caused by other errors will be reckoned in component of type A uncertainty.
(5)Calculation of synthetical standard uncertainty.Synthetical standard uncertainty ucin virtual test is the summation of every standard uncertainty components(or variance)ui(x)and covariance if necessary.

where u( xi)and u( xj)are standard uncertainties of xiand xj,r is the estimated value of correlation coefficient of xiand xj.
(6)Calculation of expanded uncertainty.The expanded uncertainty U determines the interval of virtual test result.It is expected that the virtual test result falls into this interval with high probability.

where the coverage factor k will be determined by the desired confidence level.Generally,k=2-3.If k=2,it means that the virtual test result which obeys normal distribution will fall into the range of y±U(y is the estimated value of virtual test result)with probability level of 95%.
1.2 Procedure of validation
The method and procedure of validation are based on statistic inference theory.To some extent,both the results of model test and virtual test can be regarded as random variables and can be assumed to obey normal distribution N (μ, σ2).Strictly speaking,if the statistical characteristic parameters of expectations μ and variances σ of the two random variables are equal,no significant difference between them can be validated.So,validation can be defined as:the comparison process of the statistical parameters of the results of model test and virtual test by using statistical inference theory to estimate the reliability of the virtual test result,and evaluate the probability of it falls into the‘error band'of model test result.
Statistical inference is based on one or several sub-samples to infer or estimate the statistical characteristics of its or their population.In this paper,the expectation and variance of the result of(benchmark)model test are assumed to be known,so the problem is to judge whether both the expectation and variance of the model test result and virtual test result are equal respectively by using statistical inference method.If so,the result of virtual test is validated.
(1)F-test
The first step of the procedure of validation is to judge whether the variances of model test result and virtual test result are equal or not,which can be accomplished by F-test of statistical inference theory.


(2)t-test
From the theory of statistical inference,when the variance of the populations of two random variables is equal,whether the expectations are equal or not can be judged by using tdistribution test method.If the two samples are large enough and equal in size,even though the variance of them is not equal,t-test method can be applied approximately also.
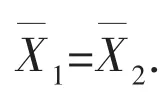

where σξ=σξ1=σξ2is the same root variance of the two populations,n1and n2are size of the two sub-samples.

2 Validation of optimal solution by benchmark data
2.1 Determination of optimal virtual test condition
One set of virtual test condition will be formed if every test factors are fixed at a set of certain levels.The optimal virtual test condition is defined as the set that will obtain the minimum test deviation and can be obtained according to effect analysis in orthogonal design.
According to the formation of data structure and the estimation of effect in orthogonal design,the optimal set of levels for test factors and the corresponding virtual test result can be obtained based on the principle of minimum deviation,i.e.,using residual εi=yi=mito substitute test result yiin the orthogonal array for analysis to obtain the set of virtual test condition with minimum ε.Here,miis the total effect of controlled test factors on yi,i.e.,the theoretical value of yi,and can be estimated as follows:

The theoretical value of virtual test result for any test conditions can be estimated by using this method,even if the test conditions do not exist in the sample.
2.2 Interval estimation and validation of optimal solution
As the optimal solution is obtained from the analysis of orthogonal designed sample and the statistical characteristics of the population is known,the interval estimation of the optimal solution itself is insignificant.What is important is the interval estimation of difference between the optimal solution and the model test result because this will determine whether the optimal solution is validated or not.
So the problem changes to the interval estimation of difference between the mean values of model test results and the model test results.Letdenote the probability of the difference that falls into the interval at requested confidence level.According to the characteristics of normal distribution,the interval estimation should be:

3 Validation of optimal virtual test condition
Strictly speaking,the uncertainty analysis result of virtual test according to the procedure presented above,along with the validated optimal solution and the optimal virtual test condition,is only valid to the object being analyzed.It is in doubt that if they are valid to the same kind of objects and tests or not.How to deal with this problem?It is no doubt that the validation by big sample data is the most feasible way at present.
In the procedure for uncertainty analysis and validation of optimal solution,benchmark model test data is used for validation,which has the characteristics of high precision,high accuracy and high reliability,and is certainly the best for the validation of virtual test.But benchmark model tests are quite expensive,so they are very limited and can not satisfy the requirement of‘validation by big sample'.
As known to all,some of the organizations which provide services of ship hydrodynamics model test have accumulated large numbers of experimental data during their long-time histories of model test service.Though the precision of these data is not comparable to that of benchmark model test data,they still have the characteristics of high accuracy and high reliability,and are very suitable for‘validation by big sample'.
So the optimal virtual test condition obtained by the procedures of uncertainty analysis and validation of optimal solution should be used in virtual tests for a certain number of ship models(samples)of the similar type and compare the results with experimental data.For a reliable optimal virtual test condition,the statistical characteristics of the difference between the virtual test results and the experimental data should be as follows:
(1)The difference between the virtual test results and the experimental data should obey normal distribution(with or without bias);
(2)Most(such as 90%or 95%)of the differences between the results(without bias)or the error-corrected results(with bias)of virtual tests and the experimental data should be in the acceptable range of practical application.
If the optimal virtual test condition has the characteristics mentioned above,it is valid to the same kind of objects and tests and of practical use.
A detailed description for the application process of this method will be presented below which takes virtual test of ship model resistance in calm water as the example.
Part II Confidence level assessment for virtual test of ship model resistance
4 Procedure of verification for virtual test of ship model resistance
The benchmark model DTMB5415 is selected for the confidence level assessment for virtual test of ship model resistance.The test case is a restrained model advancing in calm water with speed of 2.096 m/s(Fr=0.28)at design draft of 0.248 m.The result of model test used for validation is also from the corresponding condition(REXP=43.42 N).
4.1 Selection of test factors and label design of the virtual test plan
According to the analysis of process of virtual test for ship model resistance,it can be found that there are tens of factors which may affect the result of virtual test.After systematical analysis,four of them are selected as the test factors:quantity of cells for the subdivision of computational domain,y+,turbulence model and differential scheme for advective term in the control equations.The other factors are fixed to a certain settings and can be regarded as‘test condition'.
The levels of the factors are decided according to their characteristics of affecting the result of virtual test and experience of practical application.After the test factors are selected and their levels are decided,the table of factors level can be listed as Tab.1.

Tab.1 Factors'level(I)
Then,the suitable orthogonal table should be selected according to the factors,levels and whether the interactions between the factors are taken into account or not.
The problem studied in this paper is the virtual test plan of four test factors with three levels and the interactions between factors A,B,and C are considered.The label design of the virtual test plan will be as in Tab.2.The 10th,12th and 13th columns are blank(or error)columns.

Tab.2 Label design for the virtual test plan of L27(313)
4.2 Analysis of virtual test result
The virtual test plan will be formed based on the label design and orthogonal table.The virtual test plan was carried out;the results of ship model resistance RMare obtained and listed in Tab.3.
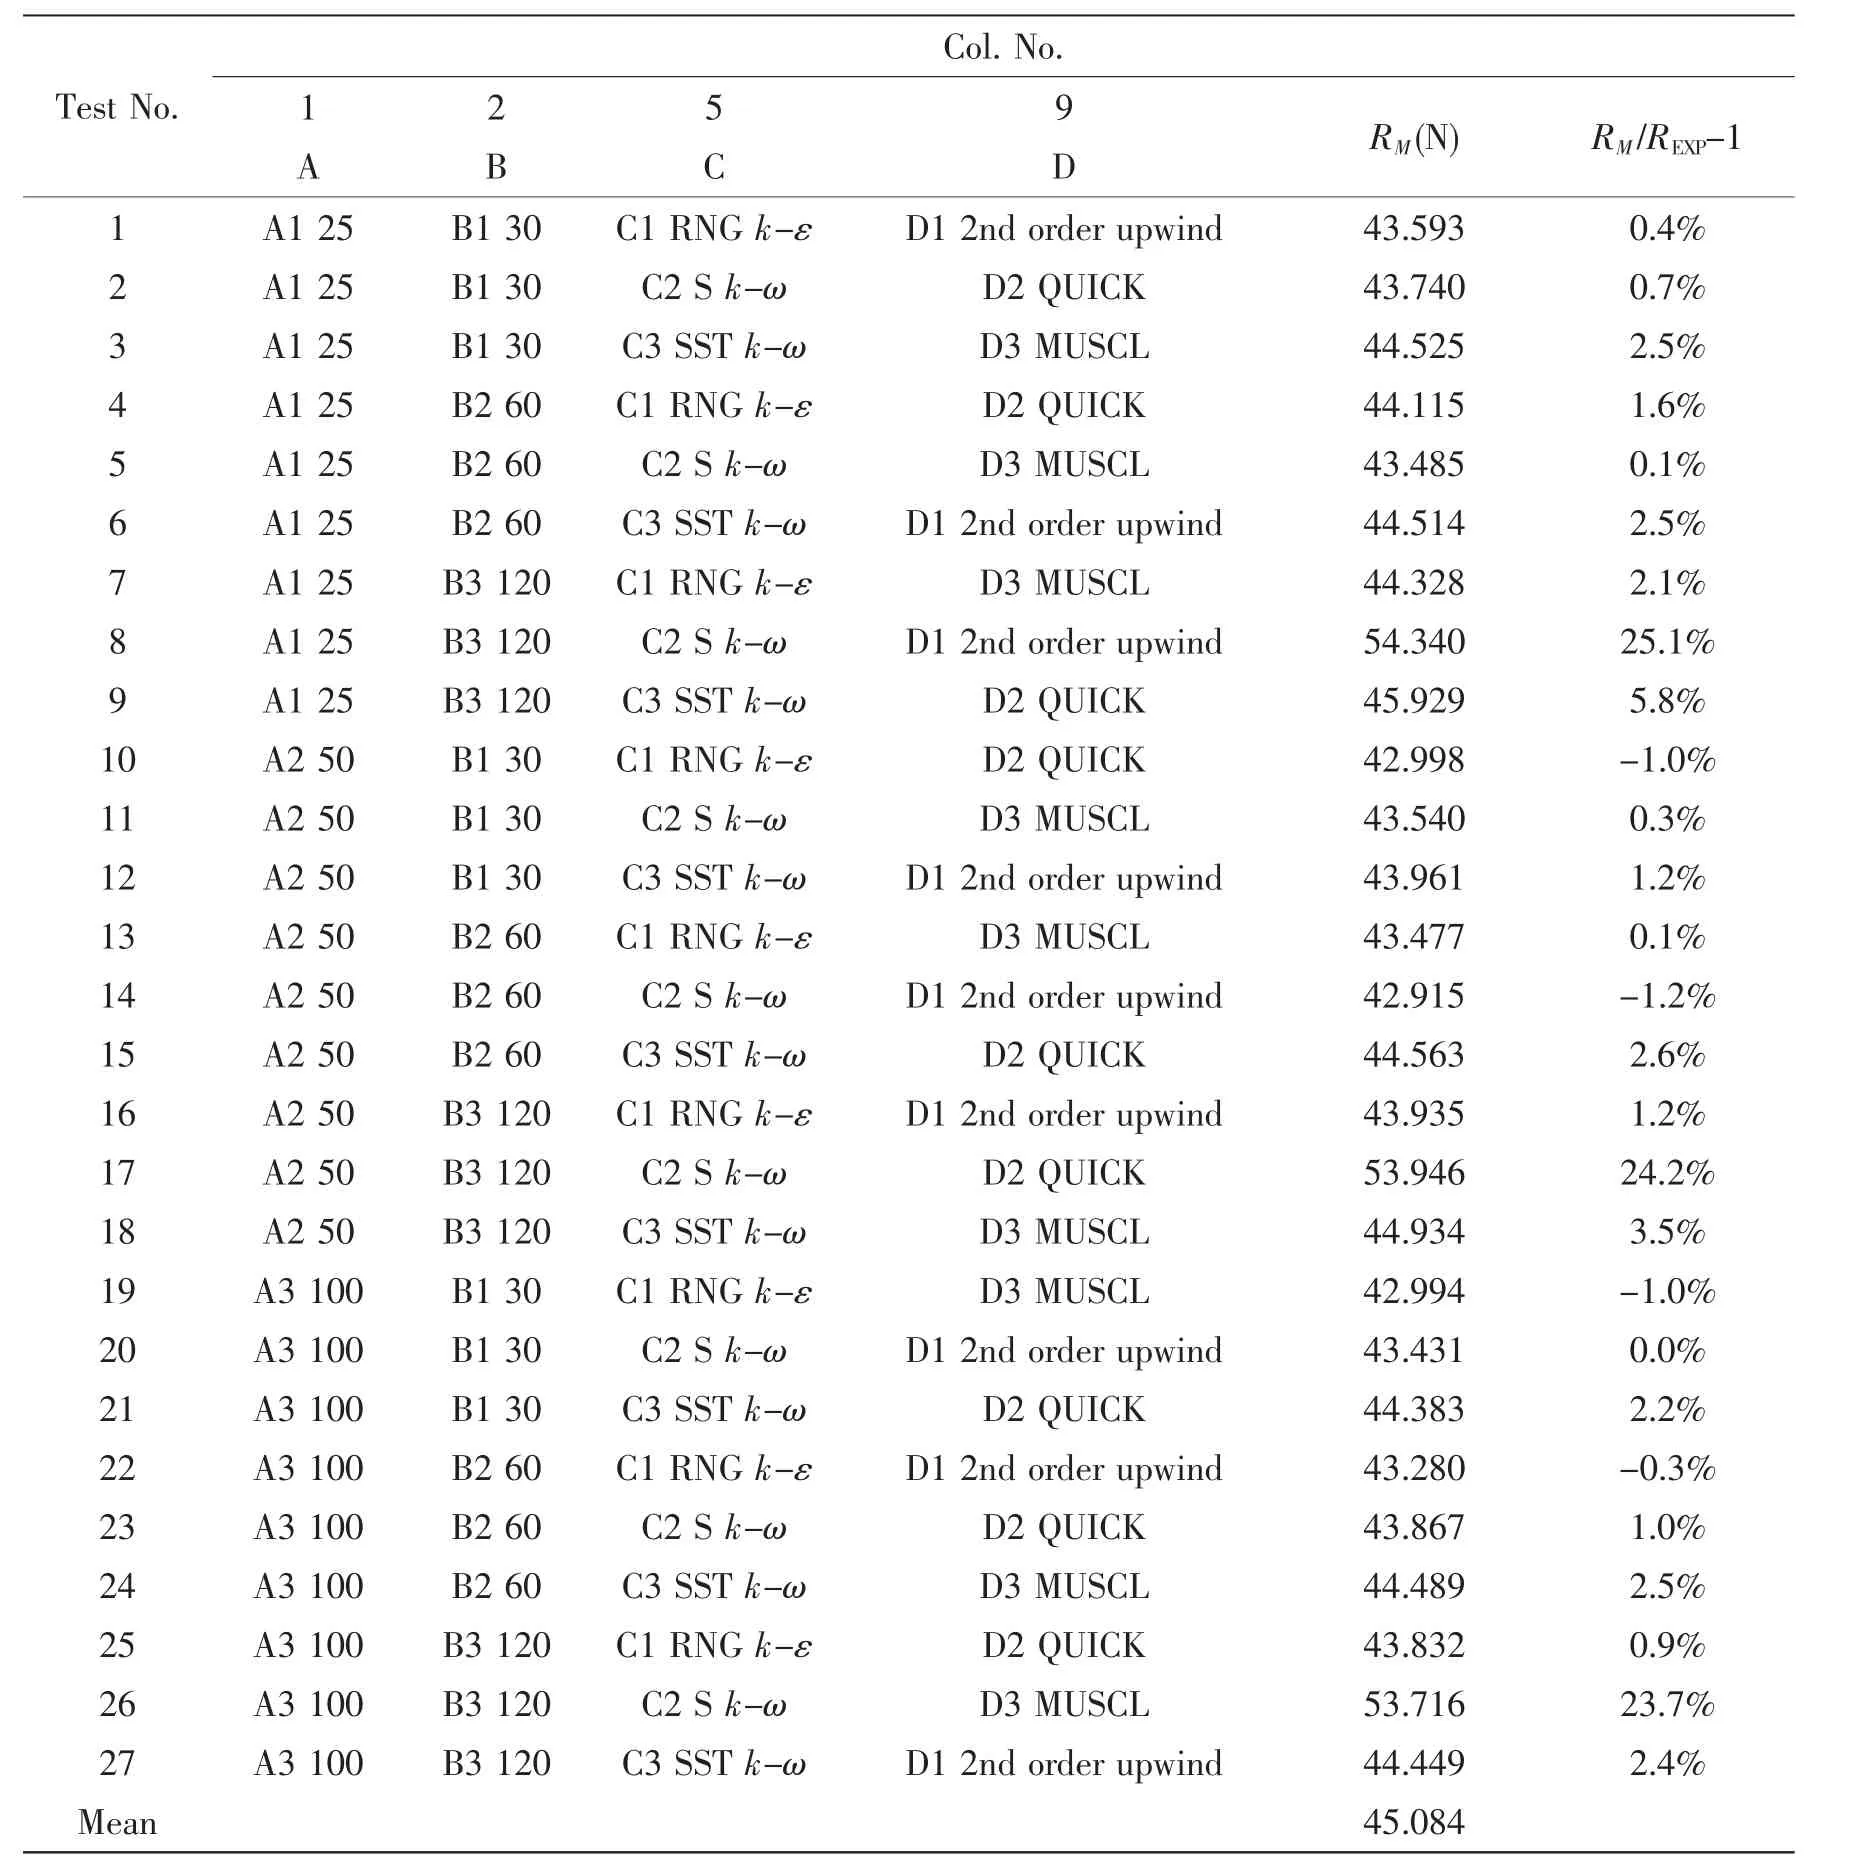
Tab.3 Virtual test results of the L27(313)plan
The variance analysis can be carried out based on the virtual test results.The results of variance analysis are listed in Tab.4.
The F ratio can be calculated based on the variances of every factor(including the interaction between factors)and the error.Taking factor A(quantity of cells)as an example:

The F ratio for the other factors(including the interaction between factors)can be calculated in the same way.The calculated results are listed in Tab.4.

Tab.4 Variance analysis of the L27(313)test plan

Continue 4
According to the F ratio for every factor and the interaction between them,it can be found that:Factors B(y+),B×C(interaction between y+and turbulence model)and C(turbulence model)have high-significant effect on virtual test result of ship model resistance.Factor A(quantity of cells)also has high-significant effect but the magnitude is much smaller than the former three factors.Factor D(Differential scheme)has some effect on virtual test result.
A statistical hypothesis is proposed:there is no significant difference between the effects of controlled factors and uncontrolled factors on the virtual test result.It can be checked by the following formula:

The significant difference indicates that the hypothesis is false,which means that in the virtual test of ship model resistance,the uncontrolled factors contribute little to the divergence of the virtual test result.This also indicates that the selection of the test factors is reasonable.
It should be pointed out that the precondition for this conclusion is that the‘test condition'must be the same,i.e.,the correlative factors such as topological structure of the mesh,range of the computational domain,differential scheme of temporal item,and re-construction scheme for free surface must be fixed to the same.
4.3 Evaluation of uncertainty for the virtual test
Each type of uncertainty can be evaluated based on the results of variance analysis.
(1)Type A standard uncertainty
Type A standard uncertainty can be calculated by the following formula(taking factor A as an example):

The standard uncertainty of the other factors and interaction between factors can be calculated in the same way.The results are listed in Tab.5.
(2)Type B standard uncertainty
Uncertainties caused by truncation error and iteration error can be categorized into type B standard uncertainty.Generally,uncertainty caused by iteration error is insignificant and can be ignored.The evaluation of uncertainty caused by truncation error is the essential study on grid convergence and can be calculated as follows:

where δREcan be estimated by Richardson extrapolation method.
(3)Synthetical standard uncertainty and expanded uncertainty
The synthetical standard uncertainty can be calculated based on types A and B uncertainties:

The expanded uncertainty will be,

The coverage factor k=2 means that the virtual test result which obeys the normal distribution will fall into the range of y±U(y is the estimated value of virtual test result)with probability level of 95%.
The evaluation of all types of uncertainties is listed in Tab.5.

Tab.5 Standard uncertainty of the L27(313)test plan
Tab.5 shows that the uncertainty of type B is insignificant.The synthetical standard uncertainty is composed of type A uncertainties.
It can be also found that the synthetical uncertainty is about 4.4%of the averaged result of virtual test while the expanded uncertainty is about 8.8%.This indicates that the precision of virtual test result for ship model resistance is relatively poor and is not suitable for practical application.So some measures should be adopted to improve the precision of it.
According to the analysis,uncertainty caused by turbulence model(factors C and B×C)is one of the main components.So it is recommended that a suitable turbulence model should be selected in virtual test of ship model resistance.S k-ω turbulence model is very sensitive to y+and should be used with much care.
4.4 Verification for the L9(34)test plan
According to the experience of practical application,RNG k-ε turbulence model is selected for virtual test of ship model resistance.At the same time,the interaction between cell quantity and y+can be ignored,and the interaction of differential scheme for advective term in the control equations between other factors can also be ignored.Then a new test plan can be designed,the factors level is listed in Tab.6.
The virtual test plan will be formed based on the label design and orthogonal table.The virtual test was carried out according to the test plan,the results are listed in Tab.7.

Tab.6 Factors'level(II)
Variance analysis can be also carried out in the same way used before.The results are listed in Tab.8.
According to the F ratio for every factor,it can be found that:Factor B(y+)and factor A(quantity of cells)have high-significant effect on virtual test result of ship model resistance;Factor C(Differential scheme)has insignificant effect on virtual test result.This conclusion is similar to that drawn from variance analysis of the L27(313)test plan.
Again a statistical hypothesis is proposed:there is no significant difference between the effects of controlled factors and uncontrolled factors on the virtual test result.It can be checked by the following formula:

The significant difference indicates that the hypothesis is false,which means that in the virtual test of ship model resistance,the uncontrolled factors contribute little to the divergence of the virtual test result.This also indicates that the selection of the test factors is reasonable.
It should be pointed out that the precondition for this conclusion is that the‘test condition'must be the same,i.e.,the correlative factors such as topological structure of the mesh,range of the computational domain,differential scheme of temporal item,and re-construction scheme for free surface must be fixed to the same.Besides,a suitable turbulence model must be selected.
Each type of uncertainty can be evaluated based the results of variance analysis.The results are listed in Tab.9.

Tab.9 Standard uncertainty of the L9(34)test plan
It is shown in Tab.9 that the uncertainty of type B is insignificant and can be ignored.The synthetical standard uncertainty is only composed of type A uncertainties.
It can be also found that when the suitable turbulence model is selected,the synthetical uncertainty decreases from 4.4%to 0.72%of the averaged result of virtual test while the expanded uncertainty decreases from 8.8%to about 1.5%respectively.This indicates that the precision of virtual test for the ship model resistance can satisfy the requirement of practical application.The precondition for this conclusion is that the‘test condition'should be fixed to the same and only applicable to ship model of the same type.
5 Procedure of validation for virtual test of ship model resistance
5.1 Validation for the L27(313)test plan

A statistical hypothesis is proposed:there is no significant difference between the effect of all test factors on virtual test result and the uncertainty of the corresponding model test.The F ratio can be calculated by the following formula:

The significant difference indicates that the hypothesis is false,which means that the variances of the populations generated from model test result and virtual test result are not equal.
This is a normal conclusion.For virtual test of ship model resistance,many test factors with different levels are included,this will necessarily cause relative large variance to the result.
As virtual test result of the L27(313)plan can not pass F-test,strictly speaking,the result can not be validated.Validation of the result of L9(34)test plan will be carried out then.
5.2 Validation for the L9(34)test plan
(1)F-test
A statistical hypothesis can also be proposed:there is no significant difference between the effect of all test factors on virtual test result and the uncertainty of the corresponding model test.The F ratio can be calculated by the following formula:

Because F1<Fα(fS,∞ ),the statistical hypothesis is proved to be true.
The conclusion of F-test for the L9(34)test plan is different from that for the L27(313)test plan.This is because in the L9(34)test plan fewer test factors are included,while one of the main source of uncertainty,i.e.,turbulence model is excluded.This makes the uncertainty of virtual test decreases significantly.
(2)t-test
As the result of L9(34)test plan passes the F-test,t-test can be applied then.


Because t1<tα,the statistical hypothesis is proved to be true.
This means that when the suitable turbulence model is selected and the proper grid is used,the precision of virtual test for ship model resistance can satisfy the requirement of practical application.This conclusion is valid at least to a certain type of ship model.
6 Validation of optimal solution for ship model resistance virtual test
6.1 Determination of optimal virtual test condition
According to the estimation of effect in orthogonal design,the optimal set of levels for test factors and the corresponding virtual test result and its error can be obtained.Take the L9(34)test plan as an example,the estimation of effect can be calculated as follows:

where N=9 is the sample size,Ai,Bjand Ckare summation of the values corresponding to factors A,B,C at levels i,j,k respectively.
Estimations of effect of factors A(cell quantity),B(y+)and C(differential scheme)for virtual test of calm water resistance of DTMB5415 are listed in Tab.10.It should be pointed out though the effect of factor C is listed in the table,it will not be taken into further calculation and analysis because it is categorized into error(Tab.8).
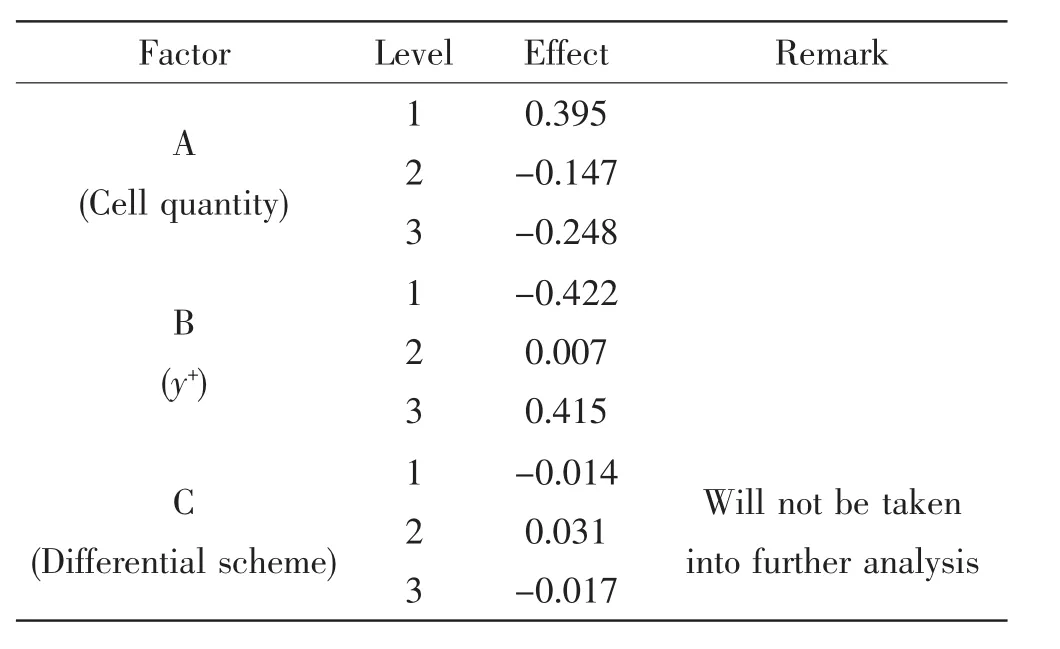
Tab.10 Estimation of effect for different factors in virtual test
According to the estimation of effect for the factors,the‘true values'mnof the virtual test can be calculated by using the following formulas along with the residual εn=RMn-mn.The results are listed in Tab.11.

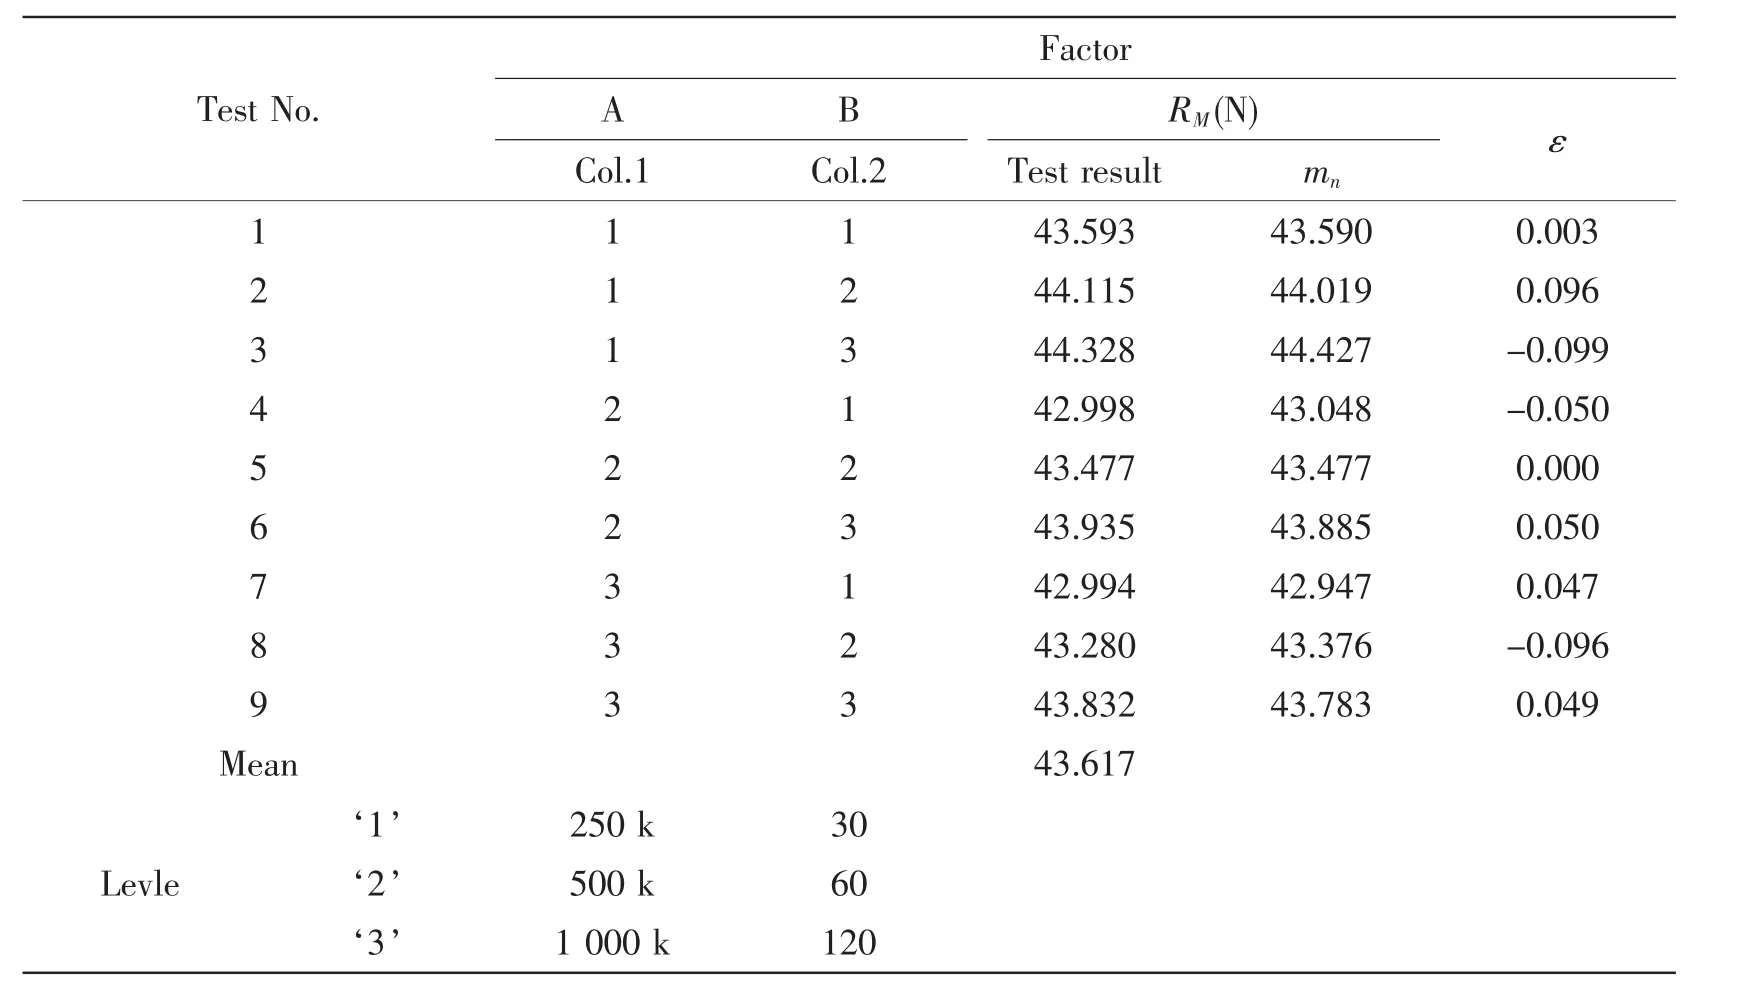
Tab.11 Results of residual in virtual test
It is shown in Tab.11 that test No.5 has the lowest residual.Then the estimation of the optimal solution can be calculated as follows:

6.2 Interval estimation and validation of optimal solution
As the optimal solution is obtained from the analysis of the orthogonal designed sample and the statistical characteristics of the population is known,the interval estimation of difference between the optimal solution and the model test result can be evaluated.Letdenote the probability of the difference at requested confidence level,according to the characteristics of normal distribution,the interval estimation can be calculated according to Eq.(8).
If the confidence level is 95%,then tα≈2.So the interval of confidence level 95%will be:

The result of virtual test at optimal condition isOPT=43.477 N and falls into this interval,which means that the difference between the optimal solution of virtual test and the result of model test will fall into in the interval ofwith confidence level of 95%,so the optimal solution is validated.
7 Validation of optimal virtual test condition by big sample
The optimal condition for virtual test of ship model resistance is applied routinely in practices in CSSRC.The differences between virtual test results of resistance for more than 40 ship models with 332 cases and the corresponding experimental data are statistically listed in Tab.12 and plotted in Fig.1.

Tab.12 Statistic of difference between virtual test results of resistance for ship models and the corresponding experimental data
As can be found in the table and figure:
(1)Most(98%)of the differences between virtual test results of resistance for ship models and the corresponding experimental data are less than 4%,and 92%of the differences are less than 3%;
(2)The differences obey normal(Gaussian)distribution of Err~N(μ,σ2)on the whole,in which μ≈-0.30 and σ≈1.88.
As the experimental data used here are the results of routinely towing tank model tests,the precision of them is not comparable to that of benchmark model test,it is reasonable that the interval of the differences is a little bigger.
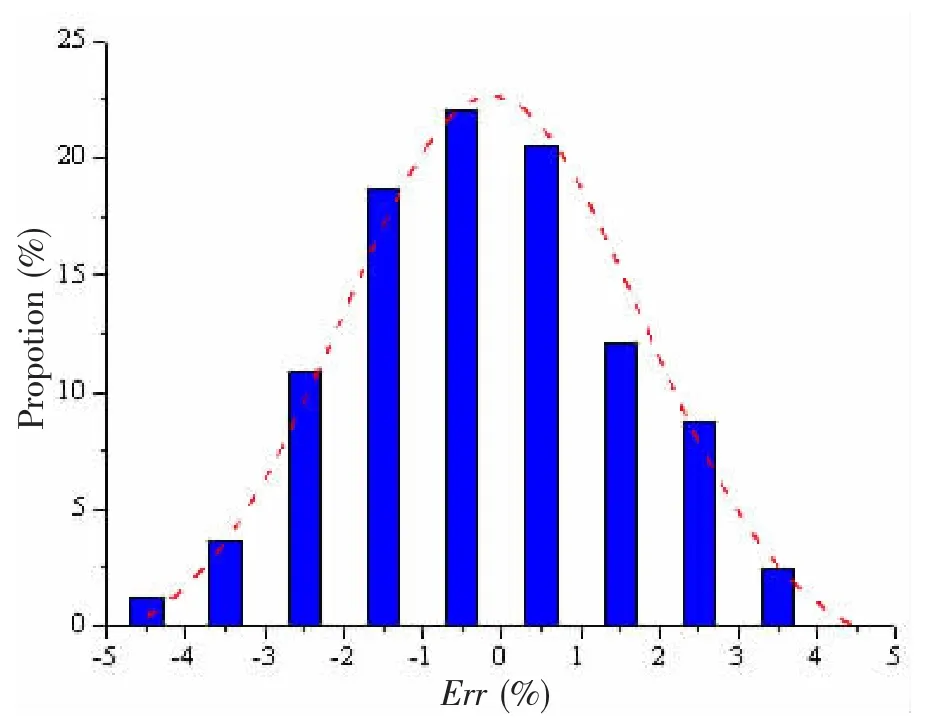
Fig.1 Distribution of difference between virtual test results of resistance for ship models and the corresponding experimental data
8 Concluding remarks
A confidence level assessment methodology based on the procedure of‘uncertainty analysis,validation of optimal solution,validation by big sample'is proposed in this paper.The procedure is applied to practice with virtual test of ship model resistance in calm water,and shows that the methodology of confidence level assessment is reasonable and effective.
If compared with ITTC procedure of uncertainty analysis in CFD,the proposed methodology has some advantages such as:it can tackle multiple factors and the interaction between the factors;it is applicable to structured,unstructured and mixed grid;the conclusion of confidence level assessment is generally applicable to the same type of problems.
Acknowledgements
The authors are very appreciative of the computational research work for this paper carried out by Wei Ze,Qiu Gengyao,Yan Daijun and Huang Miaomiao.
杂志排行
船舶力学的其它文章
- Time Domain Analysis on Ship Motions in Waves with Translating-Pulsating Source Green Function
- Research on the Mechanism and Characteristic of Added Resistance of Moonpool with Recess
- LQR Control of a Three Dimensional Underwater Glider
- A New Scheme for Vortex Sheet Diffusion in Fast Vortex Methods
- Research on the Design and Parameter Influence Law of A High-Static-Low-Dynamic Stiffness Vibration Isolator Using for Marine Equipment
- Experimental Investigation on Dynamic Behavior of Porous Material Sandwich Plates for Lightweight Ship
